Monitor Azure Analysis Services
This article describes:
- The types of monitoring data you can collect for this service.
- Ways to analyze that data.
Note
If you're already familiar with this service and/or Azure Monitor and just want to know how to analyze monitoring data, see the Analyze section near the end of this article.
When you have critical applications and business processes that rely on Azure resources, you need to monitor and get alerts for your system. The Azure Monitor service collects and aggregates metrics and logs from every component of your system. Azure Monitor provides you with a view of availability, performance, and resilience, and notifies you of issues. You can use the Azure portal, PowerShell, Azure CLI, REST API, or client libraries to set up and view monitoring data.
- For more information on Azure Monitor, see the Azure Monitor overview.
- For more information on how to monitor Azure resources in general, see Monitor Azure resources with Azure Monitor.
Analysis Services also provides several non-Azure Monitor monitoring mechanisms:
- SQL Server Profiler, installed with SQL Server Management Studio (SSMS), captures data about engine process events such as the start of a batch or a transaction, enabling you to monitor server and database activity. For more information, see Monitor Analysis Services with SQL Server Profiler.
- Extended Events (xEvents) is a light-weight tracing and performance monitoring system that uses few system resources, making it an ideal tool for diagnosing problems on both production and test servers. For more information, see Monitor Analysis Services with SQL Server Extended Events.
- Dynamic Management Views (DMVs) use SQL syntax to interface schema rowsets that return metadata and monitoring information about server instances. For more information, see Use Dynamic Management Views (DMVs) to monitor Analysis Services.
Resource types
Azure uses the concept of resource types and IDs to identify everything in a subscription. Azure Monitor similarly organizes core monitoring data into metrics and logs based on resource types, also called namespaces. Different metrics and logs are available for different resource types. Your service might be associated with more than one resource type.
Resource types are also part of the resource IDs for every resource running in Azure. For example, one resource type for a virtual machine is Microsoft.Compute/virtualMachines. For a list of services and their associated resource types, see Resource providers.
For more information about the resource types for Analysis Services, see Analysis Services monitoring data reference.
Data storage
For Azure Monitor:
- Metrics data is stored in the Azure Monitor metrics database.
- Log data is stored in the Azure Monitor logs store. Log Analytics is a tool in the Azure portal that can query this store.
- The Azure activity log is a separate store with its own interface in the Azure portal.
You can optionally route metric and activity log data to the Azure Monitor logs store. You can then use Log Analytics to query the data and correlate it with other log data.
Many services can use diagnostic settings to send metric and log data to other storage locations outside Azure Monitor. Examples include Azure Storage, hosted partner systems, and non-Azure partner systems, by using Event Hubs.
For detailed information on how Azure Monitor stores data, see Azure Monitor data platform.
Azure Monitor platform metrics
Azure Monitor provides platform metrics for most services. These metrics are:
- Individually defined for each namespace.
- Stored in the Azure Monitor time-series metrics database.
- Lightweight and capable of supporting near real-time alerting.
- Used to track the performance of a resource over time.
Collection: Azure Monitor collects platform metrics automatically. No configuration is required.
Routing: You can also usually route platform metrics to Azure Monitor Logs / Log Analytics so you can query them with other log data. For more information, see the Metrics diagnostic setting. For how to configure diagnostic settings for a service, see Create diagnostic settings in Azure Monitor.
For a list of all metrics it's possible to gather for all resources in Azure Monitor, see Supported metrics in Azure Monitor.
For a list of available metrics for Analysis Services, see Analysis Services monitoring data reference.
Azure Monitor resource logs
Resource logs provide insight into operations that were done by an Azure resource. Logs are generated automatically, but you must route them to Azure Monitor logs to save or query them. Logs are organized in categories. A given namespace might have multiple resource log categories.
Collection: Resource logs aren't collected and stored until you create a diagnostic setting and route the logs to one or more locations. When you create a diagnostic setting, you specify which categories of logs to collect. There are multiple ways to create and maintain diagnostic settings, including the Azure portal, programmatically, and though Azure Policy.
Routing: The suggested default is to route resource logs to Azure Monitor Logs so you can query them with other log data. Other locations such as Azure Storage, Azure Event Hubs, and certain Microsoft monitoring partners are also available. For more information, see Azure resource logs and Resource log destinations.
For detailed information about collecting, storing, and routing resource logs, see Diagnostic settings in Azure Monitor.
For a list of all available resource log categories in Azure Monitor, see Supported resource logs in Azure Monitor.
All resource logs in Azure Monitor have the same header fields, followed by service-specific fields. The common schema is outlined in Azure Monitor resource log schema.
- For the available resource log categories, associated Log Analytics tables, and the logs schemas for Analysis Services, see Analysis Services monitoring data reference.
Analysis Services resource logs
When you set up logging for Analysis Services, you can select Engine or Service events to log, or select AllMetrics to log metrics data. For more information, see Supported resource logs for Microsoft.AnalysisServices/servers.
Azure activity log
The activity log contains subscription-level events that track operations for each Azure resource as seen from outside that resource; for example, creating a new resource or starting a virtual machine.
Collection: Activity log events are automatically generated and collected in a separate store for viewing in the Azure portal.
Routing: You can send activity log data to Azure Monitor Logs so you can analyze it alongside other log data. Other locations such as Azure Storage, Azure Event Hubs, and certain Microsoft monitoring partners are also available. For more information on how to route the activity log, see Overview of the Azure activity log.
Analyze monitoring data
There are many tools for analyzing monitoring data.
Azure Monitor tools
Azure Monitor supports the following basic tools:
Metrics explorer, a tool in the Azure portal that allows you to view and analyze metrics for Azure resources. For more information, see Analyze metrics with Azure Monitor metrics explorer.
Log Analytics, a tool in the Azure portal that allows you to query and analyze log data by using the Kusto query language (KQL). For more information, see Get started with log queries in Azure Monitor.
The activity log, which has a user interface in the Azure portal for viewing and basic searches. To do more in-depth analysis, you have to route the data to Azure Monitor logs and run more complex queries in Log Analytics.
Tools that allow more complex visualization include:
- Dashboards that let you combine different kinds of data into a single pane in the Azure portal.
- Workbooks, customizable reports that you can create in the Azure portal. Workbooks can include text, metrics, and log queries.
- Grafana, an open platform tool that excels in operational dashboards. You can use Grafana to create dashboards that include data from multiple sources other than Azure Monitor.
- Power BI, a business analytics service that provides interactive visualizations across various data sources. You can configure Power BI to automatically import log data from Azure Monitor to take advantage of these visualizations.
Azure Monitor export tools
You can get data out of Azure Monitor into other tools by using the following methods:
Metrics: Use the REST API for metrics to extract metric data from the Azure Monitor metrics database. The API supports filter expressions to refine the data retrieved. For more information, see Azure Monitor REST API reference.
Logs: Use the REST API or the associated client libraries.
Another option is the workspace data export.
To get started with the REST API for Azure Monitor, see Azure monitoring REST API walkthrough.
Analyze Analysis Services metrics
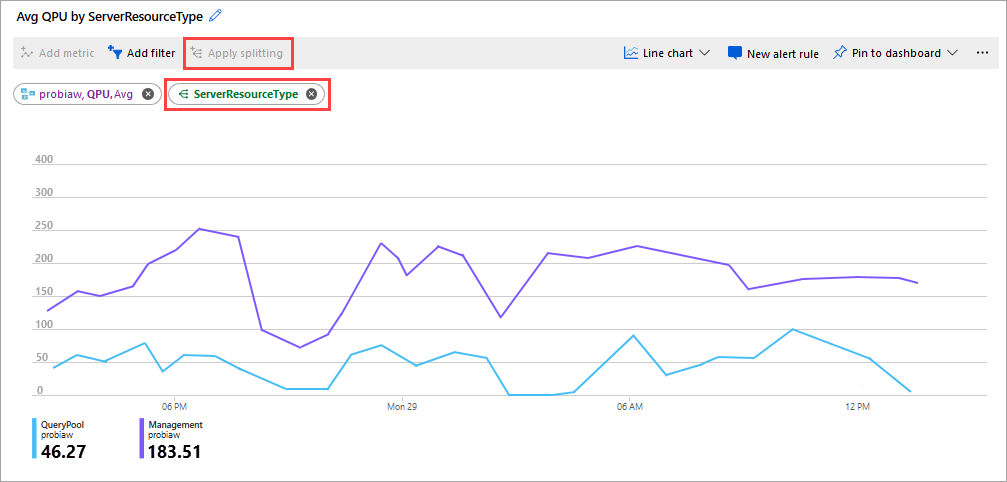
You can use Analysis Services metrics in Azure Monitor Metrics Explorer to help you monitor the performance and health of your servers. For example, you can monitor memory and CPU usage, number of client connections, and query resource consumption.
To determine if scale-out for your server is necessary, monitor your server QPU and Query pool job queue length metrics. A good metric to watch is average QPU by ServerResourceType, which compares average QPU for the primary server with the query pool. For detailed instructions on how to scale out your server based on metrics data, see Azure Analysis Services scale-out.
For a complete listing of metrics collected for Analysis Services, see Analysis Services monitoring data reference.
Analyze logs in Log Analytics workspace
Metrics and server events are integrated with xEvents in your Log Analytics workspace resource for side-by-side analysis. Log Analytics workspace can also be configured to receive events from other Azure services, providing a holistic view of diagnostic logging data across your architecture.
To view your diagnostic data, in Log Analytics workspace, open Logs from the left menu.
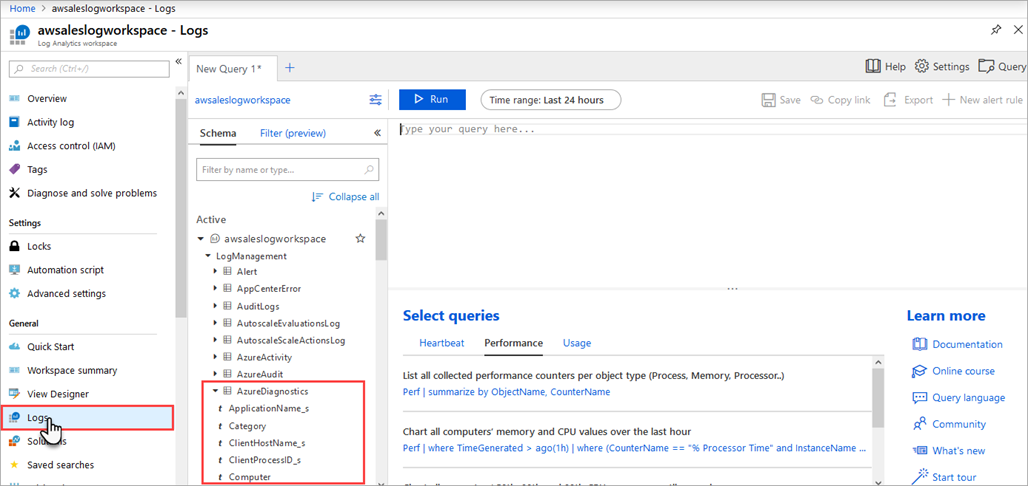
In the query builder, expand LogManagement > AzureDiagnostics. AzureDiagnostics includes Engine and Service events. Notice a query is created on the fly. The EventClass_s field contains xEvent names, which might look familiar if you use xEvents for on-premises logging. Select EventClass_s or one of the event names, and Log Analytics workspace continues constructing a query. Be sure to save your queries to reuse later.
Kusto queries
You can analyze monitoring data in the Azure Monitor Logs / Log Analytics store by using the Kusto query language (KQL).
Important
When you select Logs from the service's menu in the portal, Log Analytics opens with the query scope set to the current service. This scope means that log queries will only include data from that type of resource. If you want to run a query that includes data from other Azure services, select Logs from the Azure Monitor menu. See Log query scope and time range in Azure Monitor Log Analytics for details.
For a list of common queries for any service, see the Log Analytics queries interface.
The following queries are useful for monitoring your Analysis Services server.
Example 1
The following query returns durations for each query end/refresh end event for a model database and server. If scaled out, the results are broken out by replica because the replica number is included in ServerName_s. Grouping by RootActivityId_g reduces the row count retrieved from the Azure Diagnostics REST API and helps stay within the limits as described in Log Analytics Rate limits.
let window = AzureDiagnostics
   | where ResourceProvider == "MICROSOFT.ANALYSISSERVICES" and Resource =~ "MyServerName" and DatabaseName_s =~ "MyDatabaseName" ;
window
| where OperationName has "QueryEnd" or (OperationName has "CommandEnd" and EventSubclass_s == 38)
| where extract(@"([^,]*)", 1,Duration_s, typeof(long)) > 0
| extend DurationMs=extract(@"([^,]*)", 1,Duration_s, typeof(long))
| project  StartTime_t,EndTime_t,ServerName_s,OperationName,RootActivityId_g,TextData_s,DatabaseName_s,ApplicationName_s,Duration_s,EffectiveUsername_s,User_s,EventSubclass_s,DurationMs
| order by StartTime_t asc
Example 2
The following query returns memory and QPU consumption for a server. If scaled out, the results are broken out by replica because the replica number is included in ServerName_s.
let window = AzureDiagnostics
   | where ResourceProvider == "MICROSOFT.ANALYSISSERVICES" and Resource =~ "MyServerName";
window
| where OperationName == "LogMetric"
| where name_s == "memory_metric" or name_s == "qpu_metric"
| project ServerName_s, TimeGenerated, name_s, value_s
| summarize avg(todecimal(value_s)) by ServerName_s, name_s, bin(TimeGenerated, 1m)
| order by TimeGenerated asc
Example 3
The following query returns the Rows read/sec Analysis Services engine performance counters for a server.
let window =  AzureDiagnostics
   | where ResourceProvider == "MICROSOFT.ANALYSISSERVICES" and Resource =~ "MyServerName";
window
| where OperationName == "LogMetric"
| where parse_json(tostring(parse_json(perfobject_s).counters))[0].name == "Rows read/sec"
| extend Value = tostring(parse_json(tostring(parse_json(perfobject_s).counters))[0].value)
| project ServerName_s, TimeGenerated, Value
| summarize avg(todecimal(Value)) by ServerName_s, bin(TimeGenerated, 1m)
| order by TimeGenerated asc
Alerts
Azure Monitor alerts proactively notify you when specific conditions are found in your monitoring data. Alerts allow you to identify and address issues in your system before your customers notice them. For more information, see Azure Monitor alerts.
There are many sources of common alerts for Azure resources. For examples of common alerts for Azure resources, see Sample log alert queries. The Azure Monitor Baseline Alerts (AMBA) site provides a semi-automated method of implementing important platform metric alerts, dashboards, and guidelines. The site applies to a continually expanding subset of Azure services, including all services that are part of the Azure Landing Zone (ALZ).
The common alert schema standardizes the consumption of Azure Monitor alert notifications. For more information, see Common alert schema.
Types of alerts
You can alert on any metric or log data source in the Azure Monitor data platform. There are many different types of alerts depending on the services you're monitoring and the monitoring data you're collecting. Different types of alerts have various benefits and drawbacks. For more information, see Choose the right monitoring alert type.
The following list describes the types of Azure Monitor alerts you can create:
- Metric alerts evaluate resource metrics at regular intervals. Metrics can be platform metrics, custom metrics, logs from Azure Monitor converted to metrics, or Application Insights metrics. Metric alerts can also apply multiple conditions and dynamic thresholds.
- Log alerts allow users to use a Log Analytics query to evaluate resource logs at a predefined frequency.
- Activity log alerts trigger when a new activity log event occurs that matches defined conditions. Resource Health alerts and Service Health alerts are activity log alerts that report on your service and resource health.
Some Azure services also support smart detection alerts, Prometheus alerts, or recommended alert rules.
For some services, you can monitor at scale by applying the same metric alert rule to multiple resources of the same type that exist in the same Azure region. Individual notifications are sent for each monitored resource. For supported Azure services and clouds, see Monitor multiple resources with one alert rule.
Analysis Services alert rules
The following table lists some common and popular alert rules for Analysis Services.
| Alert type | Condition | Description |
|---|---|---|
| Metric | Whenever the maximum qpu_metric is greater than dynamic threshold. | If your QPU regularly maxes out, it means the number of queries against your models is exceeding the QPU limit for your plan. |
| Metric | Whenever the maximum QueryPoolJobQueueLength is greater than dynamic threshold. | The number of queries in the query thread pool queue exceeds available QPU. |
Advisor recommendations
For some services, if critical conditions or imminent changes occur during resource operations, an alert displays on the service Overview page in the portal. You can find more information and recommended fixes for the alert in Advisor recommendations under Monitoring in the left menu. During normal operations, no advisor recommendations display.
For more information on Azure Advisor, see Azure Advisor overview.
Related content
- See Analysis Services monitoring data reference for a reference of the metrics, logs, and other important values created for Analysis Services.
- See Monitoring Azure resources with Azure Monitor for general details on monitoring Azure resources.
Feedback
Coming soon: Throughout 2024 we will be phasing out GitHub Issues as the feedback mechanism for content and replacing it with a new feedback system. For more information see: https://aka.ms/ContentUserFeedback.
Submit and view feedback for