Busy Front End antipattern
Performing asynchronous work on a large number of background threads can starve other concurrent foreground tasks of resources, decreasing response times to unacceptable levels.
Problem description
Resource-intensive tasks can increase the response times for user requests and cause high latency. One way to improve response times is to offload a resource-intensive task to a separate thread. This approach lets the application stay responsive while processing happens in the background. However, tasks that run on a background thread still consume resources. If there are too many of them, they can starve the threads that are handling requests.
Note
The term resource can encompass many things, such as CPU utilization, memory occupancy, and network or disk I/O.
This problem typically occurs when an application is developed as monolithic piece of code, with all of the business logic combined into a single tier shared with the presentation layer.
Here's an example using ASP.NET that demonstrates the problem. You can find the complete sample here.
public class WorkInFrontEndController : ApiController
{
    [HttpPost]
    [Route("api/workinfrontend")]
    public HttpResponseMessage Post()
    {
        new Thread(() =>
        {
            //Simulate processing
            Thread.SpinWait(Int32.MaxValue / 100);
        }).Start();

        return Request.CreateResponse(HttpStatusCode.Accepted);
    }
}

public class UserProfileController : ApiController
{
    [HttpGet]
    [Route("api/userprofile/{id}")]
    public UserProfile Get(int id)
    {
        //Simulate processing
        return new UserProfile() { FirstName = "Alton", LastName = "Hudgens" };
    }
}
The
Postmethod in theWorkInFrontEndcontroller implements an HTTP POST operation. This operation simulates a long-running, CPU-intensive task. The work is performed on a separate thread, in an attempt to enable the POST operation to complete quickly.The
Getmethod in theUserProfilecontroller implements an HTTP GET operation. This method is much less CPU intensive.
The primary concern is the resource requirements of the Post method. Although it puts the work onto a background thread, the work can still consume considerable CPU resources. These resources are shared with other operations being performed by other concurrent users. If a moderate number of users send this request at the same time, overall performance is likely to suffer, slowing down all operations. Users might experience significant latency in the Get method, for example.
How to fix the problem
Move processes that consume significant resources to a separate back end.
With this approach, the front end puts resource-intensive tasks onto a message queue. The back end picks up the tasks for asynchronous processing. The queue also acts as a load leveler, buffering requests for the back end. If the queue length becomes too long, you can configure autoscaling to scale out the back end.
Here is a revised version of the previous code. In this version, the Post method puts a message on a Service Bus queue.
public class WorkInBackgroundController : ApiController
{
    private static readonly QueueClient QueueClient;
    private static readonly string QueueName;
    private static readonly ServiceBusQueueHandler ServiceBusQueueHandler;

    public WorkInBackgroundController()
    {
        var serviceBusConnectionString = ...;
        QueueName = ...;
        ServiceBusQueueHandler = new ServiceBusQueueHandler(serviceBusConnectionString);
        QueueClient = ServiceBusQueueHandler.GetQueueClientAsync(QueueName).Result;
    }

    [HttpPost]
    [Route("api/workinbackground")]
    public async Task<long> Post()
    {
        return await ServiceBusQueueHandler.AddWorkLoadToQueueAsync(QueueClient, QueueName, 0);
    }
}
The back end pulls messages from the Service Bus queue and does the processing.
public async Task RunAsync(CancellationToken cancellationToken)
{
    this._queueClient.OnMessageAsync(
        // This lambda is invoked for each message received.
        async (receivedMessage) =>
        {
            try
            {
                // Simulate processing of message
                Thread.SpinWait(Int32.MaxValue / 1000);

                await receivedMessage.CompleteAsync();
            }
            catch
            {
                receivedMessage.Abandon();
            }
        });
}
Considerations
- This approach adds some additional complexity to the application. You must handle queuing and dequeuing safely to avoid losing requests in the event of a failure.
- The application takes a dependency on an additional service for the message queue.
- The processing environment must be sufficiently scalable to handle the expected workload and meet the required throughput targets.
- While this approach should improve overall responsiveness, the tasks that are moved to the back end may take longer to complete.
How to detect the problem
Symptoms of a busy front end include high latency when resource-intensive tasks are being performed. End users are likely to report extended response times or failures caused by services timing out. These failures could also return HTTP 500 (Internal Server) errors or HTTP 503 (Service Unavailable) errors. Examine the event logs for the web server, which are likely to contain more detailed information about the causes and circumstances of the errors.
You can perform the following steps to help identify this problem:
- Perform process monitoring of the production system, to identify points when response times slow down.
- Examine the telemetry data captured at these points to determine the mix of operations being performed and the resources being used.
- Find any correlations between poor response times and the volumes and combinations of operations that were happening at those times.
- Load test each suspected operation to identify which operations are consuming resources and starving other operations.
- Review the source code for those operations to determine why they might cause excessive resource consumption.
Example diagnosis
The following sections apply these steps to the sample application described earlier.
Identify points of slowdown
Instrument each method to track the duration and resources consumed by each request. Then monitor the application in production. This can provide an overall view of how requests compete with each other. During periods of stress, slow-running resource-hungry requests will likely affect other operations, and this behavior can be observed by monitoring the system and noting the drop off in performance.
The following image shows a monitoring dashboard. (We used AppDynamics for our tests.) Initially, the system has light load. Then users start requesting the UserProfile GET method. The performance is reasonably good until other users start issuing requests to the WorkInFrontEnd POST method. At that point, response times increase dramatically (first arrow). Response times only improve after the volume of requests to the WorkInFrontEnd controller diminishes (second arrow).

Examine telemetry data and find correlations
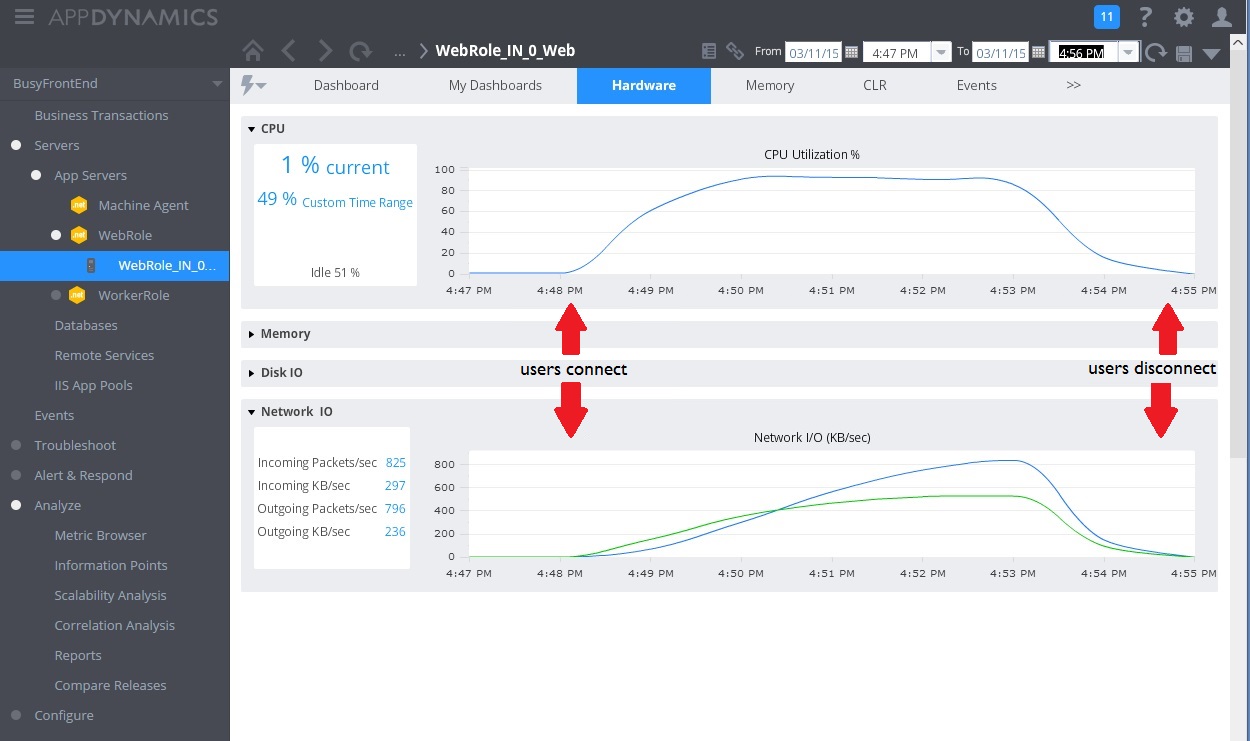
The next image shows some of the metrics gathered to monitor resource utilization during the same interval. At first, few users are accessing the system. As more users connect, CPU utilization becomes very high (100%). Also notice that the network I/O rate initially goes up as CPU usage rises. But once CPU usage peaks, network I/O actually goes down. That's because the system can only handle a relatively small number of requests once the CPU is at capacity. As users disconnect, the CPU load tails off.

At this point, it appears the Post method in the WorkInFrontEnd controller is a prime candidate for closer examination. Further work in a controlled environment is needed to confirm the hypothesis.
Perform load testing
The next step is to perform tests in a controlled environment. For example, run a series of load tests that include and then omit each request in turn to see the effects.
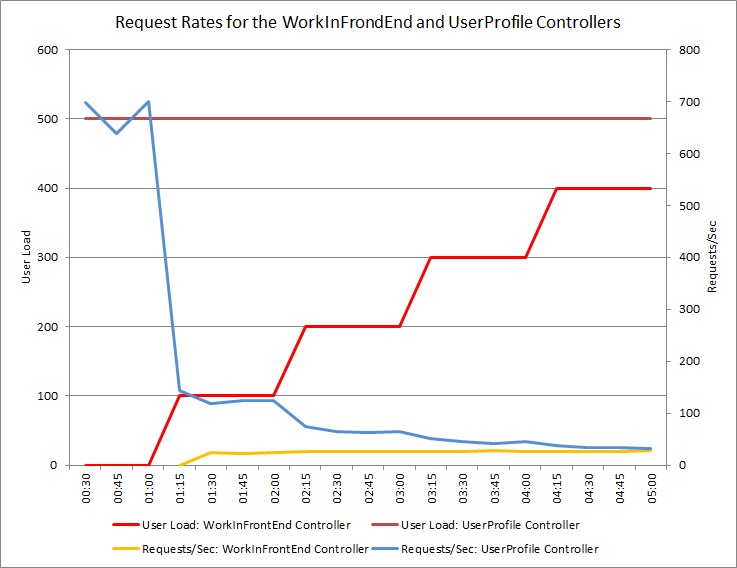
The graph below shows the results of a load test performed against an identical deployment of the cloud service used in the previous tests. The test used a constant load of 500 users performing the Get operation in the UserProfile controller, along with a step load of users performing the Post operation in the WorkInFrontEnd controller.

Initially, the step load is 0, so the only active users are performing the UserProfile requests. The system is able to respond to approximately 500 requests per second. After 60 seconds, a load of 100 additional users starts sending POST requests to the WorkInFrontEnd controller. Almost immediately, the workload sent to the UserProfile controller drops to about 150 requests per second. This is due to the way the load-test runner functions. It waits for a response before sending the next request, so the longer it takes to receive a response, the lower the request rate.
As more users send POST requests to the WorkInFrontEnd controller, the response rate of the UserProfile controller continues to drop. But note that the volume of requests handled by the WorkInFrontEnd controller remains relatively constant. The saturation of the system becomes apparent as the overall rate of both requests tends toward a steady but low limit.
Review the source code
The final step is to look at the source code. The development team was aware that the Post method could take a considerable amount of time, which is why the original implementation used a separate thread. That solved the immediate problem, because the Post method did not block waiting for a long-running task to complete.
However, the work performed by this method still consumes CPU, memory, and other resources. Enabling this process to run asynchronously might actually damage performance, as users can trigger a large number of these operations simultaneously, in an uncontrolled manner. There is a limit to the number of threads that a server can run. Past this limit, the application is likely to get an exception when it tries to start a new thread.
Note
This doesn't mean you should avoid asynchronous operations. Performing an asynchronous await on a network call is a recommended practice. (See the Synchronous I/O antipattern.) The problem here is that CPU-intensive work was spawned on another thread.
Implement the solution and verify the result
The following image shows performance monitoring after the solution was implemented. The load was similar to that shown earlier, but the response times for the UserProfile controller are now much faster. The volume of requests increased over the same duration, from 2,759 to 23,565.

Note that the WorkInBackground controller also handled a much larger volume of requests. However, you can't make a direct comparison in this case, because the work being performed in this controller is very different from the original code. The new version simply queues a request, rather than performing a time consuming calculation. The main point is that this method no longer drags down the entire system under load.
CPU and network utilization also show the improved performance. The CPU utilization never reached 100%, and the volume of handled network requests was far greater than earlier, and did not tail off until the workload dropped.

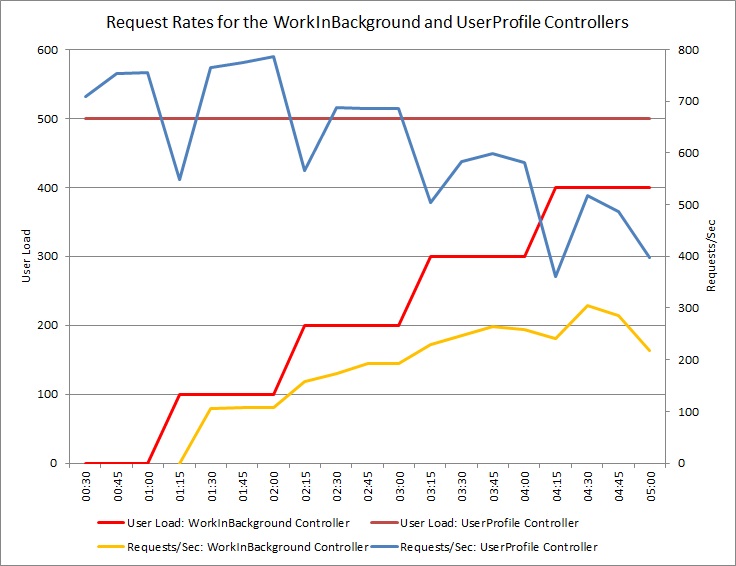
The following graph shows the results of a load test. The overall volume of requests serviced is greatly improved compared to the earlier tests.

Related guidance
Feedback
Coming soon: Throughout 2024 we will be phasing out GitHub Issues as the feedback mechanism for content and replacing it with a new feedback system. For more information see: https://aka.ms/ContentUserFeedback.
Submit and view feedback for