Monolithic Persistence antipattern
Putting all of an application's data into a single data store can hurt performance, either because it leads to resource contention, or because the data store is not a good fit for some of the data.
Problem description
Historically, applications have often used a single data store, regardless of the different types of data that the application might need to store. Usually this was done to simplify the application design, or else to match the existing skill set of the development team.
Modern cloud-based systems often have additional functional and nonfunctional requirements, and need to store many heterogeneous types of data, such as documents, images, cached data, queued messages, application logs, and telemetry. Following the traditional approach and putting all of this information into the same data store can hurt performance, for two main reasons:
- Storing and retrieving large amounts of unrelated data in the same data store can cause contention, which in turn leads to slow response times and connection failures.
- Whichever data store is chosen, it might not be the best fit for all of the different types of data, or it might not be optimized for the operations that the application performs.
The following example shows an ASP.NET Web API controller that adds a new record to a database and also records the result to a log. The log is held in the same database as the business data. You can find the complete sample here.
public class MonoController : ApiController
{
    private static readonly string ProductionDb = ...;

    public async Task<IHttpActionResult> PostAsync([FromBody]string value)
    {
        await DataAccess.InsertPurchaseOrderHeaderAsync(ProductionDb);
        await DataAccess.LogAsync(ProductionDb, LogTableName);
        return Ok();
    }
}
The rate at which log records are generated will probably affect the performance of the business operations. And if another component, such as an application process monitor, regularly reads and processes the log data, that can also affect the business operations.
How to fix the problem
Separate data according to its use. For each data set, select a data store that best matches how that data set will be used. In the previous example, the application should be logging to a separate store from the database that holds business data:
public class PolyController : ApiController
{
    private static readonly string ProductionDb = ...;
    private static readonly string LogDb = ...;

    public async Task<IHttpActionResult> PostAsync([FromBody]string value)
    {
        await DataAccess.InsertPurchaseOrderHeaderAsync(ProductionDb);
        // Log to a different data store.
        await DataAccess.LogAsync(LogDb, LogTableName);
        return Ok();
    }
}
Considerations
Separate data by the way it is used and how it is accessed. For example, don't store log information and business data in the same data store. These types of data have significantly different requirements and patterns of access. Log records are inherently sequential, while business data is more likely to require random access, and is often relational.
Consider the data access pattern for each type of data. For example, store formatted reports and documents in a document database such as Azure Cosmos DB, but use Azure Cache for Redis to cache temporary data.
If you follow this guidance but still reach the limits of the database, you may need to scale up the database. Also consider scaling horizontally and partitioning the load across database servers. However, partitioning may require redesigning the application. For more information, see Data partitioning.
How to detect the problem
The system will likely slow down dramatically and eventually fail, as the system runs out of resources such as database connections.
You can perform the following steps to help identify the cause.
- Instrument the system to record the key performance statistics. Capture timing information for each operation, as well as the points where the application reads and writes data.
- If possible, monitor the system running for a few days in a production environment to get a real-world view of how the system is used. If this is not possible, run scripted load tests with a realistic volume of virtual users performing a typical series of operations.
- Use the telemetry data to identify periods of poor performance.
- Identify which data stores were accessed during those periods.
- Identify data storage resources that might be experiencing contention.
Example diagnosis
The following sections apply these steps to the sample application described earlier.
Instrument and monitor the system
The following graph shows the results of load testing the sample application described earlier. The test used a step load of up to 1000 concurrent users.
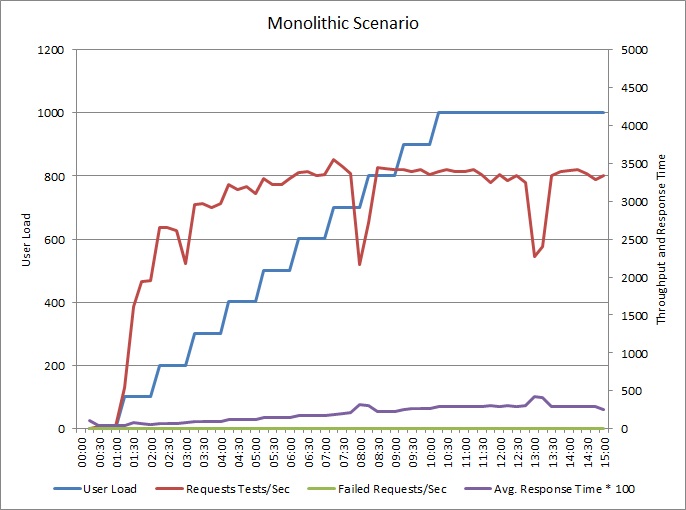
As the load increases to 700 users, so does the throughput. But at that point, throughput levels off, and the system appears to be running at its maximum capacity. The average response gradually increases with user load, showing that the system can't keep up with demand.
Identify periods of poor performance
If you are monitoring the production system, you might notice patterns. For example, response times might drop off significantly at the same time each day. This could be caused by a regular workload or scheduled batch job, or just because the system has more users at certain times. You should focus on the telemetry data for these events.
Look for correlations between increased response times and increased database activity or I/O to shared resources. If there are correlations, it means the database might be a bottleneck.
Identify which data stores are accessed during those periods
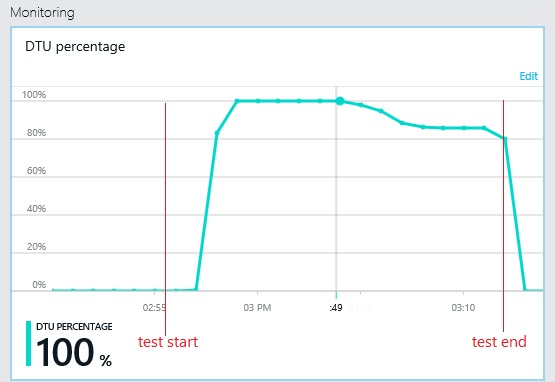
The next graph shows the utilization of database throughput units (DTU) during the load test. (A DTU is a measure of available capacity, and is a combination of CPU utilization, memory allocation, I/O rate.) Utilization of DTUs quickly reached 100%. This is roughly the point where throughput peaked in the previous graph. Database utilization remained very high until the test finished. There is a slight drop toward the end, which could be caused by throttling, competition for database connections, or other factors.
Examine the telemetry for the data stores
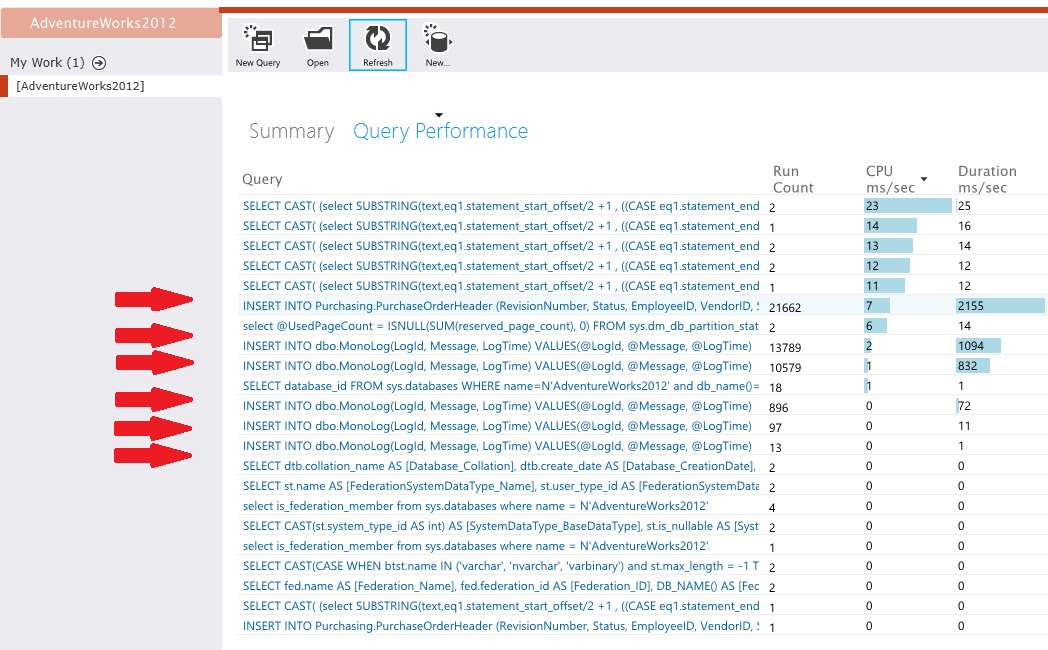
Instrument the data stores to capture the low-level details of the activity. In the sample application, the data access statistics showed a high volume of insert operations performed against both the PurchaseOrderHeader table and the MonoLog table.
Identify resource contention
At this point, you can review the source code, focusing on the points where contended resources are accessed by the application. Look for situations such as:
- Data that is logically separate being written to the same store. Data such as logs, reports, and queued messages should not be held in the same database as business information.
- A mismatch between the choice of data store and the type of data, such as large blobs or XML documents in a relational database.
- Data with significantly different usage patterns that share the same store, such as high-write/low-read data being stored with low-write/high-read data.
Implement the solution and verify the result
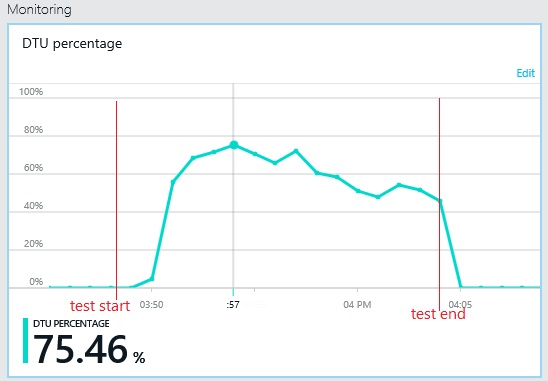
The application was changed to write logs to a separate data store. Here are the load test results:
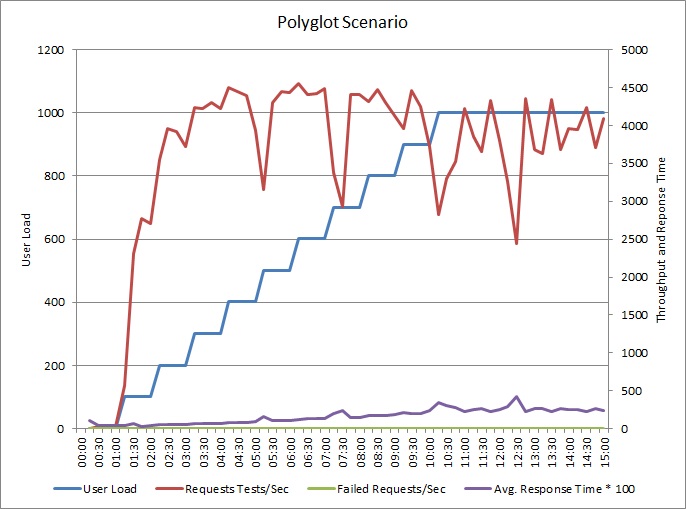
The pattern of throughput is similar to the earlier graph, but the point at which performance peaks is approximately 500 requests per second higher. The average response time is marginally lower. However, these statistics don't tell the full story. Telemetry for the business database shows that DTU utilization peaks at around 75%, rather than 100%.
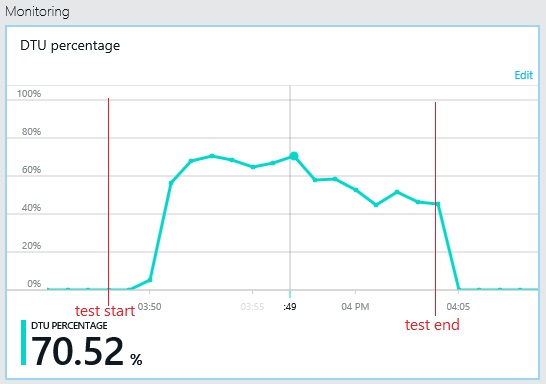
Similarly, the maximum DTU utilization of the log database only reaches about 70%. The databases are no longer the limiting factor in the performance of the system.
Related resources
Feedback
Coming soon: Throughout 2024 we will be phasing out GitHub Issues as the feedback mechanism for content and replacing it with a new feedback system. For more information see: https://aka.ms/ContentUserFeedback.
Submit and view feedback for