Azure Monitor insights for Azure Cache for Redis
Azure Monitor insights for Azure Cache for Redis provide a unified, interactive view of cache performance, failures, capacity, and operational health. This article shows you how to view Azure Cache for Redis insights across all of your subscriptions, and how to modify and adapt insights to fit the unique needs of your organization.
For more information about Azure Monitor for Azure Cache for Redis, see Monitor Azure Cache for Redis. For a full list of the metric definitions that form these insights, see Supported metrics for Microsoft.Cache/redis.
View insights from Azure Monitor
You can access Azure Cache for Redis insights from the Insights Hub of Azure Monitor.
To view the utilization and performance of your Azure Cache for Redis instances across all of your subscriptions, do the following steps:
Sign in to the Azure portal.
Search for Monitor, and select Monitor.
Select Azure Cache for Redis. If this option isn't present, select More > Azure Cache for Redis.
Workbooks
Azure Cache for Redis insights are based on the workbooks feature of Azure Monitor that provides rich visualizations for metrics and other data. Azure Cache for Redis insights provides two workbooks by default:
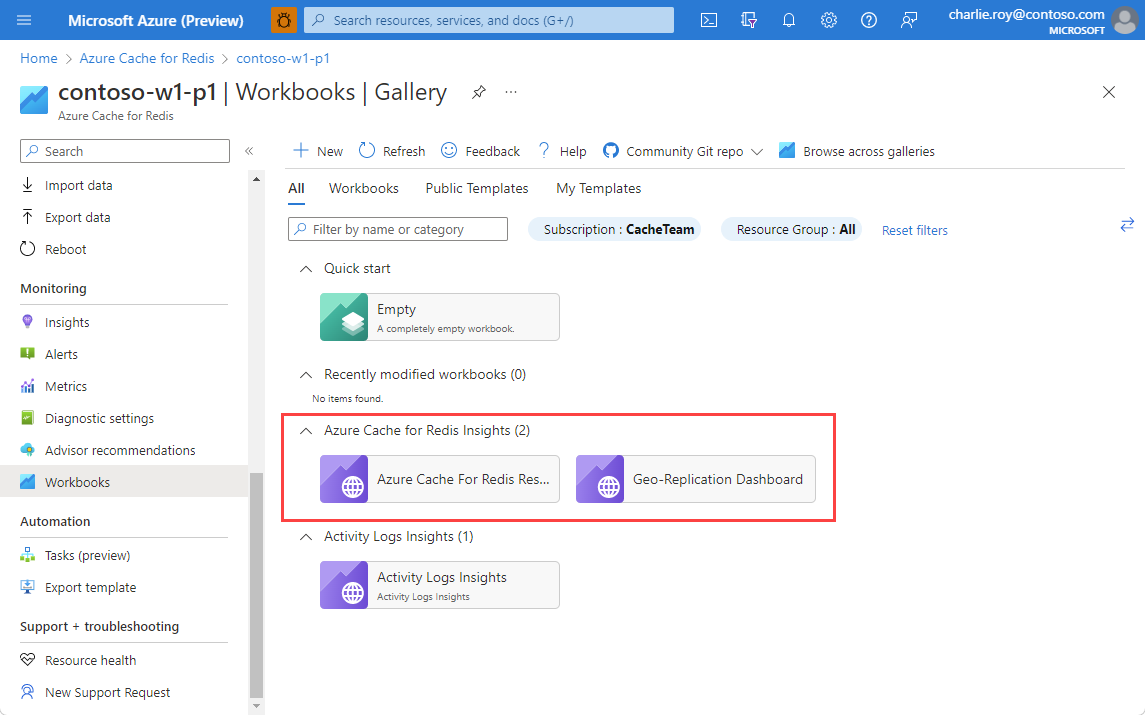
Azure Cache For Redis Resource Overview combines many of the most commonly used metrics so that the health and performance of the cache instance can be viewed at a glance.
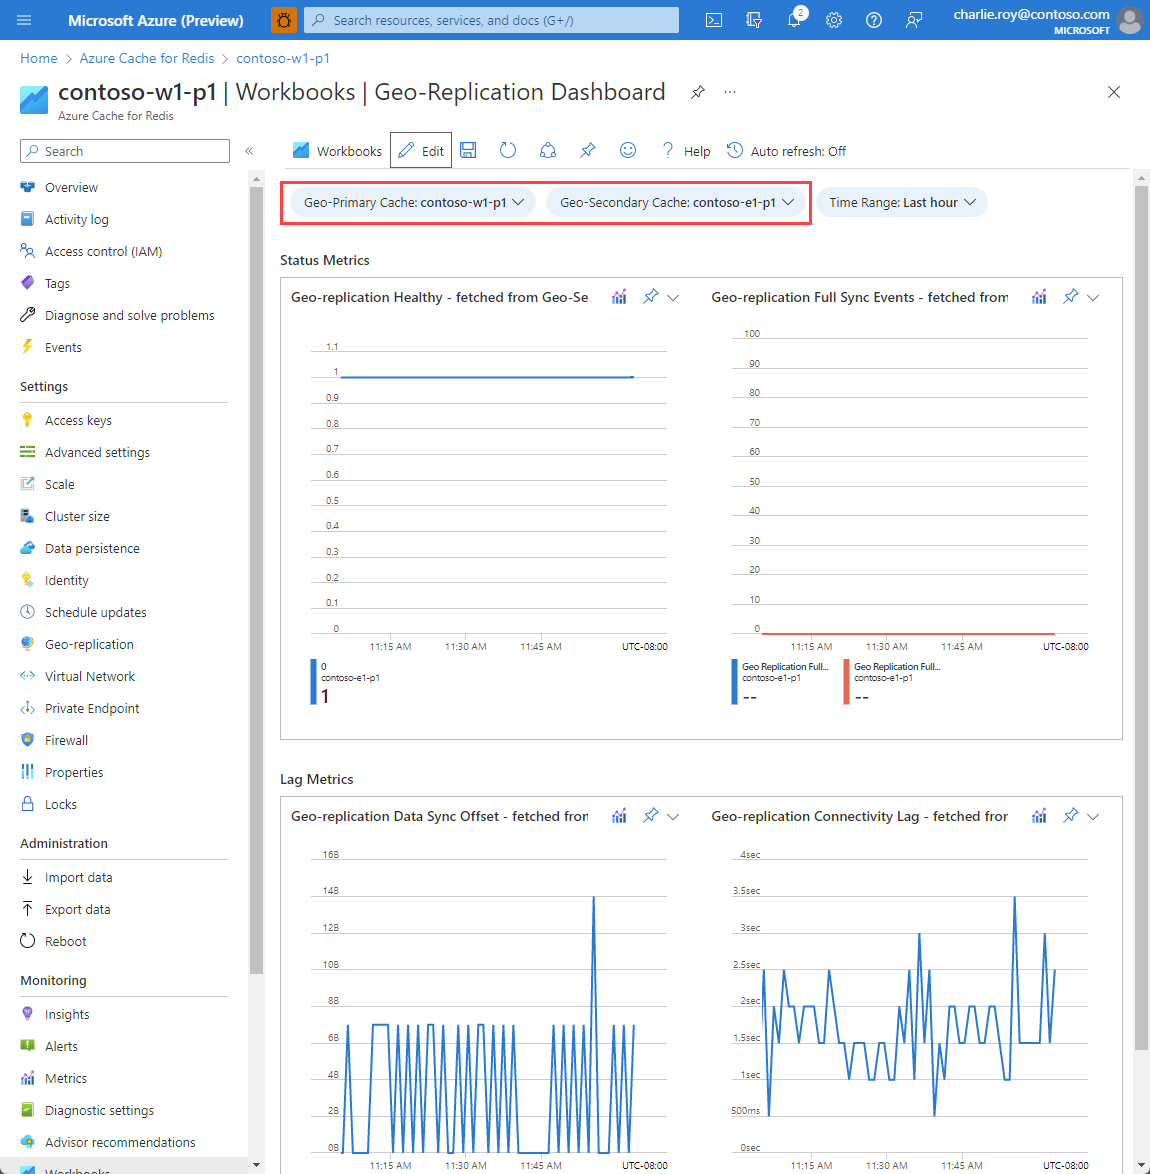
Geo-Replication Dashboard pulls geo-replication health and status metrics from both the geo-primary and geo-secondary cache instances to give a complete picture of geo-replcation health. Using this dashboard is recommended, as some geo-replication metrics are only emitted from either the geo-primary or geo-secondary.
Overview
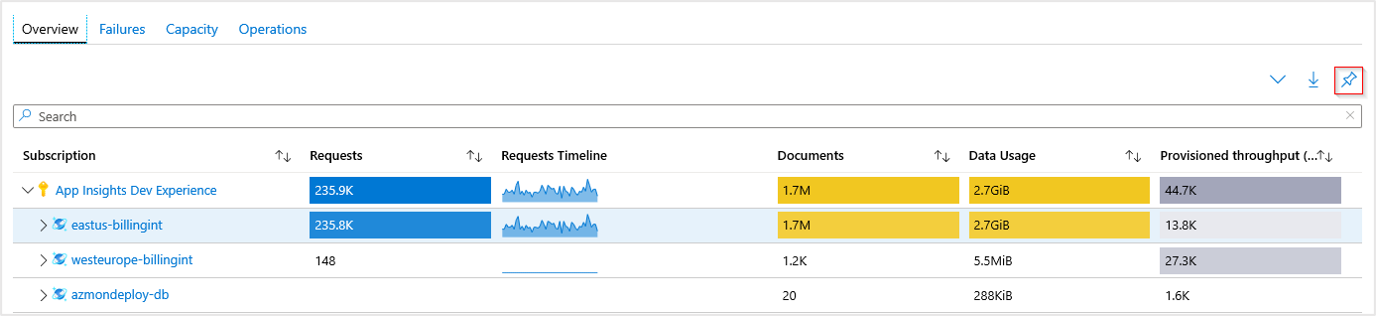
On Overview, the table displays interactive Azure Cache for Redis metrics. You can filter the results based on the options you select from the following drop-down lists:
Subscriptions: Only subscriptions that have an Azure Cache for Redis resource are listed.
Azure Cache for Redis: You can select all, a subset, or a single Azure Cache for Redis resource.
Time Range: By default, the table displays the last four hours of information based on the corresponding selections.
There's a counter tile under the drop-down lists. The tile shows the total number of Azure Cache for Redis resources in the selected subscriptions. Conditional color codes or heat maps for workbook columns report transaction metrics. The deepest color represents the highest value. Lighter colors represent lower values.
Selecting a drop-down list arrow next to one of the Azure Cache for Redis resources reveals a breakdown of the performance metrics at the individual resource level.
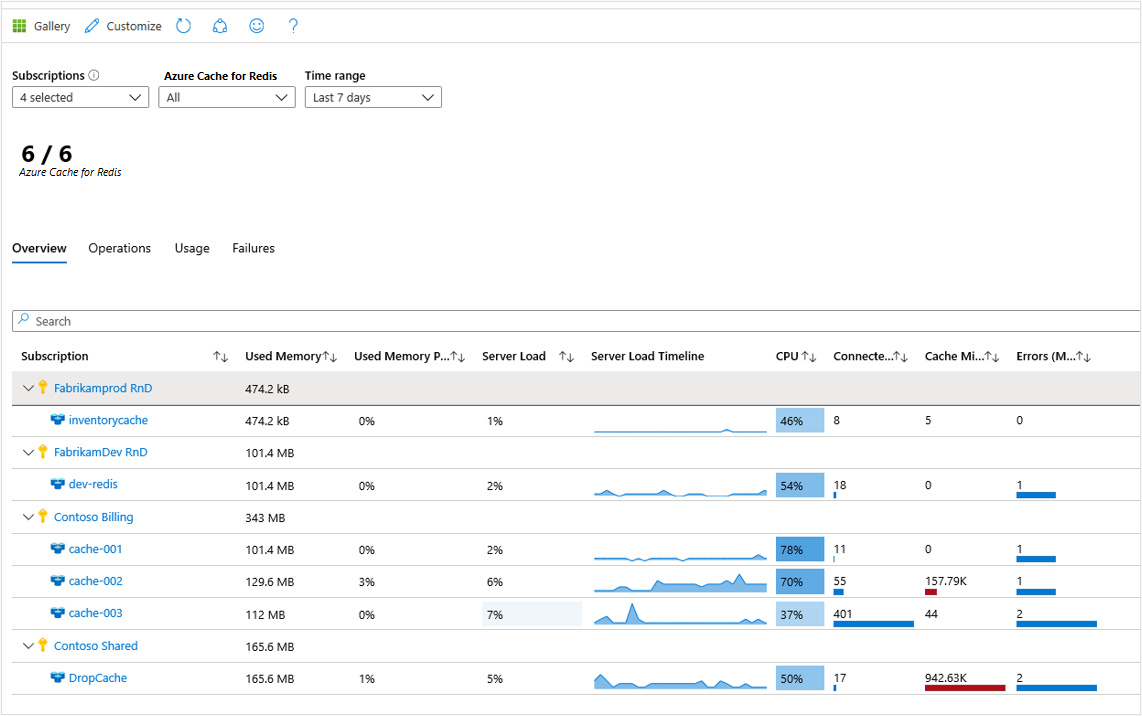
When you select the Azure Cache for Redis resource name highlighted in blue, you see the default Overview table for the associated account. It shows these columns:
- Used Memory
- Used Memory Percentage
- Server Load
- Server Load Timeline
- CPU
- Connected Clients
- Cache Misses
- Errors (Max)
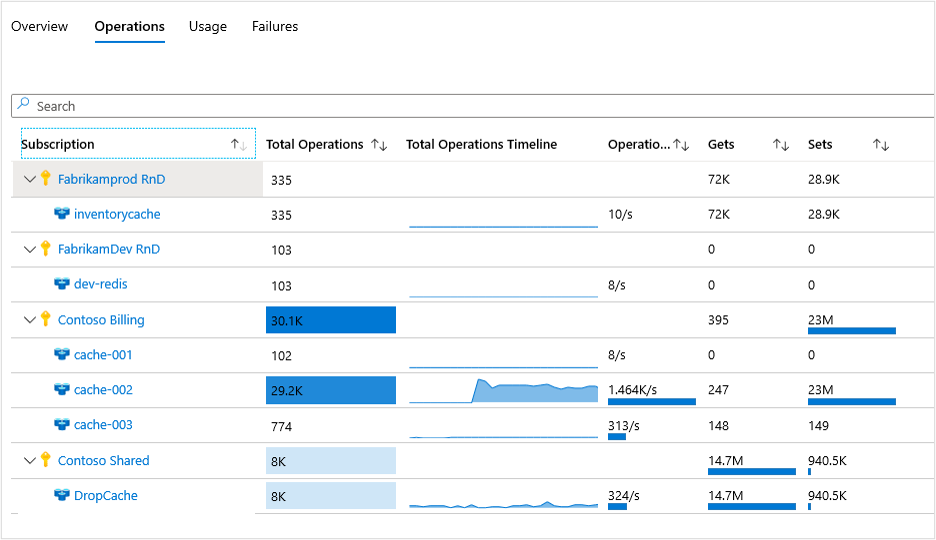
Operations
When you select Operations at the top of the page, the Operations table of the workbook template opens. It shows these columns:
- Total Operations
- Total Operations Timeline
- Operations Per Second
- Gets
- Sets
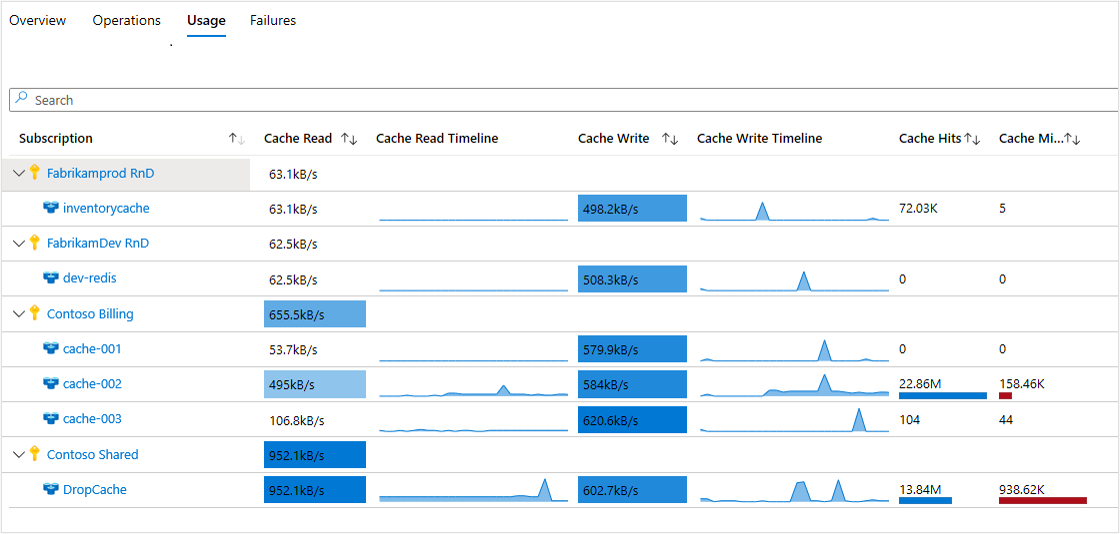
Usage
When you select Usage at the top of the page, the Usage table of the workbook template opens. It shows these columns:
- Cache Read
- Cache Read Timeline
- Cache Write
- Cache Hits
- Cache Misses
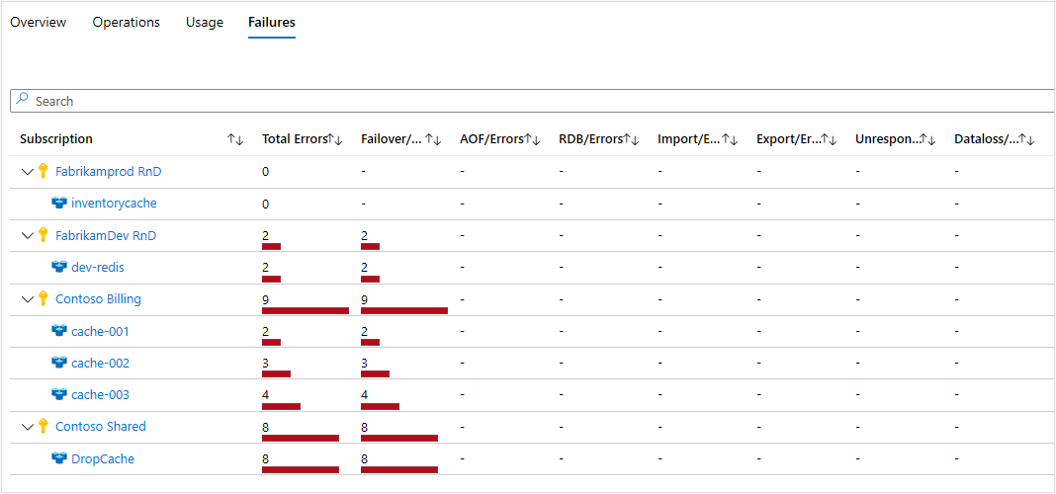
Failures
When you select Failures at the top of the page, the Failures table of the workbook template opens. It shows these columns:
- Total Errors
- Failover/Errors
- UnresponsiveClient/Errors
- RDB/Errors
- AOF/Errors
- Export/Errors
- Dataloss/Errors
- Import/Errors
View insights from an Azure Cache for Redis resource
To access Azure Monitor for Azure Cache for Redis directly from an individual resource:
In the Azure portal, select Azure Cache for Redis.
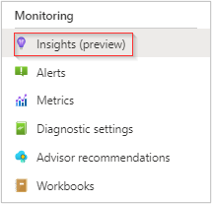
From the list, choose an individual Azure Cache for Redis resource. In the monitoring section, choose Insights.
These views are also accessible by selecting the resource name of an Azure Cache for Redis resource from the Azure Monitor level workbook.
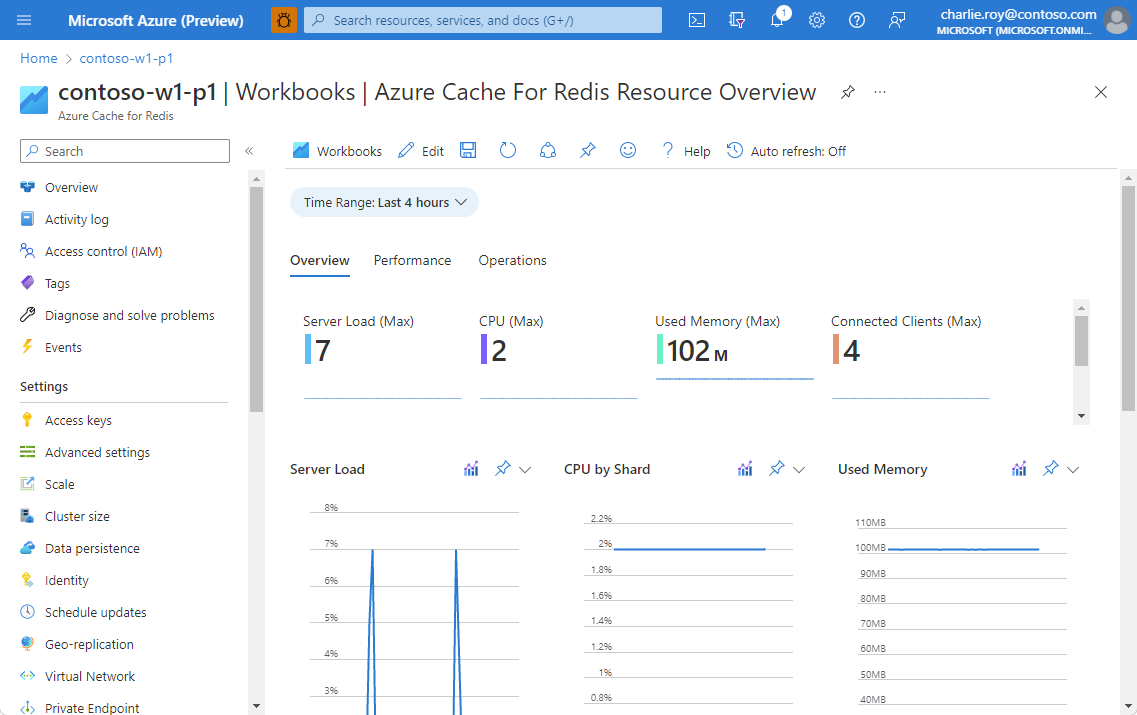
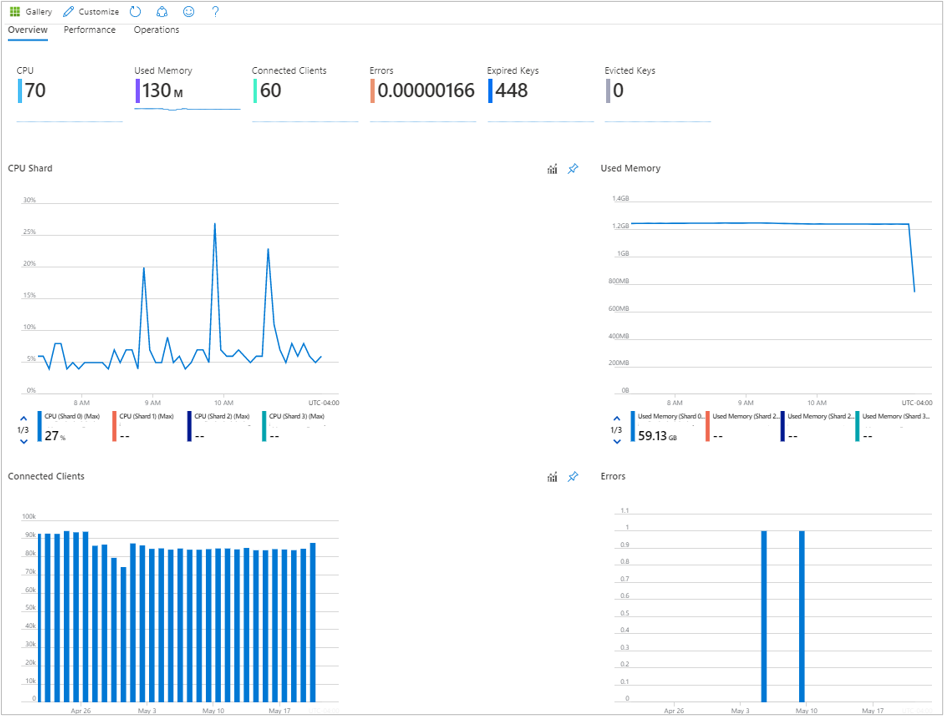
Resource-level overview
On the Overview workbook for the Azure Redis Cache, it shows several performance metrics that give you access to:
Interactive performance charts showing the most essential details related to Azure Cache for Redis performance.
Metrics and status tiles highlighting shard performance, total number of connected clients, and overall latency.
Selecting any of the other tabs for Performance or Operations opens that workbooks.
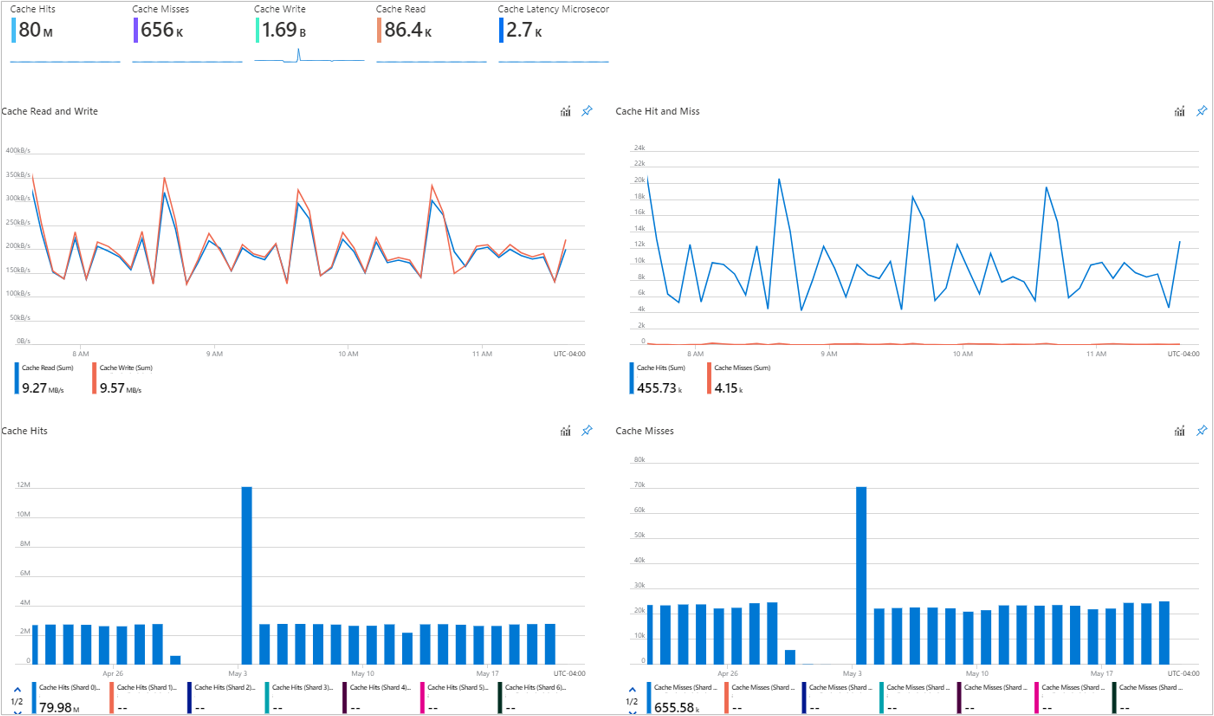
Resource-level performance
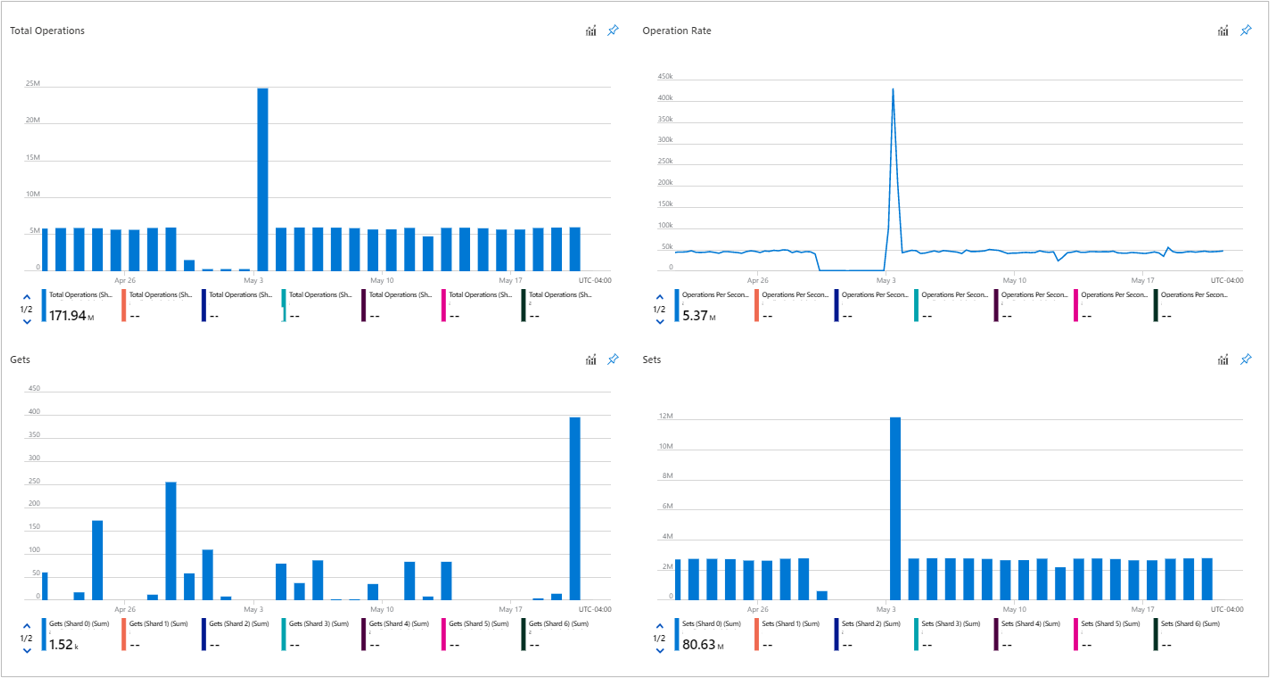
Resource-level operations
Pin, export, and expand
To pin any metric section to an Azure dashboard, select the pushpin symbol in the section's upper right.
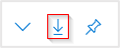
To export your data into an Excel format, select the down arrow symbol to the left of the pushpin symbol.
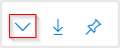
To expand or collapse all views in a workbook, select the expand symbol to the left of the export symbol.
Customize Azure Monitor insights for Azure Cache for Redis
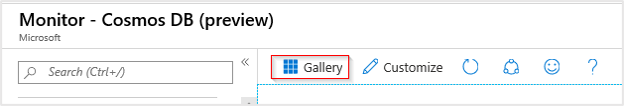
Because this experience is built atop Azure Monitor workbook templates, you can select Customize > Edit > Save to save a copy of your modified version into a custom workbook.

Workbooks are saved within a resource group in either the My Reports section or the Shared Reports section. My Reports is available only to you. Shared Reports is available to everyone with access to the resource group.
After you save a custom workbook, go to the workbook gallery to open it.
Related content
Feedback
Coming soon: Throughout 2024 we will be phasing out GitHub Issues as the feedback mechanism for content and replacing it with a new feedback system. For more information see: https://aka.ms/ContentUserFeedback.
Submit and view feedback for