Azure Functions app diagnostics
Azure Functions App Diagnostics is a useful resource in the Azure portal for monitoring and diagnosing potential issues in your Durable Functions application. Not only does it help diagnose problems, but it also provides potential solutions and/or relevant documentation to help you resolve issues faster.
How to use Azure Functions app diagnostics
Go to your Function App resource. In the left menu, select Diagnose and solve problems.
Search for “Durable Functions” and select on the result.

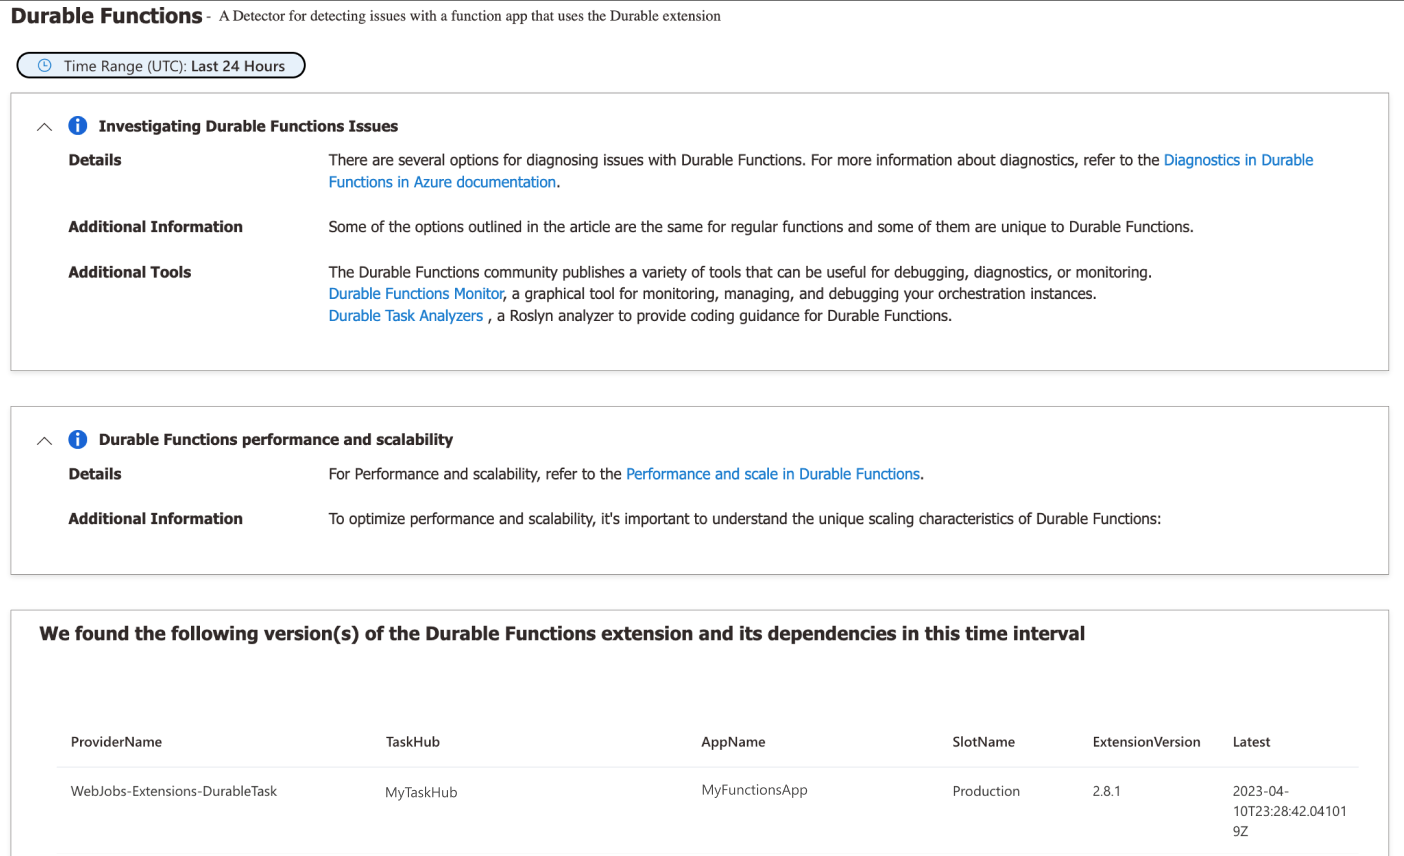
You're now inside the Durable Functions detector, which checks for common problems Durable Functions apps tend to have. The detector also gives you links to tools and documentation you might find helpful. Go through the various insights in the detector to learn about the application’s health. Some examples of what the detector tells you include the Durable Functions extension version your app is using, performance issues, and any errors or warnings. If there are issues, you'll see suggestions on how to mitigate and resolve them.
Other useful detectors
On the left side of the window, there's a list of detectors designed to check for different problems. This section highlights a few.
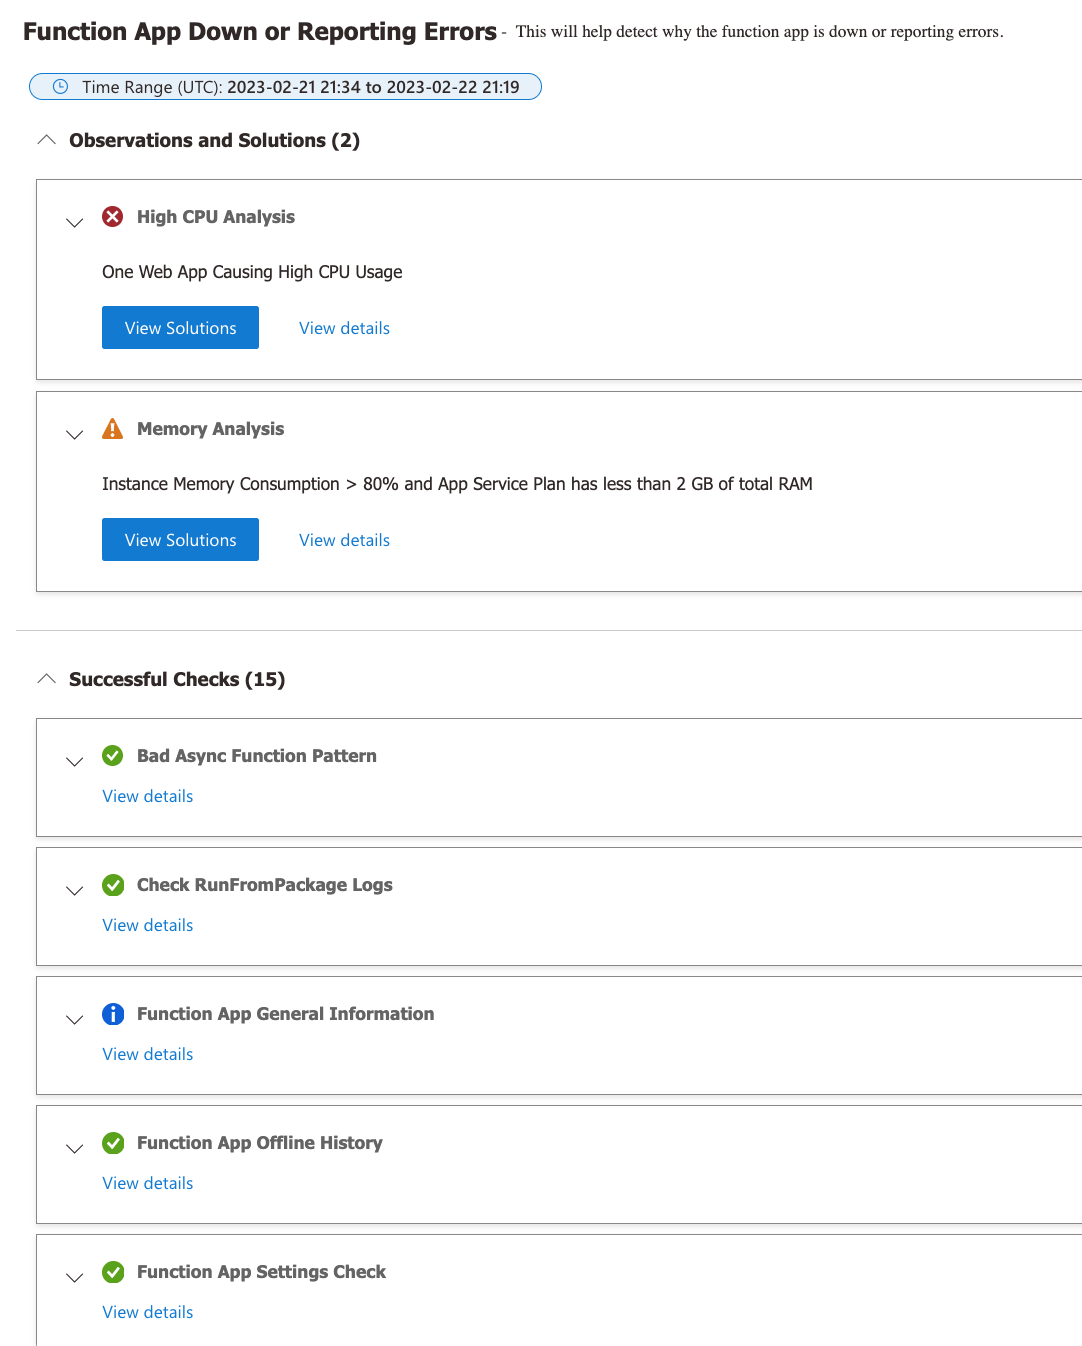
The Functions App Down or Report Errors detector pulls results from different detectors checking key areas of your application that may be the cause of your application being down or reporting errors. The screenshot below shows the checks performed (not all 15 are captured in the screenshot) and the two issues requiring attention.
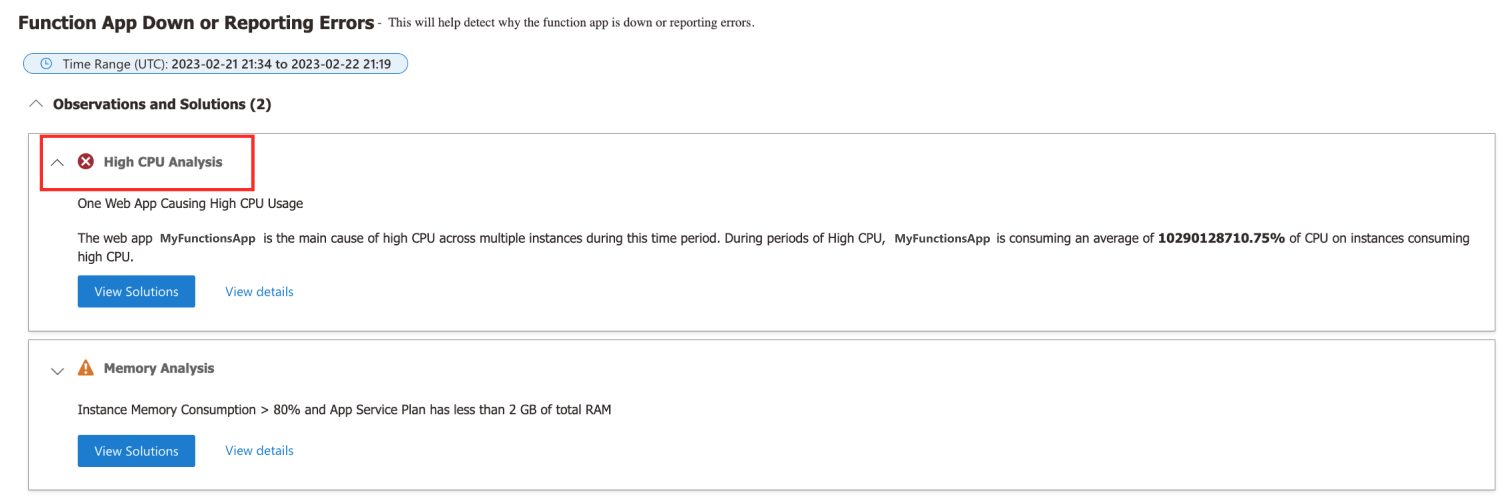
Maximizing High CPU Analysis shows that one app is causing high CPU usage.
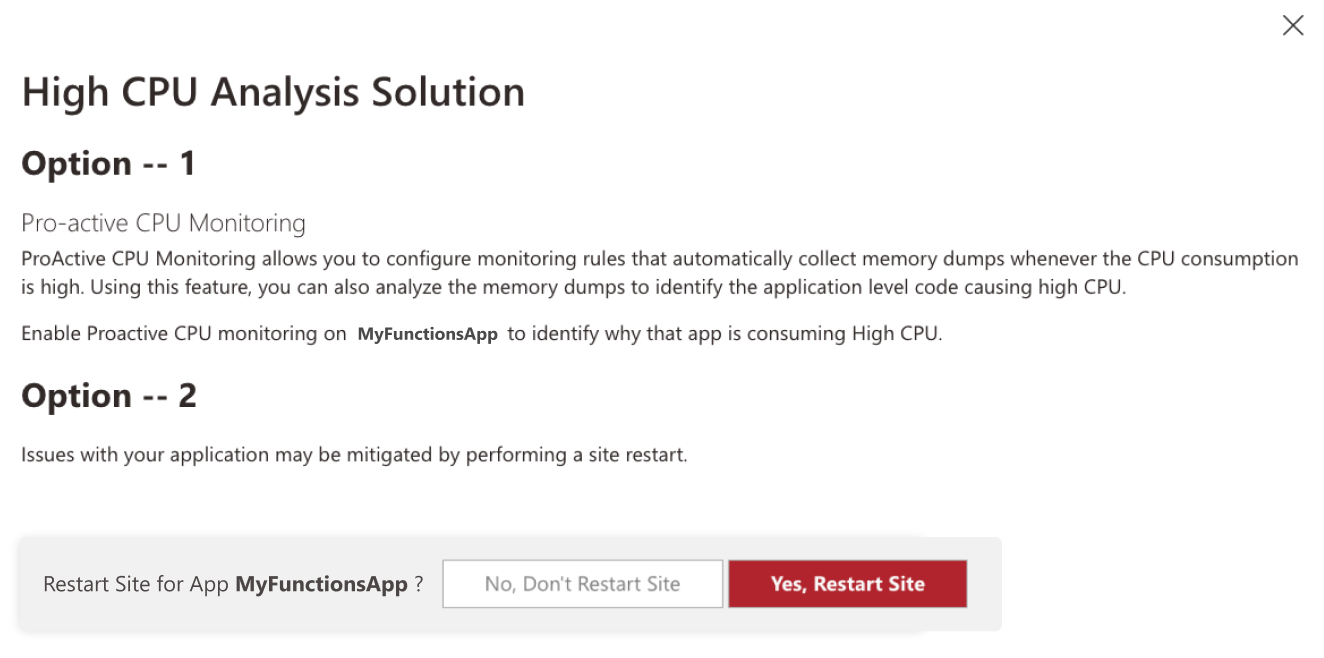
The following is suggested when clicking "View Solutions". If you decide to follow the second option, you can easily restart your site by clicking the button.
Maximizing Memory Analysis shows the following warning and graph. (Note that there's more content not captured in the screenshot.)

The following is suggested when clicking "View Solutions". You can easily scale up by clicking a button.

Feedback
Coming soon: Throughout 2024 we will be phasing out GitHub Issues as the feedback mechanism for content and replacing it with a new feedback system. For more information see: https://aka.ms/ContentUserFeedback.
Submit and view feedback for