Add a line layer to the map
A line layer can be used to render LineString and MultiLineString features as paths or routes on the map. A line layer can also be used to render the outline of Polygon and MultiPolygon features. A data source is connected to a line layer to provide it with data to render.
Tip
Line layers by default will render the coordinates of polygons as well as lines in a data source. To limit the layer such that it only renders LineString features set the filter property of the layer to ['==', ['geometry-type'], 'LineString'] or ['any', ['==', ['geometry-type'], 'LineString'], ['==', ['geometry-type'], 'MultiLineString']] if you want to include MultiLineString features as well.
The following code shows how to create a line. Add the line to a data source, then render it with a line layer using the LineLayer class.
//Create a data source and add it to the map.
var dataSource = new atlas.source.DataSource();
map.sources.add(dataSource);

//Create a line and add it to the data source.
dataSource.add(new atlas.data.LineString([[-73.972340, 40.743270], [-74.004420, 40.756800]]));

//Create a line layer to render the line to the map.
map.layers.add(new atlas.layer.LineLayer(dataSource, null, {
    strokeColor: 'blue',
    strokeWidth: 5
}));
The following screenshot shows a sample of the above functionality.

Line layers can be styled using LineLayerOptions and Use data-driven style expressions.
Add symbols along a line
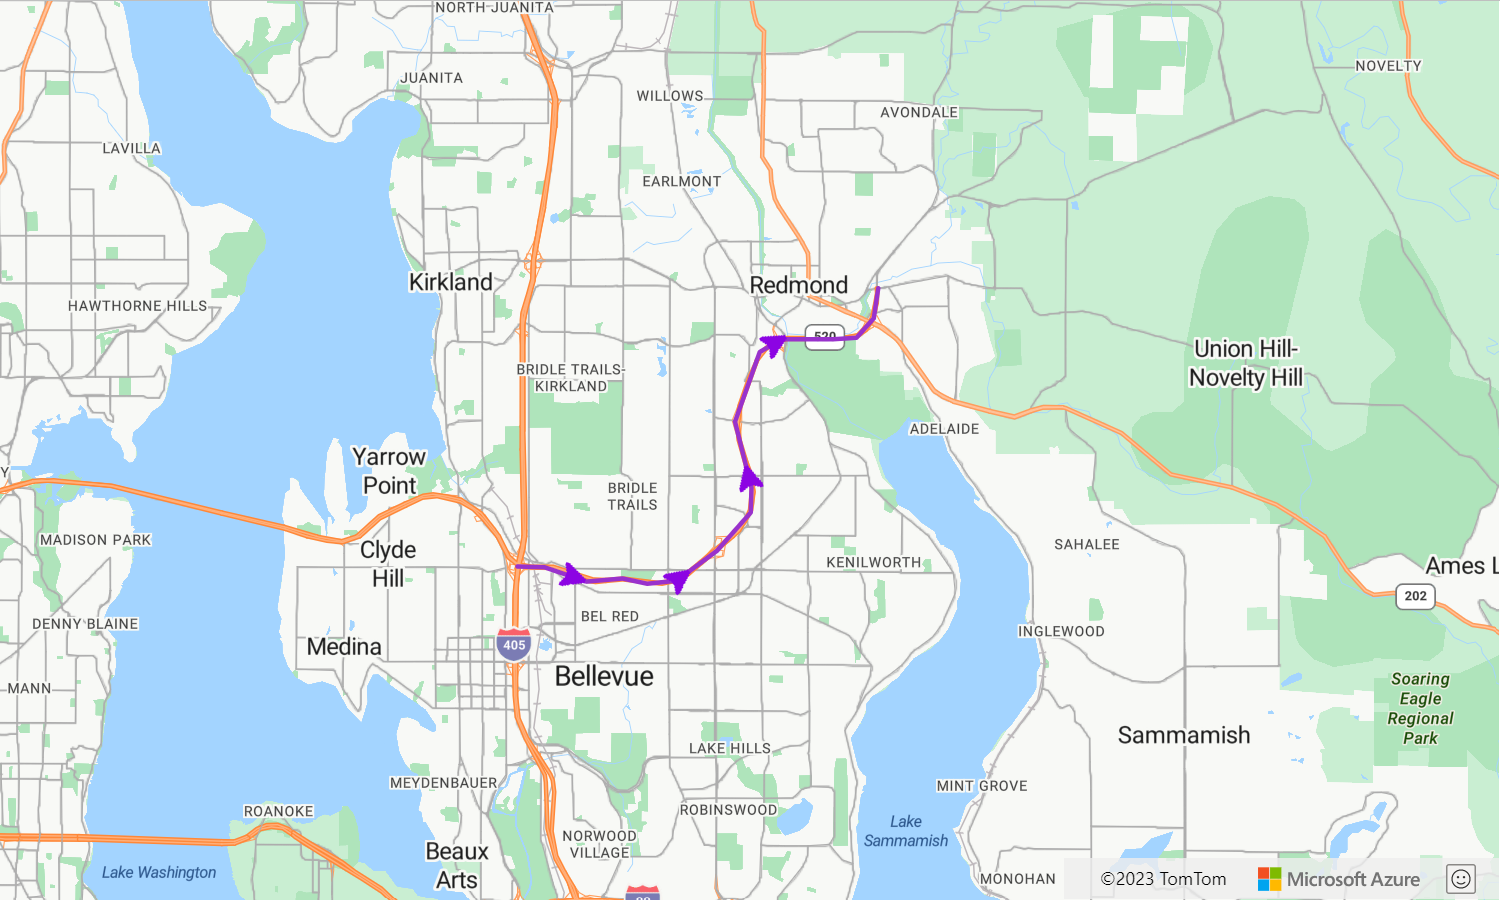
The following sample demonstrates how to add arrow icons along a line on the map. When using a symbol layer, set the placement option to line. This option renders the symbols along the line and rotates the icons (0 degrees = right).
function InitMap()
{
    var map = new atlas.Map('myMap', {
    center: [-122.135, 47.65],
    zoom: 11,
    view: "Auto",

    //Add authentication details for connecting to Azure Maps.
    authOptions: {
      authType: 'subscriptionKey',
      subscriptionKey: '{Your-Azure-Maps-Subscription-key}'
    }
  });

  var datasource;

  //Wait until the map resources are ready.
  map.events.add('ready', function () {

    //Load the custom image icon into the map resources.
    map.imageSprite.add('arrow-icon', 'https://s3-us-west-2.amazonaws.com/s.cdpn.io/1717245/purpleArrowRight.png').then(function () {
      //Create a data source and add it to the map.
      datasource = new atlas.source.DataSource();
      map.sources.add(datasource);

      //Create a line and add it to the data source.
      datasource.add(new atlas.data.Feature(new atlas.data.LineString([
        [-122.18822, 47.63208],
        [-122.18204, 47.63196],
        [-122.17243, 47.62976],
        [-122.16419, 47.63023],
        [-122.15852, 47.62942],
        [-122.15183, 47.62988],
        [-122.14256, 47.63451],
        [-122.13483, 47.64041],
        [-122.13466, 47.64422],
        [-122.13844, 47.65440],
        [-122.13277, 47.66515],
        [-122.12779, 47.66712],
        [-122.11595, 47.66712],
        [-122.11063, 47.66735],
        [-122.10668, 47.67035],
        [-122.10565, 47.67498]
      ])));

      //Add a layers for rendering data.
      map.layers.add([
        //Add a line layer for displaying the line.
        new atlas.layer.LineLayer(datasource, null, {
          strokeColor: 'DarkOrchid',
          strokeWidth: 3
        }),

        //Add a symbol layer for rendering the arrow along the line.
        new atlas.layer.SymbolLayer(datasource, null, {
          //Specify how much space should be between the symbols in pixels.
          lineSpacing: 100,

          //Tell the symbol layer that the symbols are being rendered along a line.
          placement: 'line',
          iconOptions: {
            image: 'arrow-icon',
            allowOverlap: true,
            anchor: 'center',
            size: 0.8
          }
        })
      ]);
    });
  });
}
This code creates a map that appears as follows:
Tip
The Azure Maps web SDK provides several customizable image templates you can use with the symbol layer. For more information, see the How to use image templates document.
Add a stroke gradient to a line
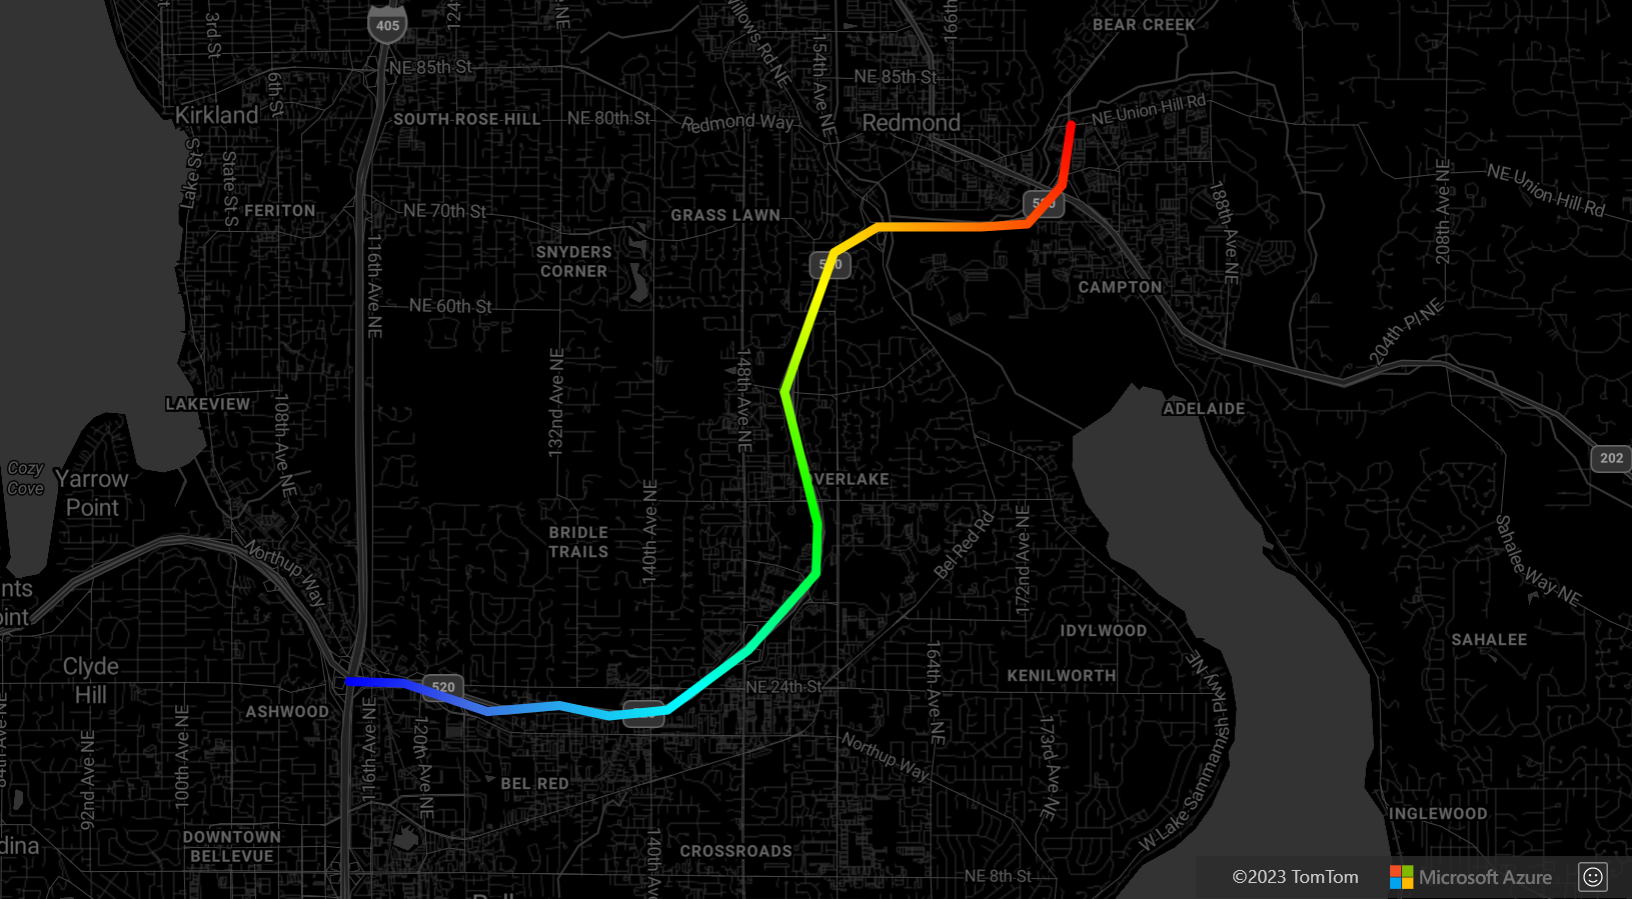
You may apply a single stroke color to a line. You can also fill a line with a gradient of colors to show transition from one line segment to the next line segment. For example, line gradients can be used to represent changes over time and distance, or different temperatures across a connected line of objects. In order to apply this feature to a line, the data source must have the lineMetrics option set to true, and then a color gradient expression can be passed to the strokeColor option of the line. The stroke gradient expression has to reference the ['line-progress'] data expression that exposes the calculated line metrics to the expression.
For a fully functional sample that shows how to apply a stroke gradient to a line on the map, see Line with Stroke Gradient in the Azure Maps Samples. For the source code for this sample, see Line with Stroke Gradient source code.
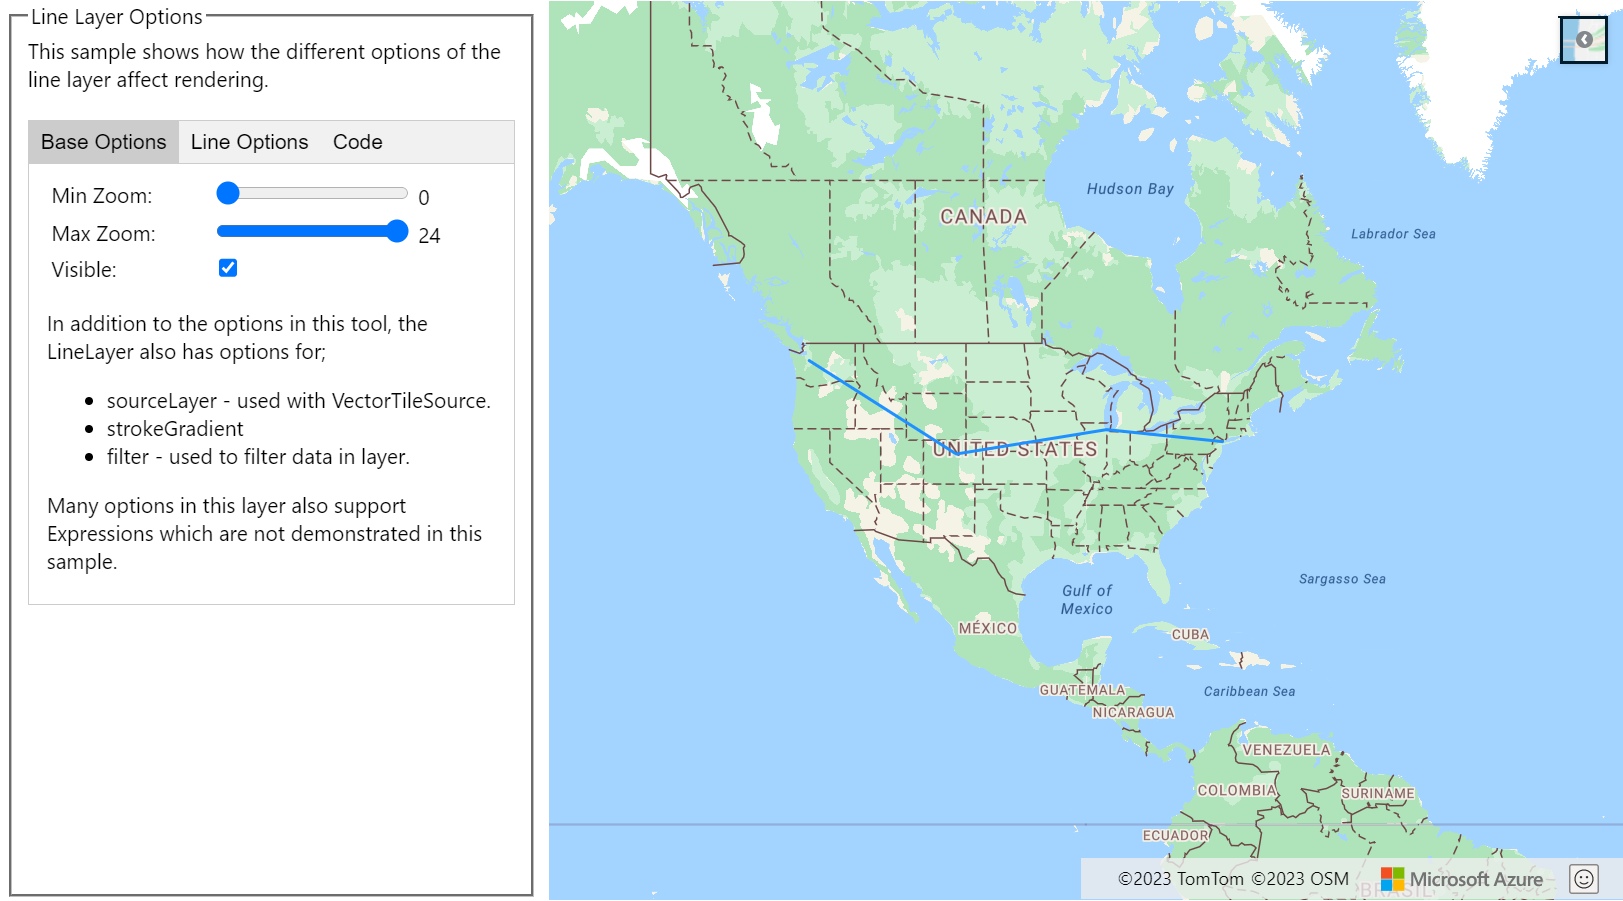
Customize a line layer
The Line layer has several styling options. For a fully functional sample that interactively demonstrates the line options, see Line Layer Options in the Azure Maps Samples. For the source code for this sample, see Line Layer Options source code.
Next steps
Learn more about the classes and methods used in this article:
See the following articles for more code samples to add to your maps:
Feedback
Coming soon: Throughout 2024 we will be phasing out GitHub Issues as the feedback mechanism for content and replacing it with a new feedback system. For more information see: https://aka.ms/ContentUserFeedback.
Submit and view feedback for