Add a polygon layer to the map
This article shows you how to render the areas of Polygon and MultiPolygon feature geometries on the map using a polygon layer. The Azure Maps Web SDK also supports the creation of Circle geometries as defined in the extended GeoJSON schema. These circles are transformed into polygons when rendered on the map. All feature geometries can easily be updated when wrapped with the atlas.Shape class.
Use a polygon layer
When a polygon layer is connected to a data source and loaded on the map, it renders the area with Polygon and MultiPolygon features. To create a polygon, add it to a data source, and render it with a polygon layer using the PolygonLayer class.
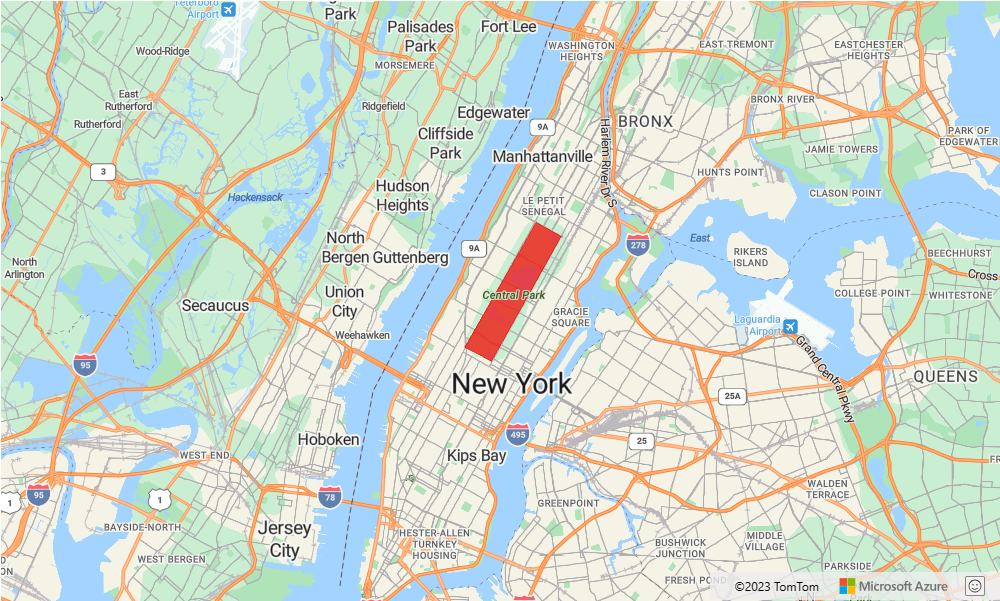
The following sample code demonstrates creating a polygon layer that covers New York City's Central Park with a red polygon.
function InitMap()
{
  var map = new atlas.Map('myMap', {
    center: [-73.97, 40.78],
    zoom: 11,
    view: "Auto",

    //Add authentication details for connecting to Azure Maps.
    authOptions: {
      authType: 'subscriptionKey',
      subscriptionKey: '{Your-Azure-Maps-Subscription-key}'
    }
  });

  //Wait until the map resources are ready.
  map.events.add('ready', function () {

    /*Create a data source and add it to the map*/
    var dataSource = new atlas.source.DataSource();
    map.sources.add(dataSource);

    /*Create a rectangle*/
    dataSource.add(new atlas.Shape(new atlas.data.Feature(
    new atlas.data.Polygon([[
      [-73.98235, 40.76799],
      [-73.95785, 40.80044],
      [-73.94928, 40.7968],
      [-73.97317, 40.76437],
      [-73.98235, 40.76799]
    ]])
    )));

    /*Create and add a polygon layer to render the polygon to the map*/
    map.layers.add(new atlas.layer.PolygonLayer(dataSource, null,{
    fillColor: "red",
    fillOpacity: 0.7
    }), 'labels')
  });
}
Use a polygon and line layer together
A line layer is used to render the outline of polygons. The following code sample renders a polygon like the previous example, but now adds a line layer. This line layer is a second layer connected to the data source.
function InitMap()
{
  var map = new atlas.Map('myMap', {
    center: [-73.97, 40.78],
    zoom: 11,
    view: "Auto",

    //Add authentication details for connecting to Azure Maps.
    authOptions: {
      // Get an Azure Maps key at https://azuremaps.com/.
      authType: 'subscriptionKey',
      subscriptionKey: '{subscription key}'
    }
  });

  //Wait until the map resources are ready.
  map.events.add('ready', function () {

    /*Create a data source and add it to the map*/
    var dataSource = new atlas.source.DataSource();
    map.sources.add(dataSource);

    /*Create a rectangle*/
    dataSource.add(new atlas.data.Polygon([[
    [-73.98235, 40.76799],
    [-73.95785, 40.80045],
    [-73.94928, 40.7968],
    [-73.97317, 40.76437],
    [-73.98235, 40.76799]
    ]])
          );

    //Create a polygon layer to render the filled in area of the polygon.
    var polygonLayer = new atlas.layer.PolygonLayer(dataSource, 'myPolygonLayer', {
    fillColor: 'rgba(0, 200, 200, 0.5)'
    });

    //Create a line layer for greater control of rendering the outline of the polygon.
    var lineLayer = new atlas.layer.LineLayer(dataSource, 'myLineLayer', {
    strokeColor: 'red',
    strokeWidth: 2
    });

    /*Create and add a polygon layer to render the polygon to the map*/
    map.layers.add([polygonLayer, lineLayer])
  });
}

Fill a polygon with a pattern
In addition to filling a polygon with a color, you may use an image pattern to fill the polygon. Load an image pattern into the maps image sprite resources and then reference this image with the fillPattern property of the polygon layer.
For a fully functional sample that shows how to use an image template as a fill pattern in a polygon layer, see Fill polygon with built-in icon template in the Azure Maps Samples. For the source code for this sample, see Fill polygon with built-in icon template source code.
![]()
Tip
The Azure Maps web SDK provides several customizable image templates you can use as fill patterns. For more information, see the How to use image templates document.
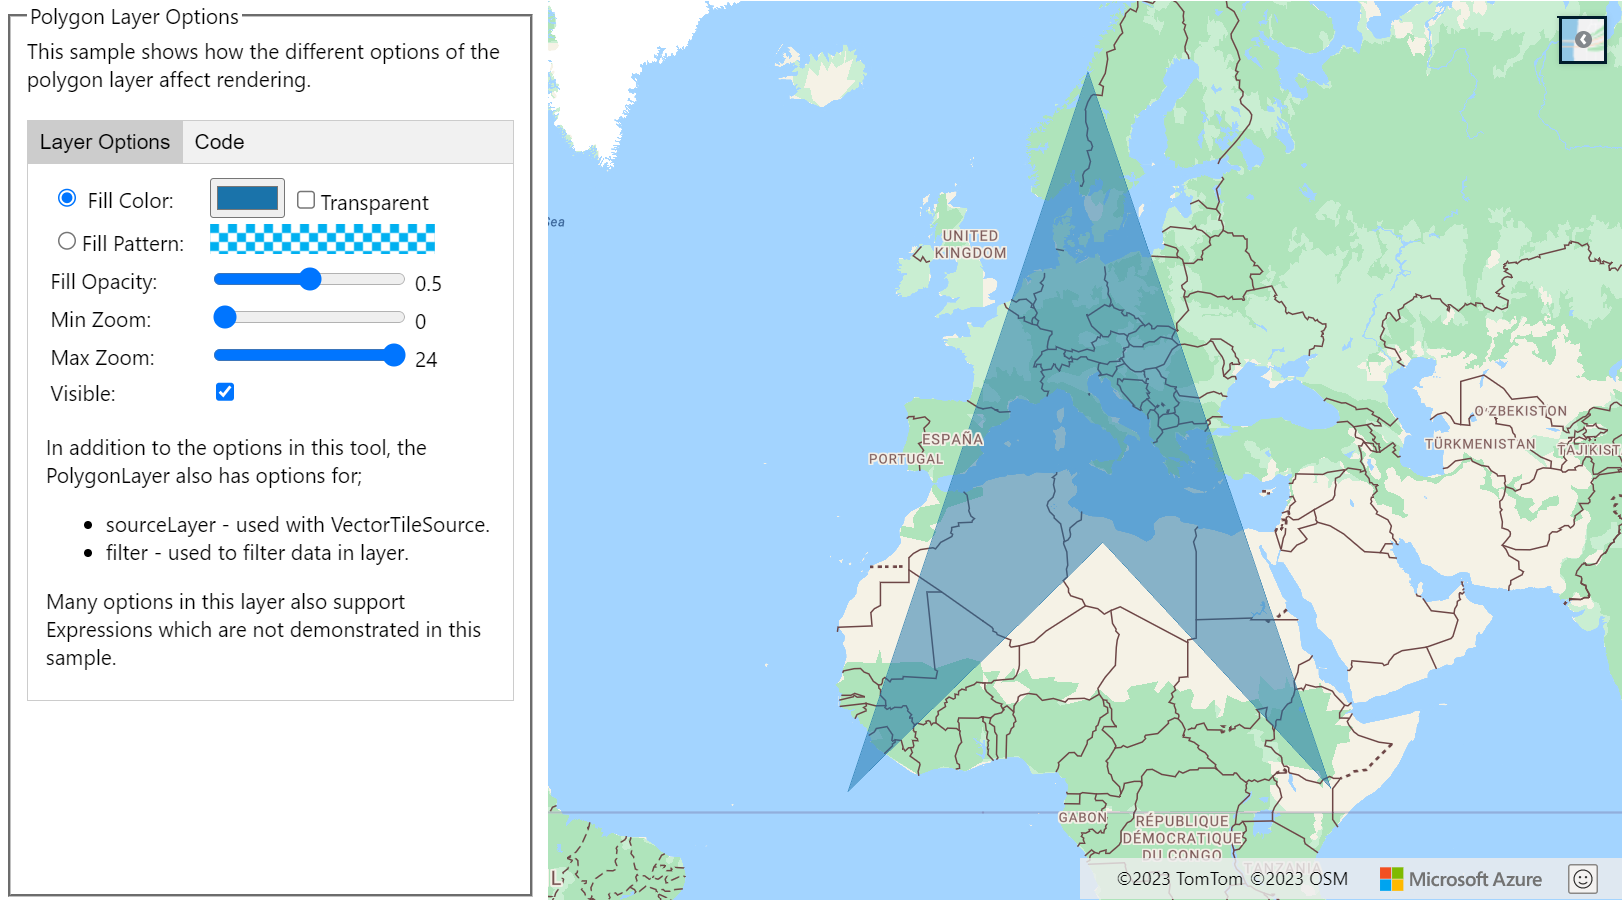
Customize a polygon layer
The Polygon layer only has a few styling options. See the Polygon Layer Options sample map in the Azure Maps Samples to try them out. For the source code for this sample, see Polygon Layer Options source code.
Add a circle to the map
Azure Maps uses an extended version of the GeoJSON schema that provides a definition for circles. A circle is rendered on the map by creating a Point feature. This Point has a subType property with a value of "Circle" and a radius property with a number that represents the radius in meters.
{
    "type": "Feature",
    "geometry": {
        "type": "Point",
        "coordinates": [-122.126986, 47.639754]
    },
    "properties": {
        "subType": "Circle",
        "radius": 100
    }
}
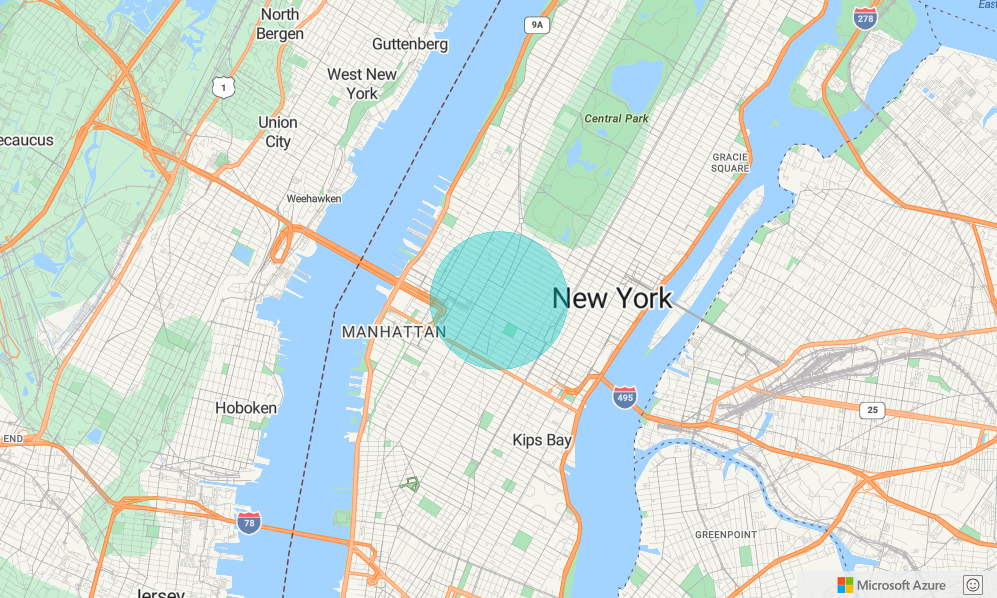
The Azure Maps Web SDK converts these Point features into Polygon features. Then, these features are rendered on the map using polygon and line layers as shown in the following code sample.
function InitMap()
{
  var map = new atlas.Map('myMap', {
    center: [-73.985708, 40.75773],
    zoom: 12,
    view: "Auto",

    //Add authentication details for connecting to Azure Maps.
    authOptions: {
      // Get an Azure Maps key at https://azuremaps.com/.
      authType: 'subscriptionKey',
      subscriptionKey: '{Your-Azure-Maps-Subscription-key}'
    }
  });

  //Wait until the map resources are ready.
  map.events.add('ready', function () {

    /*Create a data source and add it to the map*/
    var dataSource = new atlas.source.DataSource();
    map.sources.add(dataSource);

    //Create a circle
    dataSource.add(new atlas.data.Feature(new atlas.data.Point([-73.985708, 40.75773]),
    {
      subType: "Circle",
      radius: 1000
    }));

    // Create a polygon layer to render the filled in area
    // of the circle polygon, and add it to the map.
    map.layers.add(new atlas.layer.PolygonLayer   (dataSource, null, {
      fillColor: 'rgba(0, 200, 200, 0.8)'
    }));
  });
}
Make a geometry easy to update
A Shape class wraps a Geometry or Feature and makes it easy to update and maintain these features. To instantiate a shape variable, pass a geometry or a set of properties to the shape constructor.
//Creating a shape by passing in a geometry and a object containing properties.
var shape1 = new atlas.Shape(new atlas.data.Point[0,0], { myProperty: 1 });

//Creating a shape using a feature.
var shape2 = new atlas.Shape(new atlas.data.Feature(new atlas.data.Point[0,0], { myProperty: 1 });
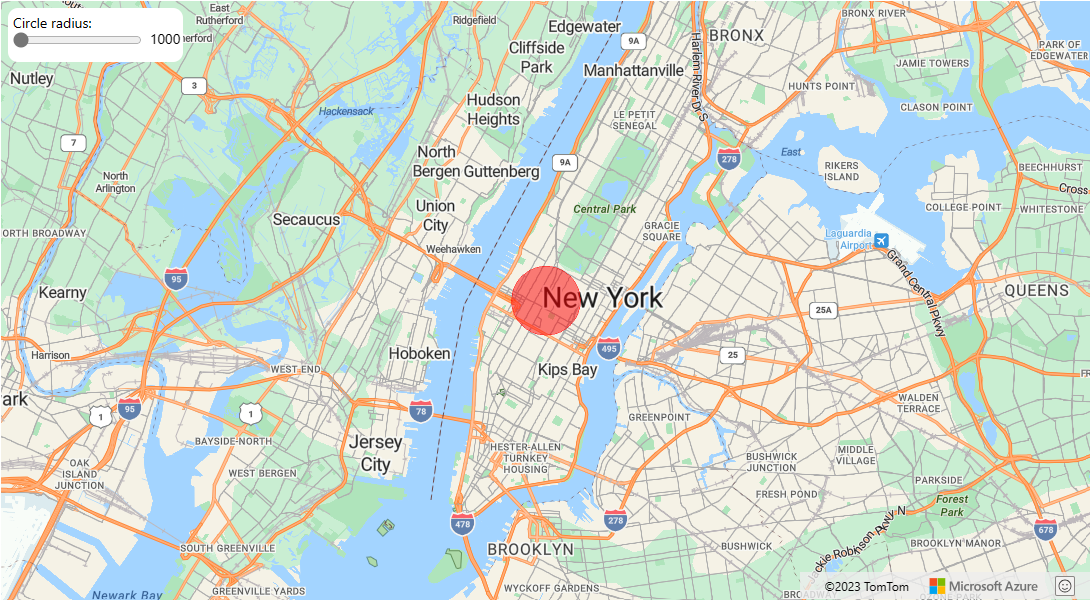
The Make a geometry easy to update sample shows how to wrap a circle GeoJSON object with a shape class. As the value of the radius changes in the shape, the circle renders automatically on the map. For the source code for this sample, see Make a geometry easy to update source code.
Next steps
Learn more about the classes and methods used in this article:
For more code examples to add to your maps, see the following articles:
More resources:
Feedback
Coming soon: Throughout 2024 we will be phasing out GitHub Issues as the feedback mechanism for content and replacing it with a new feedback system. For more information see: https://aka.ms/ContentUserFeedback.
Submit and view feedback for