Geocoding in Azure Maps Power BI Visual
Azure Maps uses the latitude and longitude coordinate system to locate places on the map. The Azure Maps Power BI Visual provides latitude and longitude fields to pinpoint a specific location on the map, however most data sources use an address to pinpoint a location as opposed to latitude and longitude values.
The Azure Maps Power BI Visual now provides a Location field that accepts address values that can be used to pinpoint a location on the map using geocoding.
Geocoding is the process of taking an address and returning the corresponding latitude/longitude coordinate. The address determines the granularity it's possible to geocode, such as a city as opposed to a specific street address.
The location field
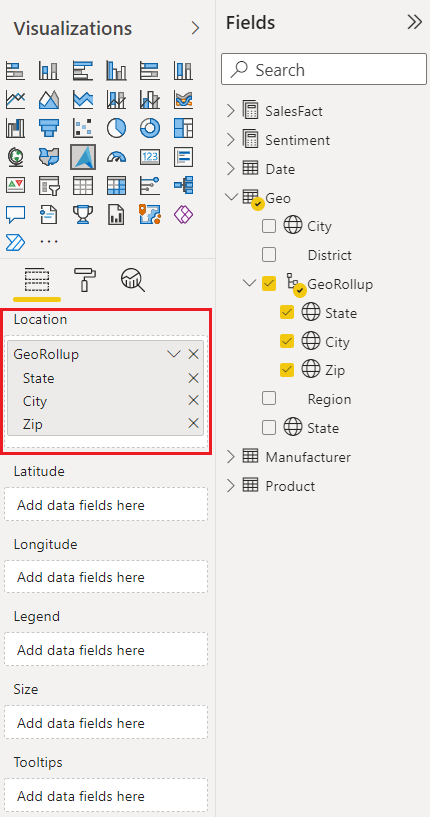
The Location field in the Azure Maps Power BI Visual can accept multiple values, such as country/region, state, city, street address and zip code. By providing multiple sources of location information in the Location field, you help to guarantee more accurate results and eliminate ambiguity that would prevent a specific location to be determined. For example, there are over 20 different cities in the United States named Franklin.
Use geo-hierarchies to drill down
When entering multiple values into the Location field, you create a geo-hierarchy. Geo-hierarchies enable the hierarchical drill-down features in the map, allowing you to drill down to different "levels" of location.
| Button | Description |
|---|---|
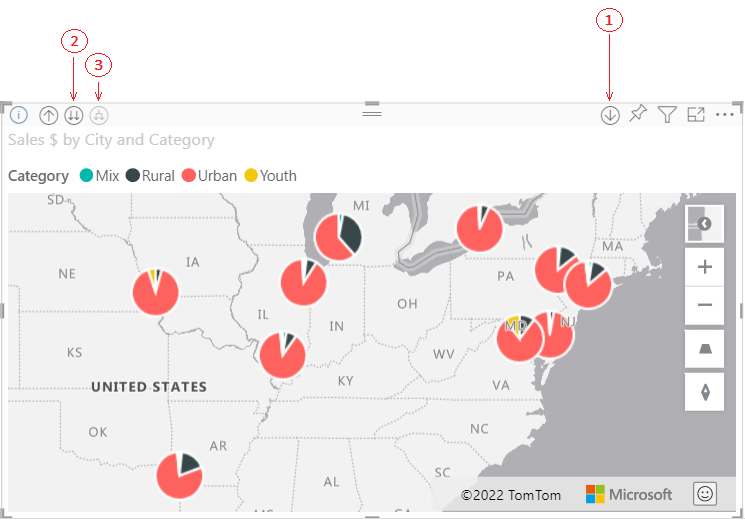
| 1 | The drill button on the far right, called Drill Mode, allows you to select a map Location and drill down into that specific location one level at a time. For example, if you turn on the drill-down option and select North America, you move down in the hierarchy to the next level--states in North America. For geocoding, Power BI sends Azure Maps country and state data for North America only. The button on the left goes back up one level. |
| 2 | The double arrow drills to the next level of the hierarchy for all locations at once. For example, if you're currently looking at countries/regions and then use this option to move to the next level, states, Power BI displays state data for all countries/regions. For geocoding, Power BI sends Azure Maps state data (no country/region data) for all locations. This option is useful if each level of your hierarchy is unrelated to the level above it. |
| 3 | Similar to the drill-down option, except that you don't need to select the map. It expands down to the next level of the hierarchy remembering the current level's context. For example, if you're currently looking at countries/regions and select this icon, you move down in the hierarchy to the next level--states. For geocoding, Power BI sends data for each state and its corresponding country/region to help Azure Maps geocode more accurately. In most maps, you'll either use this option or the drill-down option on the far right. This sends Azure as much information as possible and result in more accurate location information. |
Categorize geographic fields in Power BI
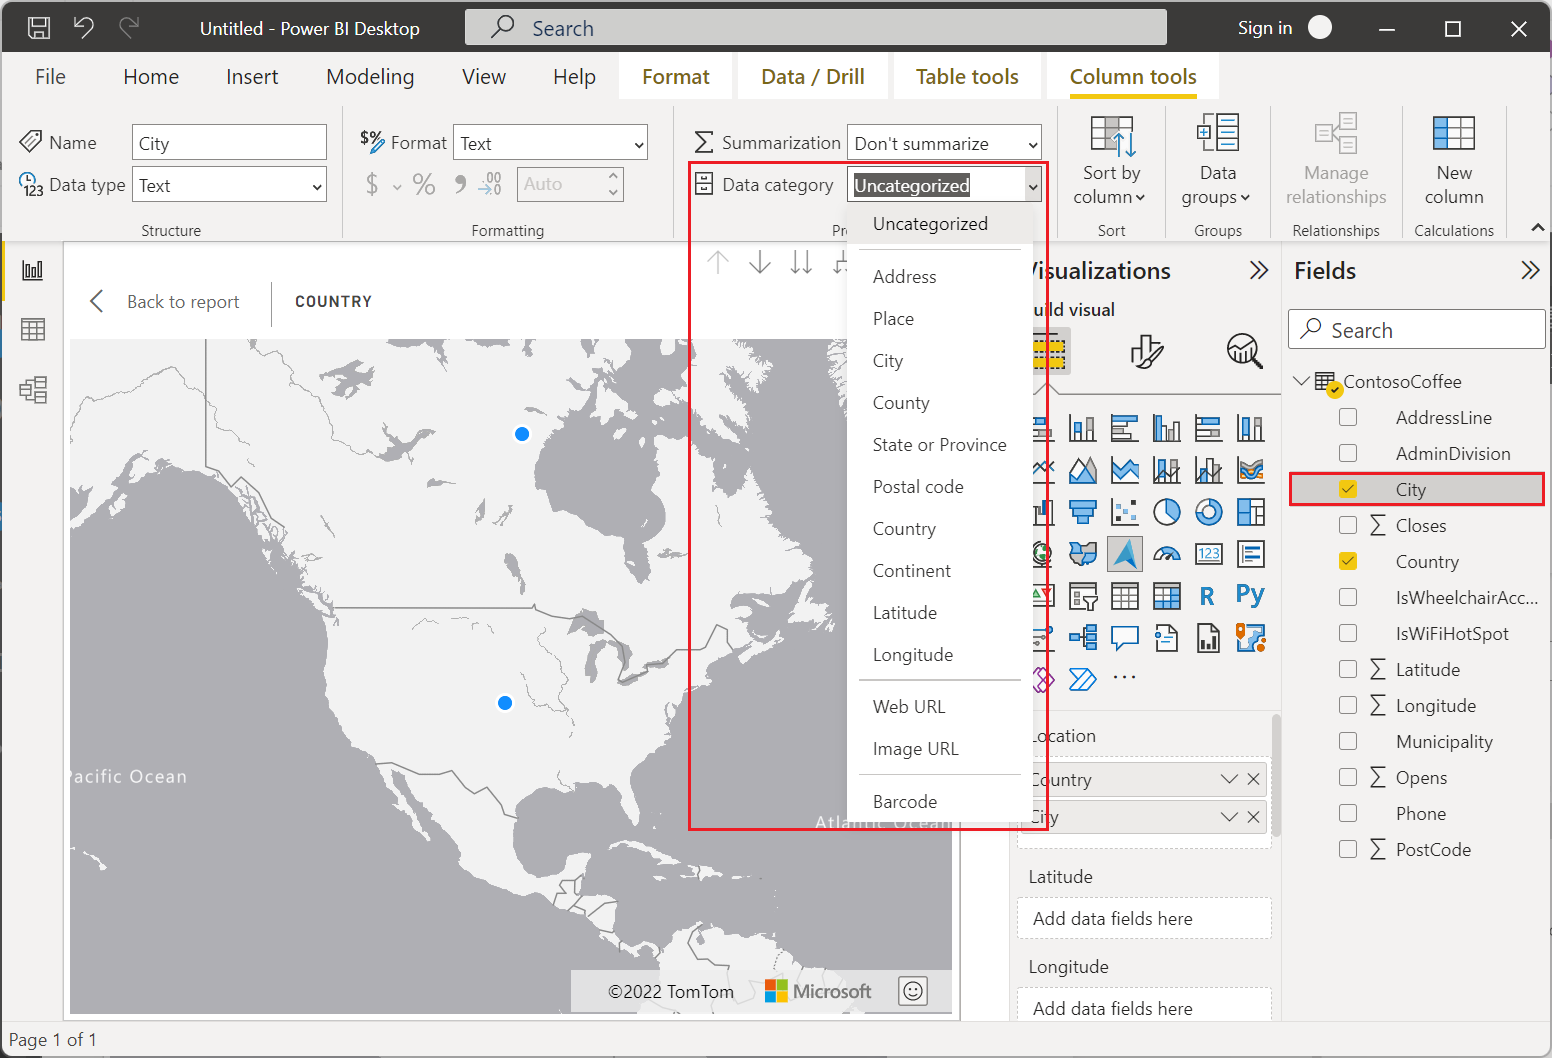
To ensure fields are correctly geocoded, you can set the Data Category on the data fields in Power BI. In Data view, select the desired column. From the ribbon, select the Modeling tab and then set the Data Category to one of the following properties: Address, City, Continent, Country, Region, County, Postal Code, State, or Province. These data categories help Azure correctly encode the data. To learn more, see Data categorization in Power BI Desktop. If you're live connecting to SQL Server Analysis Services, set the data categorization outside of Power BI using SQL Server Data Tools (SSDT).
Next steps
Learn more about the Azure Maps Power BI visual:
Learn about the Azure Maps Power BI visual Pie Chart layer that uses geocoding:
Feedback
Coming soon: Throughout 2024 we will be phasing out GitHub Issues as the feedback mechanism for content and replacing it with a new feedback system. For more information see: https://aka.ms/ContentUserFeedback.
Submit and view feedback for