Troubleshoot no data: Application Insights for .NET and .NET Core
This article provides troubleshooting information to help resolve issues when data is missing or doesn't appear when you're using Application Insights for .NET and .NET Core.
Note
This article was recently updated to use the term Azure Monitor logs instead of Log Analytics. Log data is still stored in a Log Analytics workspace, and it's still collected and analyzed by the same Log Analytics service. We're updating the terminology to better reflect the role of logs in Azure Monitor. For more information, see Azure Monitor terminology changes.
Some of my telemetry is missing
Example scenarios:
In Application Insights, I see only a fraction of the events that my app generates
- If you're consistently seeing the same fraction, it's probably because of adaptive sampling. To confirm this cause, select Overview > Search and look at an instance of a Request or other event. To see the full property details, select the ellipsis (...) at the bottom of the Properties section. If the request count is greater than 1, sampling is in operation.
- It's possible that you're hitting a data rate limit for your pricing plan. These limits are applied per minute.
I'm randomly experiencing data loss
- Check whether you're experiencing data loss at the telemetry channel.
- Check for any known issues in the telemetry channel of the GitHub repo.
Note
If data is missing, it's possible that the data is being rejected by the back end. This situation can occur for various reasons, including the following causes:
- Required fields are missing.
- One or more fields exceed size limits.
- SDKs are failing silently instead of throwing exceptions.
You can use a tool like Fiddler, or any other tool that will inspect HTTP traffic, to confirm successful telemetry uploads. The back end will return a "200 OK" HTTP status code to indicate a successful upload. Or you can use the SDK logs to see if the back end is rejecting data.
I'm experiencing data loss in a console app or on a web app when the app is about to stop
- The SDK channel keeps telemetry in buffer and sends it in batches. If the application is shutting down, you might need to explicitly call Flush(). The
Flush()behavior depends on the actual channel used. - Per .NET Core/.NET Framework Console application, explicitly calling
Flush()followed by sleep is required in console apps.
Request count collected by the Application Insights SDK doesn't match the IIS log count for my application
Internet Information Services (IIS) logs counts of all requests that reach IIS and can inherently differ from the total requests that reach an application. Because of this behavior, it isn't guaranteed that the request count collected by the SDKs will match the total IIS log count.
No data from my server
Example scenarios:
I installed my app on my web server and now I don't see any telemetry from it. It worked OK on my dev machine
A firewall issue is most likely the cause. Set firewall exceptions for Application Insights to send data.
I installed the Azure Monitor Application Insights Agent on my web server to monitor existing apps. I don't see any results
See Troubleshooting Status Monitor.
Check TLS/SSL client settings (ASP.NET)
If you have an ASP.NET application hosted in Azure App Service or in IIS on a virtual machine, your application could fail to connect to the Snapshot Debugger service because of a missing SSL security protocol.
The Snapshot Debugger endpoint requires TLS version 1.2. The set of SSL security protocols is one of the quirks enabled by the <httpRuntime> element's targetFramework attribute value in the <system.web> section of the web.config file. If the target framework is 4.5.2 or lower, TLS 1.2 isn't included by default.
Note
The <httpRuntime> element's targetFramework attribute value is independent of the target framework used when you build your application.
To check the setting, open your web.config file and find the <system.web> section. Make sure that the targetFramework for <httpRuntime> is set to 4.6 or above.
<system.web>
  ...
  <httpRuntime targetFramework="4.7.2" />
  ...
</system.web>
Note
Modifying the <httpRuntime> element's targetFramework value changes the runtime quirks applied to your application and can cause other subtle behavior changes. Be sure to test your application thoroughly after you make this change. For a full list of compatibility changes, see Retargeting changes.
If the target framework is 4.7 or above, Windows determines the available protocols. In Azure App Service, TLS 1.2 is available. However, if you're using your own virtual machine, you might need to enable TLS 1.2 in the OS.
FileNotFoundException: "Could not load file or assembly Microsoft.AspNet TelemetryCorrelation"
For more information on this error, see GitHub issue 1610.
When you upgrade from Application Insights SDKs older than version 2.4, make sure the following changes were applied to the web.config and ApplicationInsights.config files:
In web.config, you should have two HTTP modules instead of one. Order is important for some scenarios:
<system.webServer>
  <modules>
    <add name="TelemetryCorrelationHttpModule"
      type="Microsoft.AspNet.TelemetryCorrelation.TelemetryCorrelationHttpModule, Microsoft.AspNet.TelemetryCorrelation"
      preCondition="integratedMode,managedHandler" />
    <add name="ApplicationInsightsHttpModule"
      type="Microsoft.ApplicationInsights.Web.ApplicationInsightsHttpModule, Microsoft.AI.Web"
      preCondition="managedHandler" />
  </modules>
</system.webServer>
In ApplicationInsights.config, in addition to
RequestTrackingTelemetryModule, you should have the following telemetry module:<TelemetryModules> <Add Type="Microsoft.ApplicationInsights.Web.AspNetDiagnosticTelemetryModule, Microsoft.AI.Web"/> </TelemetryModules>
Failure to upgrade properly might lead to unexpected exceptions or telemetry not being collected.
No "Add Application Insights" option in Visual Studio
Example scenario:
When I right-click an existing project in Solution Explorer, I don't see any Application Insights options
- The tools don't support all types of .NET projects. Web and Windows Communication Foundation (WCF) projects are supported. For other project types, such as desktop or service applications, you can still add an Application Insights SDK to your project manually.
- Make sure you have Visual Studio 2013 Update 3 or later. It comes pre-installed with Developer Analytics tools, which provide the Application Insights SDK.
- Select Tools > Extensions and Updates. Then check whether Developer Analytics Tools is installed and enabled. If it's installed and enabled, select Updates to see if there's an update available.
- Open the New Project dialog and select ASP.NET Web Application. If you see the Application Insights option, the tools are installed. If not, uninstall and reinstall the Developer Analytics tools.
Adding Application Insights failed
Example scenario:
When I try to add Application Insights to an existing project, I see an error message
Likely causes:
- Communication with the Application Insights portal failed.
- There's a problem with your Azure account.
- You only have read access to the subscription or group where you were trying to create the new resource.
Fix:
- Check that you provided sign-in credentials for the correct Azure account.
- In your browser, check that you have access to the Azure portal. Open Settings and see if there's any restriction.
- Add Application Insights to your existing project. In Solution Explorer, right-click your project and select Add Application Insights.
"NuGet packages are missing" on my build server
Example scenario:
Everything builds OK when I'm debugging on my development machine, but I get a NuGet error on the build server
See NuGet Package Restore and Automatic Package Restore.
Missing menu command to open Application Insights from Visual Studio
Example scenario:
When I right-click my project Solution Explorer, I don't see any Application Insights commands, or I don't see an Open Application Insights command
Likely causes:
- You created the Application Insights resource manually.
- The project is of a type that the Application Insights tools don't support.
- The Developer Analytics tools are disabled in your instance of Visual Studio.
- Your version of Visual Studio is older than Visual Studio 2013 Update 3.
Fix:
- Make sure your Visual Studio version is Visual Studio 2013 Update 3 or later.
- Select Tools > Extensions and Updates. Check to make sure that Developer Analytics Tools is installed and enabled. If it's installed and enabled, select Updates to see if there's an update available.
- Right-click your project in Solution Explorer. If you see the command Application Insights > Configure Application Insights, use it to connect your project to the resource in the Application Insights service.
Otherwise, your project type isn't directly supported by the Developer Analytics tools. To see your telemetry, sign in to the Azure portal, search for and select Application Insights, and select your application.
"Access denied" on opening Application Insights from Visual Studio
Example scenario:
The "Open Application Insights" menu command takes me to the Azure portal, but I get an "access denied" error
The Microsoft sign-in that you last used on your default browser doesn't have access to the resource that was created when Application Insights was added to this app. There are two likely causes:
| Cause | Solution |
|---|---|
| You have more than one Microsoft account—perhaps a work and a personal Microsoft account. If that's the case, the sign-in that you last used on your default browser was for a different account than the one that has access to add Application Insights to the project. | Select your name in the upper right corner of the browser window and sign out. Then sign in with the account that has access. Search for and select Application Insights and select your application. |
| Someone else added Application Insights to the project and they forgot to give you access to the resource group in which it was created. | If they used an organizational account, they can add you to the team. Or they can grant you individual access to the resource group. |
"Asset not found" on opening Application Insights from Visual Studio
Example scenario:
The "Open Application Insights" menu command takes me to the Azure portal, but I get an "asset not found" error
There are two likely causes:
- The Application Insights resource for your application was deleted.
- Someone set or changed the connection string in ApplicationInsights.config without updating the project file.
The connection string in the ApplicationInsights.config file controls where the telemetry is sent. A line in the project file controls which resource is opened when you use the command in Visual Studio.
Apply one of the following fixes:
- In Solution Explorer, right-click the project and select Application Insights > Configure Application Insights. In the dialog, you can either select to send telemetry to an existing resource or create a new one.
- Open the resource directly. Sign in to the Azure portal, search for and select Application Insights, and select your application.
Where do I find my telemetry?
Example scenario:
I signed in to the Azure portal, and I'm looking at the Azure home dashboard. So where do I find my Application Insights data?
- Search for and select Application Insights, and select your application. If you don't have any projects there, you need to add or configure Application Insights in your web project. You can browse through the summary charts that appear to see more detail.
- In Visual Studio, while you're debugging your app, select the Application Insights button.
No server data (or no data at all)
Example scenario:
I ran my app and then opened the Application Insights service in Microsoft Azure, but all the charts show "Learn how to collect," "Not configured," or only page view and user data, but no server data
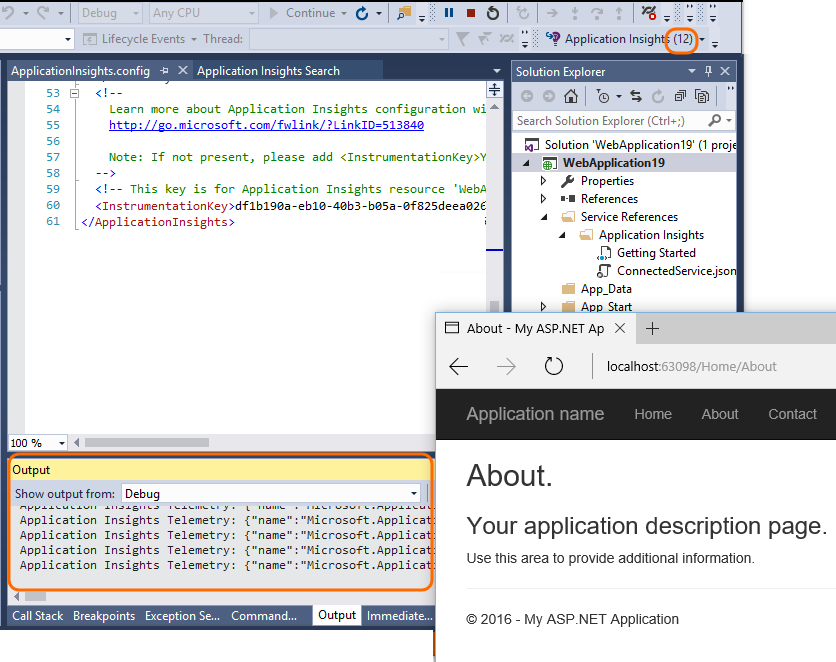
Run your application in debug mode in Visual Studio (F5). Use the application to generate some telemetry. Check that you can see events logged in the Visual Studio output window.
In the Application Insights portal, select Overview > Search. Data usually appears here first.
Select Refresh. The pane refreshes itself periodically, but you can also do it manually. The refresh interval is longer for larger time ranges.
Verify that the connection strings match. On the main pane for your app in the Application Insights portal, in the Essentials dropdown list, look at Connection string. Then, in your project in Visual Studio, open ApplicationInsights.config and find the
<ConnectionString>element. Check whether the two strings are equal. If the strings don't match, take one of the following actions:Environment Action Azure portal Search for and select Application Insights and then look for the app resource with the right string. Visual Studio In Visual Studio Solution Explorer, right-click the project and select Application Insights > Configure. Reset the app to send telemetry to the correct resource. If you can't find the matching strings, check to make sure that you're using the same sign-in credentials in Visual Studio that you're using to sign in to the portal.
In the Azure portal, search for and select Service Health. If the map has some alert indications, wait until they've returned to health. Then close and reopen your Application Insights application pane.
Check our status blog.
Did you write any code for the server-side SDK that might change the connection string in
TelemetryClientinstances or inTelemetryContext? Or did you write a filter or sampling configuration that might be filtering out too much?If you edited ApplicationInsights.config, carefully check the configuration of <TelemetryInitializers> and <TelemetryProcessors> elements. An incorrectly named type or parameter can cause the SDK to send no data.
No data on page views, browsers, and usage
Example scenario:
I see data in server response time and server requests charts, but no data in page view load time, or in the Browser or Usage panes
The data comes from scripts in the web pages.
- If you added Application Insights to an existing web project, you have to add the scripts by hand.
- Make sure Internet Explorer isn't displaying your site in Compatibility mode.
- Use the browser's debug feature (F12 on some browsers, then choose Network) to verify that data is being sent to
dc.services.visualstudio.com.
No dependency or exception data
See dependency telemetry and exception telemetry.
No performance data
Performance data like CPU and the I/O rate is available for the following environments under Settings > Servers:
- Java web services
- Windows desktop apps
- IIS web apps and services (if you install Application Insights agent)
- Azure Cloud Services
No (server) data since I published the app to my server
- Check that you copied all the
Microsoft.ApplicationInsightsDLLs to the server, together withMicrosoft.Diagnostics.Instrumentation.Extensions.Intercept.dll. - In your firewall, you might have to open some TCP ports.
- If you have to use a proxy to send out of your corporate network, set the <defaultProxy> element in web.config.
Performance impact when Application Insights is enabled
Enabling Application Insights SDK in your application may occasionally lead to performance issues, such as high CPU usage, memory leaks, thread leaks, or TCP port exhaustion. These issues commonly originate from the application leaking Microsoft.ApplicationInsights.Extensibility.TelemetryConfiguration objects. Each leaked instance creates two additional threads, which leading to a continual increase in the process's thread count over time. If you observe a growing number of threads, it's crucial to check for leaks of TelemetryConfiguration objects.
Common causes of TelemetryConfiguration leaks
There are two primary causes of leaking TelemetryConfiguration objects:
Explicit creation in code: If you create
TelemetryConfigurationobjects within your code, ensure that they are not inadvertently created per web request. Instead, use a shared global instance. For .NET Framework applications, access the global instance withTelemetryConfiguration.Active. For .NET Core applications, useTelemetryConfiguration.CreateDefault()to obtain a default configuration.Improper service provider usage: In .NET Core applications, avoid calling
services.BuildServiceProvider()withinConfigureServices. BuildServiceProvider method creates a new service provider that initializes and reads the configuration, resulting in a newTelemetryConfigurationobject each time. Such a pattern can lead to leaks and is discouraged, as noted in the Visual Studio warning against this coding practice.
I used to see data, but it's stopped
Have you hit your monthly quota of data points? Open Settings > Quota and Pricing to find out. If so, you can upgrade your plan or pay for more capacity. See the pricing scheme.
I don't see all the data I'm expecting
If your application sends considerable data and you're using the Application Insights SDK for ASP.NET version 2.0.0-beta3 or later, the adaptive sampling feature might operate and send only a percentage of your telemetry.
You can disable it, but we don't recommend that. Sampling is designed so that related telemetry is correctly transmitted for diagnostic purposes.
Client IP address is 0.0.0.0
On February 5, 2018, we announced that we removed logging of the Client IP address. This recommendation doesn't affect geolocation.
Note
If you need the first three octets of the IP address, you can use a telemetry initializer to add a custom attribute. This issue doesn't affect data collected before February 5, 2018.
Wrong geographical data in user telemetry
The city and country/region dimensions are derived from IP addresses and aren't always accurate. These IP addresses are processed for location first and then changed to 0.0.0.0 to be stored.
Exception "method not found" on running in Azure Cloud Services
Did you build for .NET Long Term Support (LTS)? Earlier versions aren't automatically supported in Azure Cloud Services roles. Install LTS on each role before you run your app.
Troubleshoot logs
Follow these instructions to capture troubleshooting logs for your framework.
.NET Framework
Note
Starting in version 2.14, the Microsoft.AspNet.ApplicationInsights.HostingStartup package is no longer necessary. SDK logs are now collected with the Microsoft.ApplicationInsights package. No other package is required.
Modify your ApplicationInsights.config file to include the following XML code:
<TelemetryModules>
  <Add Type="Microsoft.ApplicationInsights.Extensibility.Implementation.Tracing.FileDiagnosticsTelemetryModule, Microsoft.ApplicationInsights">
    <Severity>Verbose</Severity>
    <LogFileName>mylog.txt</LogFileName>
    <LogFilePath>C:\\SDKLOGS</LogFilePath>
  </Add>
</TelemetryModules>
Your application must have write permissions to the configured location.
Restart the process so that the SDK picks up these new settings.
Revert these changes when you're finished.
.NET Core
Install the Application Insights SDK NuGet package for ASP.NET Core package from NuGet. The version you install must match the current installed version of
Microsoft.ApplicationInsights.The latest version of
Microsoft.ApplicationInsights.AspNetCoreis 2.14.0, and it refers toMicrosoft.ApplicationInsightsversion 2.14.0. For this reason, the version ofMicrosoft.ApplicationInsights.AspNetCoreto be installed should be 2.14.0.Modify the
ConfigureServicesmethod in your Startup.cs class:services.AddSingleton<ITelemetryModule, FileDiagnosticsTelemetryModule>(); services.ConfigureTelemetryModule<FileDiagnosticsTelemetryModule>( (module, options) => { module.LogFilePath = "C:\\SDKLOGS"; module.LogFileName = "mylog.txt"; module.Severity = "Verbose"; } );Your application must have write permissions to the configured location.
Restart the process so that the SDK picks up these new settings.
Revert these changes when you're finished.
Collect logs with PerfView
PerfView is a free tool that helps isolate CPU, memory, and other issues.
The Application Insights SDK log EventSource has self-troubleshooting logs that can be captured by PerfView.
To collect logs, download PerfView and run this command:
PerfView.exe collect -MaxCollectSec:300 -NoGui /onlyProviders=*Microsoft-ApplicationInsights-Core,*Microsoft-ApplicationInsights-Data,*Microsoft-ApplicationInsights-WindowsServer-TelemetryChannel,*Microsoft-ApplicationInsights-Extensibility-AppMapCorrelation-Dependency,*Microsoft-ApplicationInsights-Extensibility-AppMapCorrelation-Web,*Microsoft-ApplicationInsights-Extensibility-DependencyCollector,*Microsoft-ApplicationInsights-Extensibility-HostingStartup,*Microsoft-ApplicationInsights-Extensibility-PerformanceCollector,*Microsoft-ApplicationInsights-Extensibility-EventCounterCollector,*Microsoft-ApplicationInsights-Extensibility-PerformanceCollector-QuickPulse,*Microsoft-ApplicationInsights-Extensibility-Web,*Microsoft-ApplicationInsights-Extensibility-WindowsServer,*Microsoft-ApplicationInsights-WindowsServer-Core,*Microsoft-ApplicationInsights-LoggerProvider,*Microsoft-ApplicationInsights-Extensibility-EventSourceListener,*Microsoft-ApplicationInsights-AspNetCore,*Redfield-Microsoft-ApplicationInsights-Core,*Redfield-Microsoft-ApplicationInsights-Data,*Redfield-Microsoft-ApplicationInsights-WindowsServer-TelemetryChannel,*Redfield-Microsoft-ApplicationInsights-Extensibility-AppMapCorrelation-Dependency,*Redfield-Microsoft-ApplicationInsights-Extensibility-AppMapCorrelation-Web,*Redfield-Microsoft-ApplicationInsights-Extensibility-DependencyCollector,*Redfield-Microsoft-ApplicationInsights-Extensibility-PerformanceCollector,*Redfield-Microsoft-ApplicationInsights-Extensibility-EventCounterCollector,*Redfield-Microsoft-ApplicationInsights-Extensibility-PerformanceCollector-QuickPulse,*Redfield-Microsoft-ApplicationInsights-Extensibility-Web,*Redfield-Microsoft-ApplicationInsights-Extensibility-WindowsServer,*Redfield-Microsoft-ApplicationInsights-LoggerProvider,*Redfield-Microsoft-ApplicationInsights-Extensibility-EventSourceListener,*Redfield-Microsoft-ApplicationInsights-AspNetCore
You can modify these parameters as needed:
| Parameter | Description |
|---|---|
MaxCollectSec |
Set this parameter to prevent PerfView from running indefinitely and affecting the performance of your server. |
OnlyProviders |
Set this parameter to only collect logs from the SDK. You can customize this list based on your specific investigations. |
NoGui |
Set this parameter to collect logs without the GUI. |
For more information, see:
Collect logs with dotnet-trace
Alternatively, you can use a cross-platform .NET Core tool, dotnet-trace, for collecting logs that can provide further help in troubleshooting. This tool might be helpful for Linux-based environments.
After you install dotnet-trace, run the following dotnet-trace collect command in bash:
dotnet-trace collect --process-id <PID> --providers Microsoft-ApplicationInsights-Core,Microsoft-ApplicationInsights-Data,Microsoft-ApplicationInsights-WindowsServer-TelemetryChannel,Microsoft-ApplicationInsights-Extensibility-AppMapCorrelation-Dependency,Microsoft-ApplicationInsights-Extensibility-AppMapCorrelation-Web,Microsoft-ApplicationInsights-Extensibility-DependencyCollector,Microsoft-ApplicationInsights-Extensibility-HostingStartup,Microsoft-ApplicationInsights-Extensibility-PerformanceCollector,Microsoft-ApplicationInsights-Extensibility-EventCounterCollector,Microsoft-ApplicationInsights-Extensibility-PerformanceCollector-QuickPulse,Microsoft-ApplicationInsights-Extensibility-Web,Microsoft-ApplicationInsights-Extensibility-WindowsServer,Microsoft-ApplicationInsights-WindowsServer-Core,Microsoft-ApplicationInsights-LoggerProvider,Microsoft-ApplicationInsights-Extensibility-EventSourceListener,Microsoft-ApplicationInsights-AspNetCore,Redfield-Microsoft-ApplicationInsights-Core,Redfield-Microsoft-ApplicationInsights-Data,Redfield-Microsoft-ApplicationInsights-WindowsServer-TelemetryChannel,Redfield-Microsoft-ApplicationInsights-Extensibility-AppMapCorrelation-Dependency,Redfield-Microsoft-ApplicationInsights-Extensibility-AppMapCorrelation-Web,Redfield-Microsoft-ApplicationInsights-Extensibility-DependencyCollector,Redfield-Microsoft-ApplicationInsights-Extensibility-PerformanceCollector,Redfield-Microsoft-ApplicationInsights-Extensibility-EventCounterCollector,Redfield-Microsoft-ApplicationInsights-Extensibility-PerformanceCollector-QuickPulse,Redfield-Microsoft-ApplicationInsights-Extensibility-Web,Redfield-Microsoft-ApplicationInsights-Extensibility-WindowsServer,Redfield-Microsoft-ApplicationInsights-LoggerProvider,Redfield-Microsoft-ApplicationInsights-Extensibility-EventSourceListener,Redfield-Microsoft-ApplicationInsights-AspNetCore
Remove Application Insights
To remove Application Insights in Visual Studio, follow the steps provided in Remove Application Insights in Visual Studio.
It still isn't working
See the Microsoft Q&A page for Application Insights.
Third-party information disclaimer
The third-party products that this article discusses are manufactured by companies that are independent of Microsoft. Microsoft makes no warranty, implied or otherwise, about the performance or reliability of these products.
Contact us for help
If you have questions or need help, create a support request, or ask Azure community support. You can also submit product feedback to Azure feedback community.
Feedback
Coming soon: Throughout 2024 we will be phasing out GitHub Issues as the feedback mechanism for content and replacing it with a new feedback system. For more information see: https://aka.ms/ContentUserFeedback.
Submit and view feedback for