User, session, and event analysis in Application Insights
Find out when people use your web app, what pages they're most interested in, where your users are located, and what browsers and operating systems they use. Analyze business and usage telemetry by using Application Insights.
Get started
If you don't yet see data in the Users, Sessions, or Events panes in the Application Insights portal, learn how to get started with the Usage tools.
The Users, Sessions, and Events segmentation tool
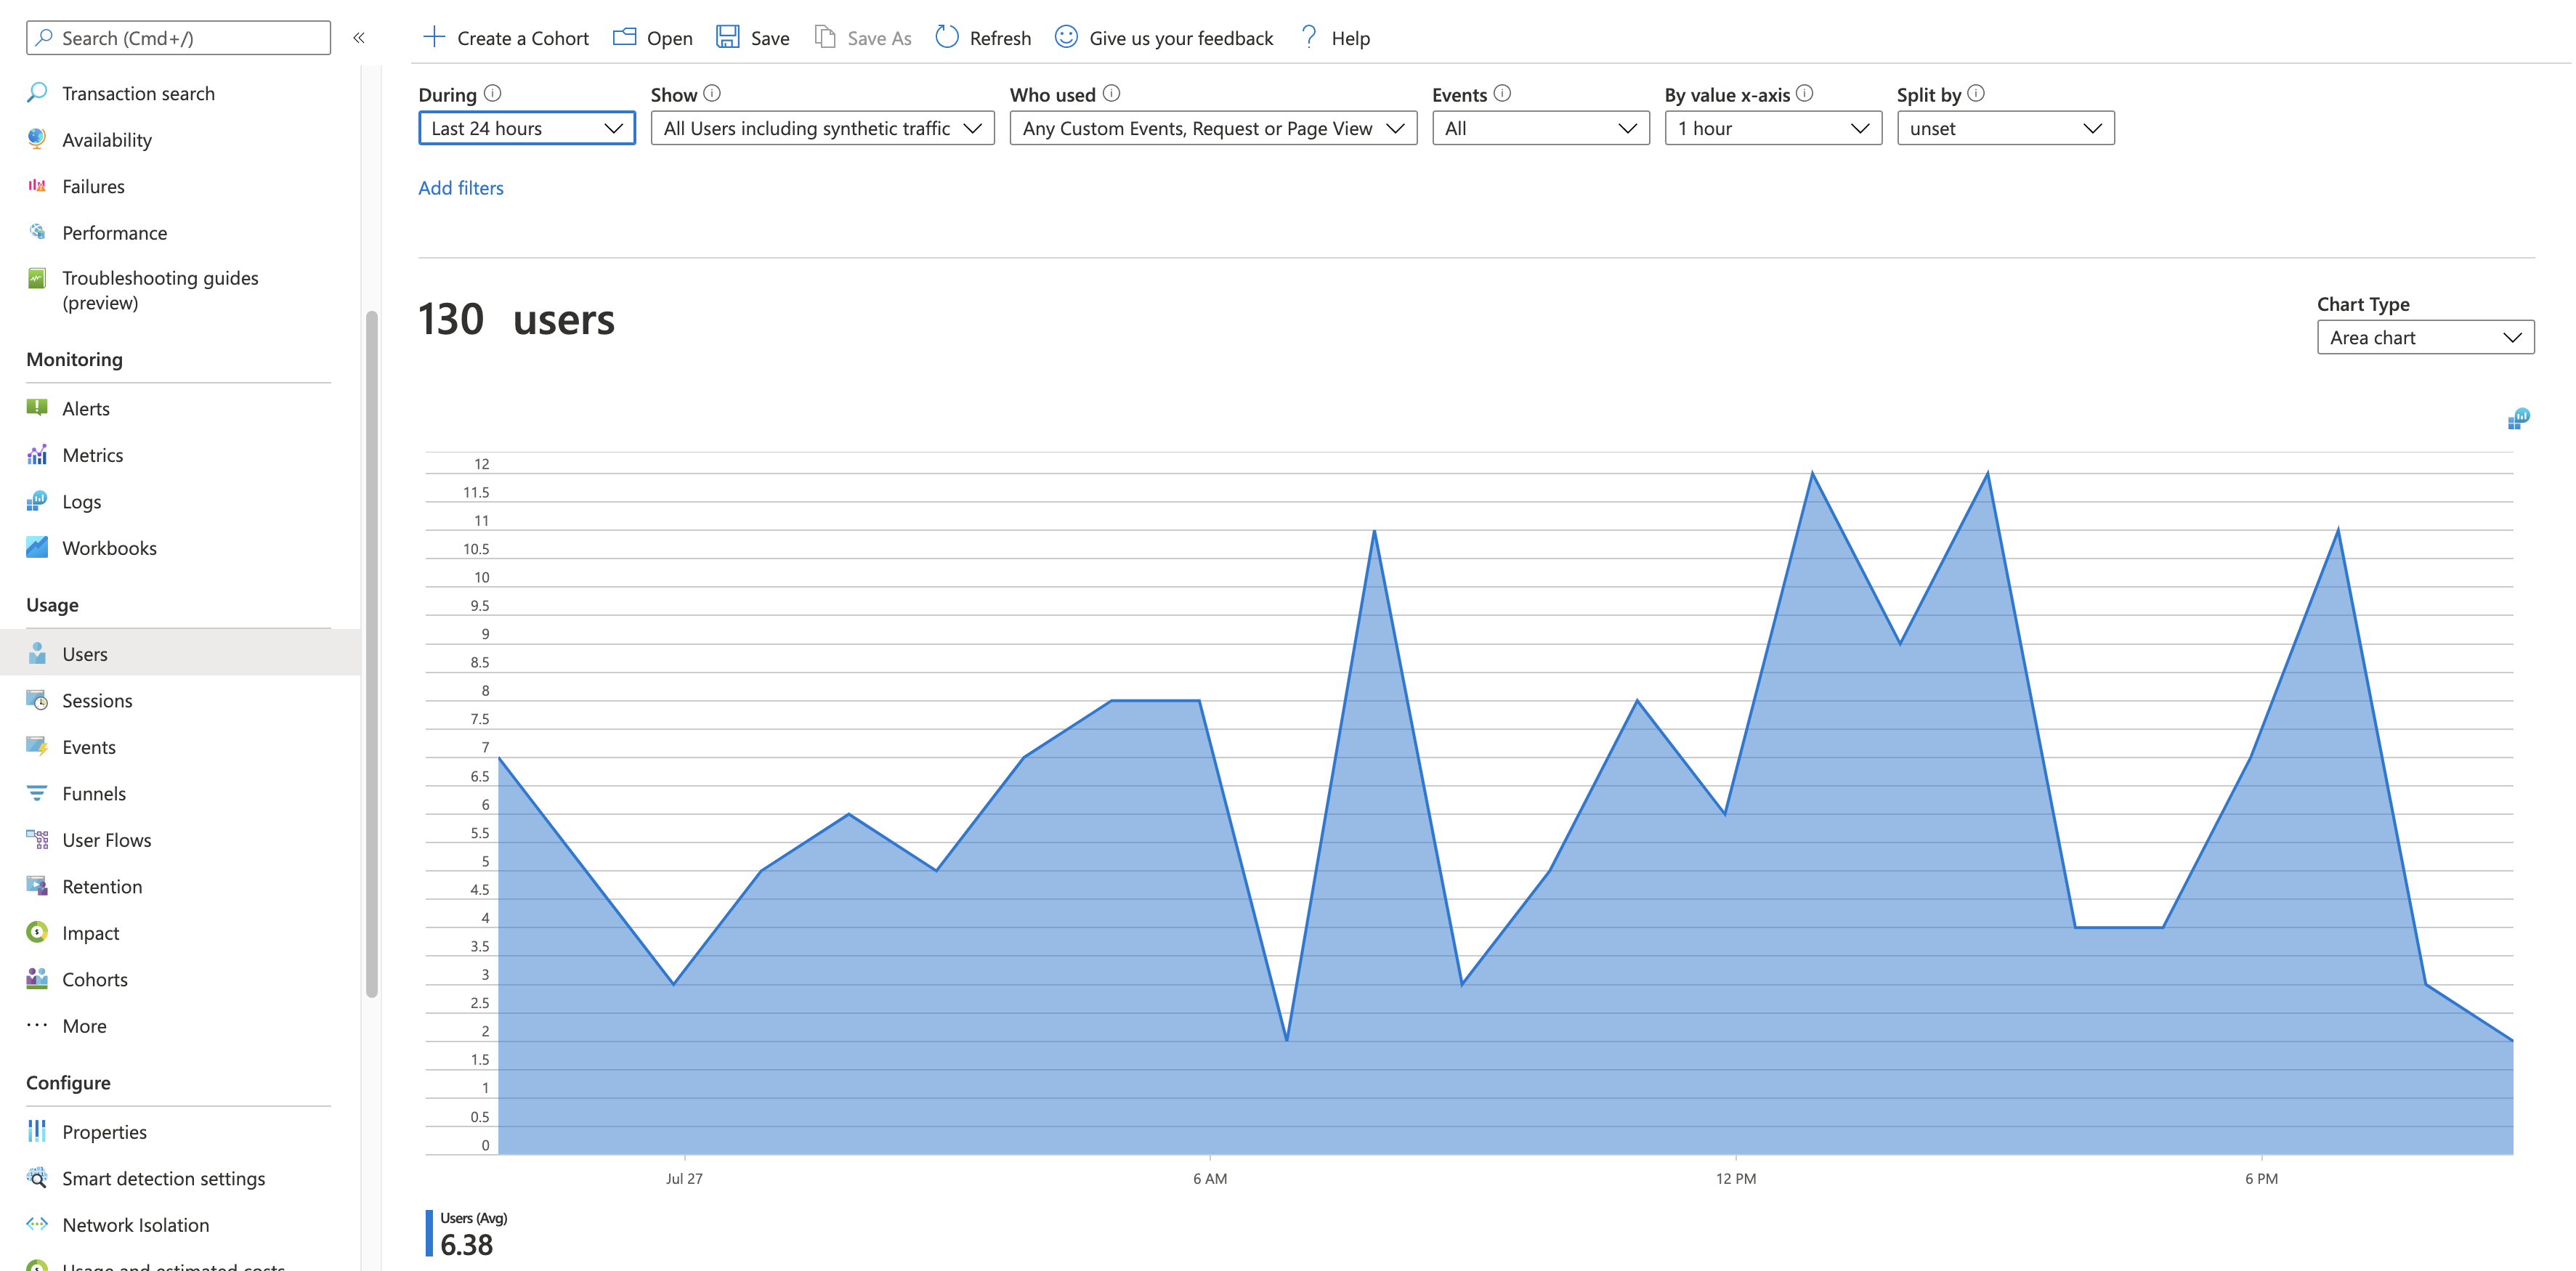
Three of the Usage panes use the same tool to slice and dice telemetry from your web app from three perspectives. By filtering and splitting the data, you can uncover insights about the relative use of different pages and features.
Users tool: How many people used your app and its features? Users are counted by using anonymous IDs stored in browser cookies. A single person using different browsers or machines will be counted as more than one user.
Sessions tool: How many sessions of user activity have included certain pages and features of your app? A session is reset after half an hour of user inactivity, or after 24 hours of continuous use.
Events tool: How often are certain pages and features of your app used? A page view is counted when a browser loads a page from your app, provided you've instrumented it.
A custom event represents one occurrence of something happening in your app. It's often a user interaction like a button selection or the completion of a task. You insert code in your app to generate custom events or use the Click Analytics extension.
Note
For information on an alternatives to using anonymous IDs and ensuring an accurate count, see the documentation for authenticated IDs.
Clicking View More Insights displays the following information:
- Application Performance: Sessions, Events, and a Performance evaluation related to users' perception of responsiveness.
- Properties: Charts containing up to six user properties such as browser version, country or region, and operating system.
- Meet Your Users: View timelines of user activity.
Query for certain users
Explore different groups of users by adjusting the query options at the top of the Users tool:
- During: Choose a time range.
- Show: Choose a cohort of users to analyze.
- Who used: Choose custom events, requests, and page views.
- Events: Choose multiple events, requests, and page views that will show users who did at least one, not necessarily all, of the selected options.
- By value x-axis: Choose how to categorize the data, either by time range or by another property, such as browser or city.
- Split By: Choose a property to use to split or segment the data.
- Add Filters: Limit the query to certain users, sessions, or events based on their properties, such as browser or city.
Meet your users
The Meet your users section shows information about five sample users matched by the current query. Exploring the behaviors of individuals and in aggregate can provide insights about how people use your app.
Next steps
- To enable usage experiences, start sending custom events or page views.
- If you already send custom events or page views, explore the Usage tools to learn how users use your service.
Feedback
Coming soon: Throughout 2024 we will be phasing out GitHub Issues as the feedback mechanism for content and replacing it with a new feedback system. For more information see: https://aka.ms/ContentUserFeedback.
Submit and view feedback for
