Collecting Event Tracing for Windows (ETW) Events for analysis Azure Monitor Logs
Event Tracing for Windows (ETW) provides a mechanism for instrumentation of user-mode applications and kernel-mode drivers. The Log Analytics agent is used to collect Windows events written to the Administrative and Operational ETW channels. However, it is occasionally necessary to capture and analyze other events, such as those written to the Analytic channel.
Important
The legacy Log Analytics agent will be deprecated by August 2024. After this date, Microsoft will no longer provide any support for the Log Analytics agent. Migrate to Azure Monitor agent before August 2024 to continue ingesting data.
Event flow
To successfully collect manifest-based ETW events for analysis in Azure Monitor Logs, you must use the Azure diagnostics extension for Windows (WAD). In this scenario, the diagnostics extension acts as the ETW consumer, writing events to Azure Storage (tables) as an intermediate store. Here it will be stored in a table named WADETWEventTable. Log Analytics then collects the table data from Azure storage, presenting it as a table named ETWEvent.

Configuring ETW Log collection
Step 1: Locate the correct ETW provider
Use either of the following commands to enumerate the ETW providers on a source Windows System.
Command line:
logman query providers
PowerShell:
Get-NetEventProvider -ShowInstalled | Select-Object Name, Guid
Optionally, you may choose to pipe this PowerShell output to Out-Gridview to aid navigation.
Record the ETW provider name and GUID that aligns to the Analytic or Debug log that is presented in the Event Viewer, or to the module you intend to collect event data for.
Step 2: Diagnostics extension
Ensure the Windows diagnostics extension is installed on all source systems.
Step 3: Configure ETW log collection
From the pane on the left, navigate to the Diagnostic Settings for the virtual machine
Select the Logs tab.
Scroll down and enable the Event tracing for Windows (ETW) events option
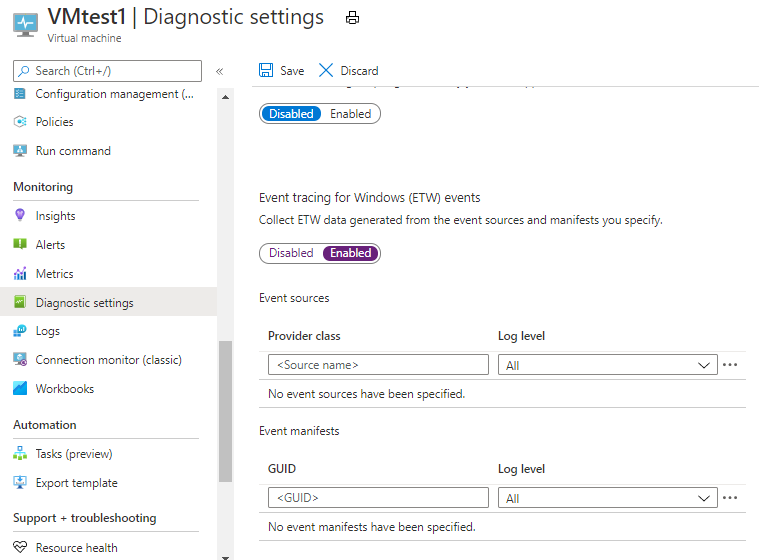
Set the provider GUID or provider class based on the provider you are configuring collection for
Set the Log Level as appropriate
Click the ellipsis adjacent to the supplied provider, and click Configure
Ensure the Default destination table is set to etweventtable
Set a Keyword filter if required
Save the provider and log settings

Once matching events are generated, you should start to see the ETW events appearing in the WADetweventtable table in Azure Storage. You can use Azure Storage Explorer to confirm this.
Step 4: Configure Log Analytics storage account collection
Follow these instructions to collect the logs from Azure Storage. Once configured, the ETW event data should appear in Log Analytics under the ETWEvent table.
Next steps
- Use custom fields to create structure in your ETW events
- Learn about log queries to analyze the data collected from data sources and solutions.
Feedback
Coming soon: Throughout 2024 we will be phasing out GitHub Issues as the feedback mechanism for content and replacing it with a new feedback system. For more information see: https://aka.ms/ContentUserFeedback.
Submit and view feedback for