Oracle database performance on Azure NetApp Files multiple volumes
Migrating highly performant Exadata grade databases to the cloud is increasingly becoming an imperative for Microsoft customers. Supply chain software suites typically set the bar high due to the intense demands on storage I/O with a mixed read and write workload driven by a single compute node. Azure infrastructure in combination with Azure NetApp Files is able to meet the needs of this highly demanding workload. This article presents an example of how this demand was met for one customer and how Azure can meet the demands of your critical Oracle workloads.
Enterprise scale Oracle performance
When exploring the upper limits of performance, it's important to recognize and reduce any constraints that could falsely skew results. For example, if the intent is to prove performance capabilities of a storage system, the client should ideally be configured so that CPU does not become a mitigating factor before storage performance limits are reached. To that end, testing started with the E104ids_v5 instance type as this VM comes equipped not just with a 100 Gbps network interface, but with an equally large (100 Gbps) egress limit.
The testing occurred in two phases:
- The first phase focused on testing using Kevin Closson’s now industry standard SLOB2 (Silly Little Oracle Benchmark) tool - version 2.5.4. The goal being to drive as much Oracle I/O as possible from one virtual machine (VM) to multiple Azure NetApp Files volumes, and then scale out using more databases to demonstrate linear scaling.
- After testing scaling limits, our testing pivoted to the less expensive but almost as capable E96ds_v5 for a customer phase of testing using a true Supply Chain application workload and real-world data.
SLOB2 scale-up performance
The following charts capture the performance profile of a single E104ids_v5 Azure VM running a single Oracle 19c database against eight Azure NetApp Files volumes with eight storage endpoints. The volumes are spread across three ASM disk groups: data, log, and archive. Five volumes were allocated to the data disk group, two volumes to the log disk group, and one volume to the archive disk group. All results captured throughout this article were collected using production Azure regions and active production Azure services.
Single-host architecture
The following diagram depicts the architecture that testing was completed against; note the Oracle database spread across multiple Azure NetApp Files volumes and endpoints.

Single-host storage IO
The following diagram shows a 100% randomly selected workload with a database buffer hit ratio of about 8%. SLOB2 was able to drive approximately 850,000 I/O requests per second while maintaining a submillisecond DB file sequential read event latency. With a database block size of 8K that amounts to approximately 6,800 MiB/s of storage throughput.

Single-host throughput
The following diagram demonstrates that, for bandwidth intensive sequential IO workloads such as full table scans or RMAN activities, Azure NetApp Files can deliver the full bandwidth capabilities of the E104ids_v5 VM itself.

Note
As the compute instance is at the theoretical maximum of its bandwidth, adding additional application concurrency results only in increased client-side latency. This results in SLOB2 workloads exceeding the targeted completion timeframe therefore thread count was capped at six.
SLOB2 scale-out performance
The following charts capture the performance profile of three E104ids_v5 Azure VMs each running a single Oracle 19c database and each with their own set of Azure NetApp Files volumes and an identical ASM disk group layout as described in the Scale up performance section. The graphics show that with Azure NetApp Files multi-volume/multi-endpoint, performance easily scales out with consistency and predictability.
Multi-host architecture
The following diagram depicts the architecture that testing was completed against; note the three Oracle databases spread across multiple Azure NetApp Files volumes and endpoints. Endpoints can be dedicated to a single host as shown with Oracle VM 1 or shared among hosts as shown with Oracle VM2 and Oracle VM 3.

Multi-host storage IO
The following diagram shows a 100% randomly selected workload with a database buffer hit ratio of about 8%. SLOB2 was able to drive approximately 850,000 I/O requests per second across all three hosts individually. SLOB2 was able accomplish this while executing in parallel to a collective total of about 2,500,000 I/O requests per second with each host still maintaining a submillisecond db file sequential read event latency. With a database block size of 8K, this amounts to approximately 20,000 MiB/s between the three hosts.

Multi-host throughput
The following diagram demonstrates that for sequential workloads, Azure NetApp Files can still deliver the full bandwidth capabilities of the E104ids_v5 VM itself even as it scales outward. SLOB2 was able to drive I/O totaling over 30,000 MiB/s across the three hosts while running in parallel.

Real-world performance
After scaling limits were tested with SLOB2, tests were conducted with a real-word supply chain application suite against Oracle on Azure NetApp files with excellent results. The following data from Oracle Automatic Workload Repository (AWR) report is a highlighted look at how one specific critical job performed.
This database has significant extra IO going on in addition to the application workload due to flashback being enabled and has a database block size of 16k. From the IO profile section of the AWR report, it's apparent that there is a heavy ratio of writes in comparison to reads.
| - | Read and write per second | Read per second | Write per second |
|---|---|---|---|
| Total (MB) | 4,988.1 | 1,395.2 | 3,592.9 |
Despite the db file sequential read wait event showing a higher latency at 2.2 ms than in the SLOB2 testing, this customer saw a fifteen-minute reduction in job execution time coming from a RAC database on Exadata to a single instance database in Azure.
Azure resource constraints
All systems eventually hit resource constraints, traditionally known as chokepoints. Database workloads, especially highly demanding ones such as supply chain application suites, are resource intensive entities. Finding these resource constraints and working through them is vital to any successful deployment. This section illuminates various constraints you may expect to encounter in just such an environment and how to work through them. In each subsection, expect to learn both best practices and rationale behind them.
Virtual machines
This section details the criteria to be considered in selecting VMs for best performance and the rationale behind selections made for testing. Azure NetApp Files is a Network Attached Storage (NAS) service, therefore appropriate network bandwidth sizing is critical for optimal performance.
Chipsets
The first topic of interest is chipset selection. Make sure that whatever VM SKU you select is built on a single chipset for consistency reasons. The Intel variant of E_v5 VMs runs on a third Generation Intel Xeon Platinum 8370C (Ice Lake) configuration. All VMs in this family come equipped with a single 100 Gbps network interface. In contrast, the E_v3 series, mentioned by way of example, is built on four separate chipsets, with various physical network bandwidths. The four chipsets used in the E_v3 family (Broadwell, Skylake, Cascade Lake, Haswell) have different processor speeds, which affect the performance characteristics of the machine.
Read the Azure Compute documentation carefully paying attention to chipset options. Also refer to Azure VM SKUs best practices for Azure NetApp Files. Selecting a VM with a single chipset is preferable for best consistency.
Available network bandwidth
It's important to understand the difference between the available bandwidth of the VM network interface and the metered bandwidth applied against the same. When Azure Compute documentation speaks to network bandwidth limits, these limits are applied on egress (write) only. Ingress (read) traffic is not metered and as such is limited only by the physical bandwidth of the NIC itself. The network bandwidth of most VMs outpaces the egress limit applied against the machine.
As Azure NetApp Files volumes are network attached, the egress limit can be understood as being applied against writes specifically whereas ingress is defined as reads and read-like workloads. While the egress limit of most machines is greater than the network bandwidth of the NIC, the same cannot be said for the E104_v5 used in testing for this article. The E104_v5 has a 100 Gbps NIC with the egress limit set at 100 Gbps as well. By comparison, the E96_v5, with its 100 Gbps NIC has an egress limit of 35 Gbps with ingress unfettered at 100 Gbps. As VMs decrease in size, egress limits decrease but ingress remains unfettered by logically imposed limits.
Egress limits are VM-wide and are applied as such against all network-based workloads. When using Oracle Data Guard, all writes are doubled to archive logs and must be factored to egress limit considerations. This is also true for archive log with multi-destination and RMAN, if used. When selecting VMs, familiarize yourselves with such command line tools as ethtool, which expose the configuration of the NIC as Azure does not document network interface configurations.
Network concurrency
Azure VMs and Azure NetApp Files volumes come equipped with specific amounts of bandwidth. As shown earlier, so long as a VM has sufficient CPU headroom, a workload can in theory consume the bandwidth made available to it--that is within the limits of the network card and or egress limit applied. In practice however, the amount of throughput achievable is predicated upon the concurrency of the workload at the network, that is the number of network flows and network endpoints.
Read the network flow limits section of the VM network bandwidth document for greater understanding of. The takeaway: the more network flows connecting client to storage the richer the potential performance.
Oracle supports two separate NFS clients, Kernel NFS and Direct NFS (dNFS). Kernel NFS, until late, supported a single network flow between two endpoints (compute – storage). Direct NFS, the more performant of the two, supports a variable number of network flows – tests have shown hundreds of unique connections per endpoint - increasing or decreasing as load demands. Due to the scaling of network flows between two endpoints, Direct NFS is far preferred over Kernel NFS, and as such, the recommended configuration. Azure NetApp Files product group does not recommend using Kernel NFS with Oracle workloads. For more information, refer to the Benefits of using Azure NetApp Files with Oracle Database.
Execution concurrency
Utilizing Direct NFS, a single chipset for consistency, and understanding network bandwidth constraints only takes you so far. In the end, the application drives performance. Proofs of concept using SLOB2 and proofs of concept using a real-world supply chain application suite against real customer data were able to drive significant amounts of throughput only because the applications ran at high degrees of concurrency; the former using a significant number of threads per schema, the latter using multiple connections from multiple application servers. In short, concurrency drives workload, low concurrency--low throughput, high concurrency--high throughput so long as the infrastructure is in place to support the same.
Accelerated networking
Accelerated networking enables single root I/O virtualization (SR-IOV) to a VM, greatly improving its networking performance. This high-performance path bypasses the host from the data path, which reduces latency, jitter, and CPU utilization for the most demanding network workloads on supported VM types. When deploying VMs through configuration management utilities such as terraform or command line, be aware that accelerated networking is not enabled by default. For optimal performance, enable accelerated networking. Take note, accelerated networking is enabled or disabled on a network interface by network interface basis. The accelerated networking feature is one that may be enabled or disabled dynamically.
Note
This article contains references to the term SLAVE, a term that Microsoft no longer uses. When the term is removed from the software, we’ll remove it from this article.
An authoritative approach to ensuing accelerated networking is enabled for a NIC is via the Linux terminal. If accelerated networking is enabled for a NIC, a second virtual NIC is present associated with the first NIC. This second NIC is configured by the system with the SLAVE flag enabled. If no NIC is present with the SLAVE flag, accelerated networking is not enabled for that interface.
In the scenario where multiple NICs are configured, you need to determine which SLAVE interface is associated with the NIC used to mount the NFS volume. Adding network interface cards to the VM has no effect on performance.
Use the following process to identify the mapping between configured network interface and its associated virtual interface. This process validates that accelerated networking is enabled for a specific NIC on your Linux machine and display the physical ingress speed the NIC can potentially achieve.
- Execute the
ip acommand: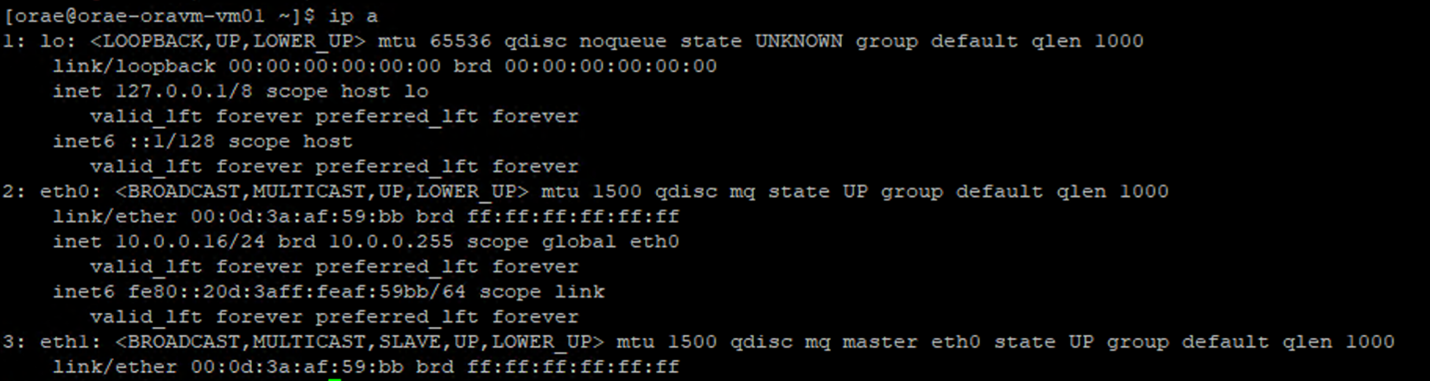
- List the
/sys/class/net/directory of the NIC ID you are verifying (eth0in the example) andgrepfor the word lower:ls /sys/class/net/eth0 | grep lower lower_eth1 - Execute the
ethtoolcommand against the ethernet device identified as the lower device in the previous step.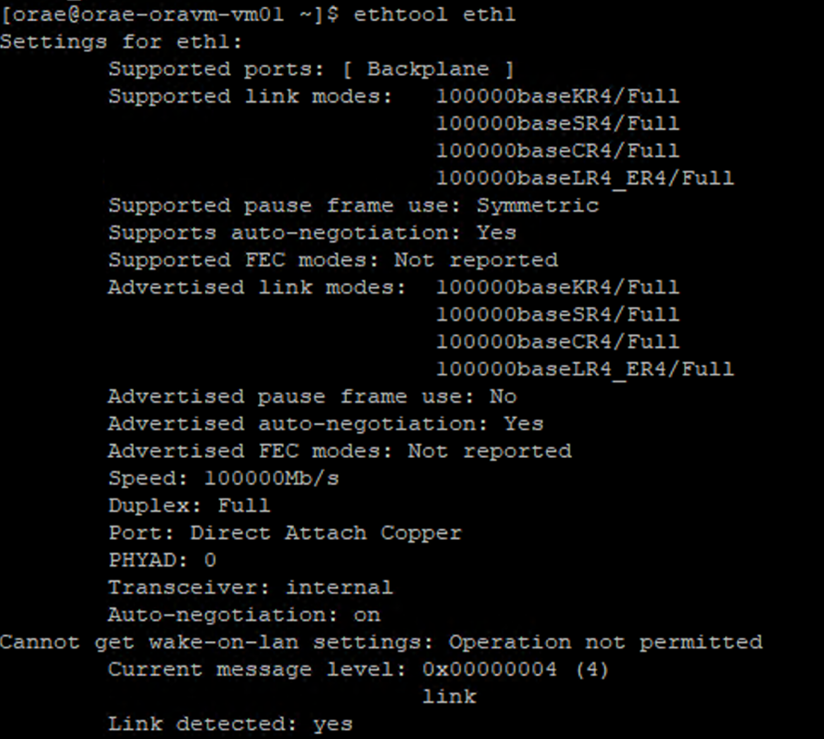
Azure VM: Network vs. disk bandwidth limits
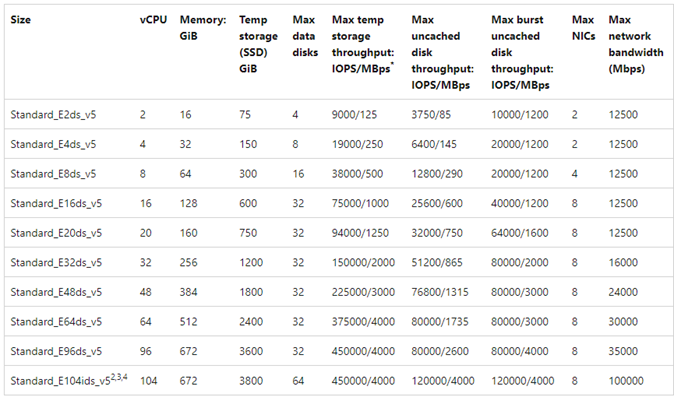
A level of expertise is required when reading Azure VM performance limits documentation. Be aware of:
- Temp storage throughput and IOPS numbers refer to the performance capabilities of the ephemeral on-box storage directly attached to the VM.
- Uncached disk throughput and I/O numbers refer specifically to Azure Disk (Premium, Premium v2, and Ultra) and have no bearing on network attached storage such as Azure NetApp Files.
- Attaching additional NICs to the VM has no impact on performance limits or performance capabilities of the VM (documented and tested to be true).
- Maximum network bandwidth refers to egress limits (that is, writes when Azure NetApp Files is involved) applied against the VM network bandwidth. No ingress limits (that is, reads when Azure NetApp Files is involved) are applied. Given enough CPU, enough network concurrency, and rich enough endpoints a VM could theoretically drive ingress traffic to the limits of the NIC. As mentioned in the Available network bandwidth section, use tools such
ethtoolto see the bandwidth of the NIC.
A sample chart is shown for reference:
Azure NetApp Files
The Azure first-party storage service Azure NetApp Files provides a highly available fully managed storage solution capable of supporting the demanding Oracle workloads introduced earlier.
As the limits of scale-up storage performance in an Oracle database are well understood, this article intentionally focuses on scale-out storage performance. Scaling out storage performance implies giving a single Oracle instance access to many Azure NetApp Files volumes where these volumes are distributed over multiple storage endpoints.
By scaling a database workload across multiple volumes in such a way, the performance of the database is untethered from both volume and endpoint upper limits. With the storage no longer imposing performance limitations, the VM architecture (CPU, NIC, and VM egress limits) becomes the chokepoint to contend with. As noted in the VM section, selection of the E104ids_v5 and E96ds_v5 instances were made keeping this in mind.
Whether a database is placed on a single large capacity volume or spread across multiple smaller volumes, the total financial cost is the same. The advantage of distributing I/O across multiple volumes and endpoint in contrast to a single volume and endpoint is the avoidance of bandwidth limits--you get to use entirely what you pay for.
Important
To deploy using Azure NetApp Files in a multiple volume:multiple endpoint configuration, reach out to your Azure NetApp Files Specialist or Cloud Solution Architect for assistance.
Database
Oracle’s database version 19c is Oracle’s current long term release version and the one used to produce all test results discussed in this paper.
For best performance, all database volumes were mounted using the Direct NFS, Kernel NFS is recommended against due to performance constraints. For a performance comparison between the two clients, refer to Oracle database performance on Azure NetApp Files single volumes. Note, all relevant dNFS patches (Oracle Support ID 1495104) were applied, as were the best practices outlined in the Oracle Databases on Microsoft Azure using Azure NetApp Files report.
While Oracle and Azure NetApp Files support both NFSv3 and NFSv4.1, as NFSv3 is the more mature protocol it's generally viewed as having the most stability and is the more reliable option for environments that are highly sensitive to disruption. The testing described in this article was all completed over NFSv3.
Important
Some of the recommended patches that Oracle documents in Support ID 1495104 are critical for maintaining data integrity when using dNFS. Application of such patches is strongly advised for production environments.
Automatic Storage Management (ASM) is supported for NFS volumes. Though typically associated with block-based storage where ASM replaces logical volume management (LVM) and filesystem both, ASM plays a valuable role in multi-volume NFS scenarios and is worthy of strong consideration. One such advantage of ASM, dynamic online addition of and rebalance across newly added NFS volumes and endpoints, simplifies management allowing for expansion of both performance and capacity at will. Though ASM does not in and of itself increase the performance of a database, its use avoids hot files and the need to manually maintain file distribution--a benefit easy to see.
An ASM over dNFS configuration was used to produce all test results discussed in this article. The following diagram illustrates the ASM file layout within the Azure NetApp Files volumes and the file allocation to the ASM disk groups.

There are some limitations with the use of ASM over Azure NetApp Files NFS mounted volumes when it comes to storage snapshots that can be overcome with certain architectural considerations. Contact your Azure NetApp Files specialist or cloud solutions architect for an in-depth review of these considerations.
Synthetic test tools and tunables
This section describes the test architecture, tunables, and configuration detail in specifics. While the previous section is focused reasons why configuration decisions are made, this section focuses specifically on the "what" of configuration decisions.
Automated deployment
- The database VMs are deployed using bash scripts available on GitHub.
- The layout and allocation of multiple Azure NetApp Files volumes and endpoints are completed manually. You need to work with your Azure NetApp Files Specialist or Cloud Solution Architect for assistance.
- The grid installation, ASM configuration, database creation and configuration, and SLOB2 environment on each machine is configured using Ansible for consistency.
- Parallel SLOB2 test executions across multiple hosts are also completed using Ansible for consistency and simultaneous execution.
VM configuration
| Configuration | Value |
|---|---|
| Azure region | West Europe |
| VM SKU | E104ids_v5 |
| NIC count | 1 NOTE: Adding vNICs has no effect on system count |
| Max egress networking bandwidth (Mbps) | 100,000 |
| Temp storage (SSD) GiB | 3,800 |
System configuration
All Oracle required system configuration settings for version 19c were implemented according to Oracle documentation.
The following parameters were added to the /etc/sysctl.conf Linux system file:
sunrpc.max_tcp_slot_table_entries: 128sunrpc.tcp_slot_table_entries = 128
Azure NetApp Files
All Azure NetApp Files volumes were mounted with the following NFS mount options.
nfs rw,hard,rsize=262144,wsize=262144,sec=sys,vers=3,tcp
Database parameters
| Parameters | Value |
|---|---|
db_cache_size |
2g |
large_pool_size |
2g |
pga_aggregate_target |
3g |
pga_aggregate_limit |
3g |
sga_target |
25g |
shared_io_pool_size |
500m |
shared_pool_size |
5g |
db_files |
500 |
filesystemio_options |
SETALL |
job_queue_processes |
0 |
db_flash_cache_size |
0 |
_cursor_obsolete_threshold |
130 |
_db_block_prefetch_limit |
0 |
_db_block_prefetch_quota |
0 |
_db_file_noncontig_mblock_read_count |
0 |
SLOB2 configuration
All workload generation for testing was completed using the SLOB2 tool version 2.5.4.
Fourteen SLOB2 schemas were loaded into a standard Oracle tablespace and executed against, which in combination with the slob configuration file settings listed, put the SLOB2 data set at 7 TiB. The following settings reflect a random read execution for SLOB2. The configuration parameter SCAN_PCT=0 was changed to SCAN_PCT=100 during sequential testing.
UPDATE_PCT=0SCAN_PCT=0RUN_TIME=600SCALE=450GSCAN_TABLE_SZ=50GWORK_UNIT=32REDO_STRESS=LITETHREADS_PER_SCHEMA=1DATABASE_STATISTICS_TYPE=awr
For random read testing, nine SLOB2 executions were performed. The thread count was increased by six with each test iteration starting from one.
For sequential testing, seven SLOB2 executions were performed. The thread count was increased by two with each test iteration starting from one. The thread count was capped at six due to reaching network bandwidth maximum limits.
AWR metrics
All performance metrics were reported through the Oracle Automatic Workload Repository (AWR). The following are the metrics presented in the results:
- Throughput: the sum of the average read throughput and write throughput from the AWR Load Profile section
- Average read IO requests from the AWR Load Profile section
- db file sequential read wait event average wait time from the AWR Foreground Wait Events section
Migrating from purpose-built, engineered systems to the cloud
Oracle Exadata is an engineered system--a combination of hardware and software that is considered the most optimized solution for running Oracle workloads. Although the cloud has significant advantages in the overall scheme of the technical world, these specialized systems can look incredibly attractive to those who have read and viewed the optimizations Oracle has built around their particular workload(s).
When it comes to running Oracle on Exadata, there are some common reasons Exadata is chosen:
- 1-2 high IO workloads that are natural fit for Exadata features and as these workloads require significant Exadata engineered features, the rest of the databases running along with them were consolidated to the Exadata.
- Complicated or difficult OLTP workloads that require RAC to scale and are difficult to architect with proprietary hardware without deep knowledge of Oracle optimization or may be technical debt unable to be optimized.
- Under-utilized existing Exadata with various workloads: this exists either due to previous migrations, end-of-life on a previous Exadata, or due to a desire to work/test an Exadata in-house.
It's essential for any migration from an Exadata system to be understood from the perspective of the workloads and how simple or complex the migration may be. A secondary need is to understand the reason for the Exadata purchase from a status perspective. Exadata and RAC skills are in higher demand and may have driven the recommendation to purchase one by the technical stakeholders.
Important
No matter the scenario, the overall take-away should be, for any database workload coming from an Exadata, the more Exadata proprietary features used, the more complex the migration and planning is. Environments that are not heavily utilizing Exadata proprietary features have opportunities for a simpler migration and planning process.
There are several tools that can be used to assess these workload opportunities:
- The Automatic Workload Repository (AWR):
- All Exadata databases are licensed to use AWR reports and connected performance and diagnostic features.
- Is always on and collects data that can be used to view historical workload information and assess usage. Peak values can assess the high usage on the system,
- Larger window AWR reports can assess the overall workload, providing valuable insight into feature usage and how to migrate the workload to non-Exadata effectively. Peak AWR reports in contrast are best for performance optimization and troubleshooting.
- The Global (RAC-Aware) AWR report for Exadata also includes an Exadata specific section, which drills down into specific Exadata feature usage and provides valuable insight info flash cache, flash logging, IO and other feature usage by database and cell node.
Decoupling from Exadata
When identifying Oracle Exadata workloads to migrate to the cloud, consider the following questions and data points:
- Is the workload consuming multiple Exadata features, outside of hardware benefits?
- Smart scans
- Storage indices
- Flash cache
- Flash logging
- Hybrid columnar compression
- Is the workload using Exadata offloading efficiently? In the top time foreground events, what is the ratio (more than 10% of DB time) of workload using:
- Cell smart table scan (optimal)
- Cell multiblock physical read (less optimal)
- Cell single block physical read (least optimal)
- Hybrid Columnar Compression (HCC/EHCC): What is the compressed vs. uncompressed ratios:
- Is the database spending over 10% of database time on compressing and decompressing data?
- Inspect the performance gains for predicates using the compression in queries: is the value gained worth it versus the amount saved with compression?
- Cell physical IO: Inspect the savings provided from:
- the amount directed to the DB node to balance CPU.
- identifying the number of bytes returned by smart scan. These values can be subtracted in IO for the percentage of cell single block physical reads once it migrates off Exadata.
- Note the number of logical reads from cache. Determine if flash cache will be required in a cloud IaaS solution for the workload.
- Compare the physical read and write total bytes to the amount performed total in cache. Can memory be raised to eliminate physical read requirements (it's common for some to shrink down SGA to force offloading for Exadata)?
- In System Statistics, identify what objects are impacted by what statistic. If tuning SQL, further indexing, partitioning, or other physical tuning may optimize the workload dramatically.
- Inspect Initialization Parameters for underscore (_) or deprecated parameters, which should be justified due to database level impact they may be causing on performance.
Exadata server configuration
In Oracle version 12.2 and above, an Exadata specific addition will be included in the AWR global report. This report has sections that provide exceptional value to a migration from Exadata.
Exadata version and system details
Cell node alerts detail
Exadata nononline disks
Outlier data for any Exadata OS statistics
Yellow/Pink: Of concern. Exadata is not running optimally.
Red: Exadata performance is impacted significantly.
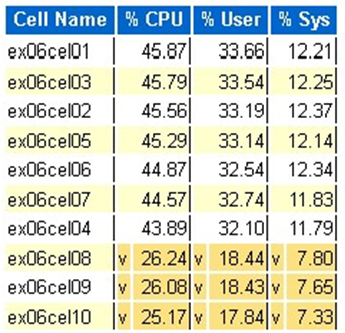
Exadata OS CPU statistic: top cells
- These statistics are collected by the OS on the cells and are not restricted to this database or instances
- A
vand a dark yellow background indicate an outlier value below the low range - A
^and a light yellow background indicate an outlier value above the high range - The top cells by percentage CPU are display and are in descending order of percentage CPU
- Average: 39.34% CPU, 28.57% user, 10.77% sys
Single cell physical block reads
Flash cache usage
Temp IO
Columnar cache efficiency
Top database by IO throughput
Although sizing assessments can be performed, there are some questions about the averages and the simulated peaks that are built into these values for large workloads. This section, found at the end of an AWR report, is exceptionally valuable as it shows both the average flash and disk usage of the top 10 databases on Exadata. Although many may assume they want to size databases for peak performance in the cloud, this doesn’t make sense for most deployments (over 95% is in the average range; with a simulated peak calculated in, the average range be greater than 98%). It's important to pay for what is needed, even for the highest of Oracle’s demand workloads and inspecting the Top Databases by IO Throughput can be enlightening for understanding the resource needs for the database.
Right-size Oracle using the AWR on Exadata
When performing capacity planning for on-premises systems, it’s only natural to have significant overhead built into the hardware. The over-provisioned hardware needs to serve the Oracle workload for several years to come, no matter the workload additions due to data growth, code changes, or upgrades.
One of the benefits of the cloud is scaling resources in a VM host and storage can be performed as demands increase. This helps conserve cloud costs and licensing costs that are attached to processor usage (pertinent with Oracle).
Right-sizing involves removing the hardware from the traditional lift and shift migration and using the workload information provided by Oracle’s Automatic Workload Repository (AWR) to lift and shift the workload to compute and storage that is specially designed to support it in the cloud of the customer’s choice. The right-sizing process ensures that the architecture going forward removes infrastructure technical debt, architecture redundancy that would occur if duplication of the on-premises system was replicated to the cloud and implements cloud services whenever possible.
Microsoft Oracle subject matter experts have estimated that more than 80% of Oracle databases are over-provisioned and experience either the same cost or savings going to the cloud if they take the time to right-size the Oracle database workload before migrating to the cloud. This assessment requires the database specialists on the team to shift their mindset on how they may have performed capacity planning in the past, but it's worth the stakeholder's investment in the cloud and the business’s cloud strategy.
Next steps
- Run Your Most Demanding Oracle Workloads in Azure without Sacrificing Performance or Scalability
- Solution architectures using Azure NetApp Files - Oracle
- Design and implement an Oracle database in Azure
- Estimate Tool for Sizing Oracle Workloads to Azure IaaS VMs
- Reference architectures for Oracle Database Enterprise Edition on Azure
- Understand Azure NetApp Files application volumes groups for SAP HANA
Feedback
Coming soon: Throughout 2024 we will be phasing out GitHub Issues as the feedback mechanism for content and replacing it with a new feedback system. For more information see: https://aka.ms/ContentUserFeedback.
Submit and view feedback for