Configure VMware syslogs for Azure VMware Solution
Diagnostic settings are used to configure streaming export of platform logs and metrics for a resource to the destination of your choice. You can create up to five different diagnostic settings to send different logs and metrics to independent destinations.
In this article, learn how to configure a diagnostic setting to collect VMware syslogs for your Azure VMware Solution private cloud. Then, learn how to store the syslog to a storage account to view the vCenter Server logs and analyze for diagnostic purposes.
Important
The VMware syslogs contains the following logs:
- vCenter Server logs
- ESXi logs
- vSAN logs
- NSX-T Manager logs
- NSX-T Data Center Distributed Firewall logs
- NSX-T Data Center Gateway Firewall logs
- NSX-T Data Center Edge Appliance logs
Prerequisites
Make sure you have an Azure VMware Solution private cloud with access to the vCenter Server and NSX-T Manager interfaces.
Configure diagnostic settings
- From your Azure VMware Solution private cloud, select Diagnostic settings, then Add diagnostic settings.

- Select the vmwaresyslog, All metrics, and select one of the following options presented.
Send to Log Analytics workspace
How to set up Log Analytics
A Log Analytics workspace:
Contains your Azure VMware Solution private cloud logs.
Is the workspace from which you can take desired actions, such as querying for logs.
In this section, you’ll:
Configure a Log Analytics workspace
Create a diagnostic setting in your private cloud to send your logs to this workspace
Create a resource
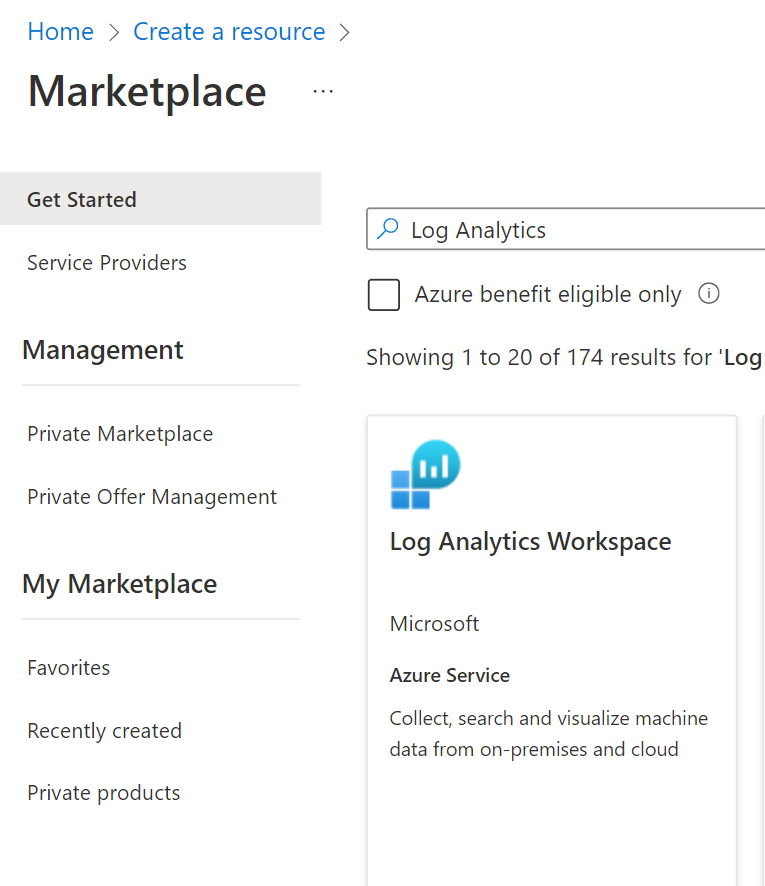
- In the Azure portal, go to Create a resource.
- Search for “Log Analytics Workspace” and select Create -> Log Analytics Workspace.
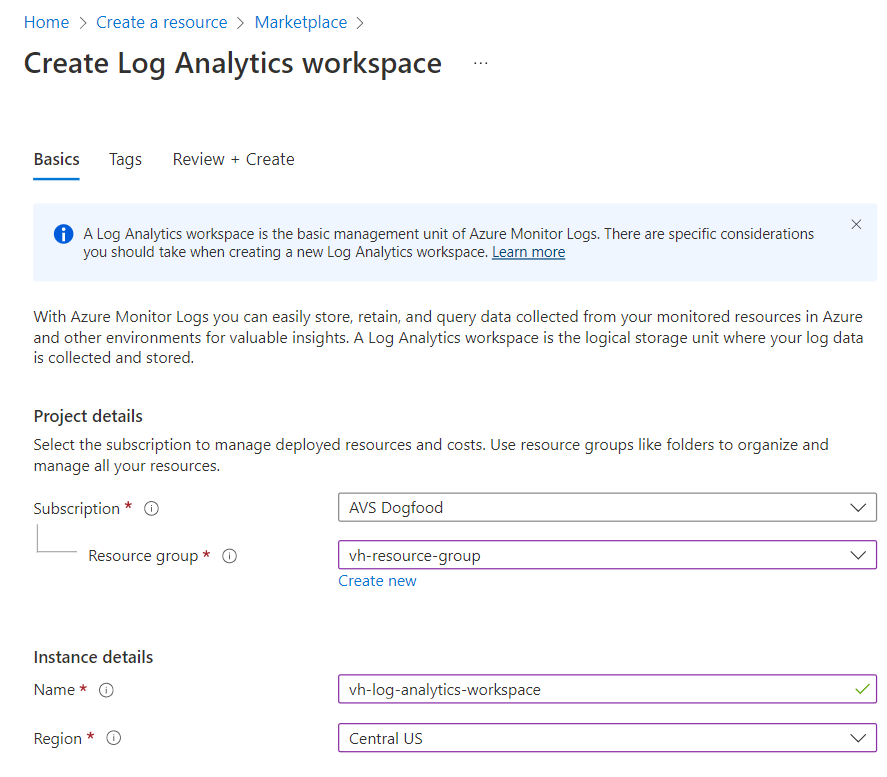
Set up your workspace
- Enter the Subscription you intend to use, the Resource Group chosen to house this workspace. Give it a name and select a region.
- Select Review + Create.
Add a diagnostic setting
Next, we add a diagnostic setting in your Azure VMware Solution private cloud, so it knows where to send your logs to.
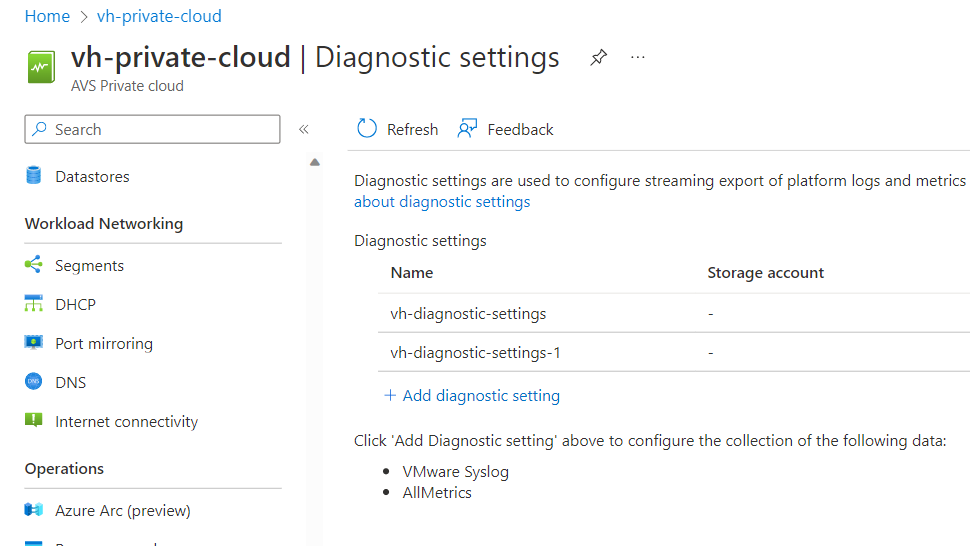
Select your Azure VMware Solution private cloud. Go to Diagnostic settings on the left-hand menu under Monitoring. Select Add diagnostic setting.
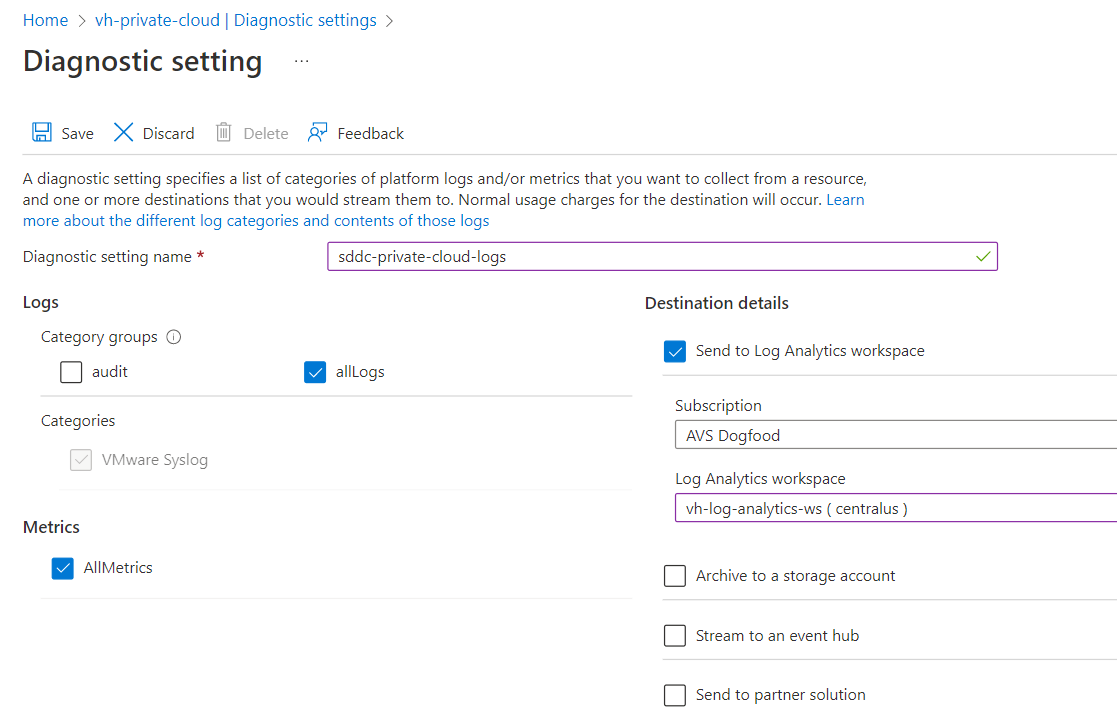
Give your diagnostic setting a name. Select the log categories you're interested in sending to your Log Analytics workspace.
Make sure to select the checkbox next to Send to Log Analytics workspace. Select the Subscription your Log Analytics workspace lives in and the Log Analytics workspace. Select Save on the top left.
At this point, your Log Analytics workspace is now successfully configured to receive logs from your Azure VMware Solution private cloud.
Search and analyze logs using Kusto
Now that you successfully configured your logs to go to your Log Analytics workspace, you can use that data to gain meaningful insights with the Log Analytics search feature. Log Analytics uses a language called the Kusto Query Language (or Kusto) to search through your logs.
For more information, see Data analysis in Azure Data Explorer with Kusto Query Language.
Archive to storage account
- In Diagnostic setting, select the storage account where you want to store the logs and select Save.

- Go to your Storage accounts, verify Insight logs vmwarelog was created, and select it.
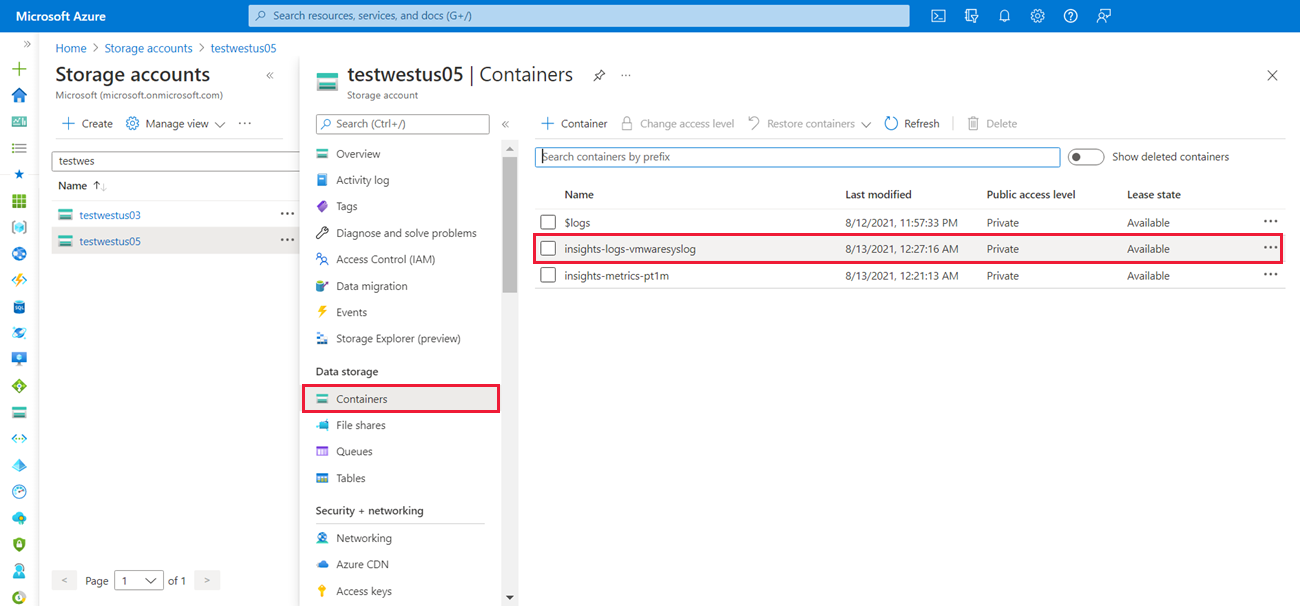
- Browse Insight logs vmwarelog to locate and download the json file to view the logs.

Stream to Microsoft Azure Event Hubs
- In Diagnostic setting, under Destination details, select Stream to an Event Hub.
- From the Event Hub namespace drop-down menu, choose where you want to send the logs, select, and Save.

Feedback
Coming soon: Throughout 2024 we will be phasing out GitHub Issues as the feedback mechanism for content and replacing it with a new feedback system. For more information see: https://aka.ms/ContentUserFeedback.
Submit and view feedback for