How to collect a network trace
If you come across an issue, a network trace can sometimes provide much helpful information. This how-to guide shows you the options to collect a network trace.
Warning
A network trace contains the full contents of every message sent by your app. Never post raw network traces from production apps to public forums like GitHub.
Collect a network trace with Fiddler
Fiddler is a powerful tool for collecting HTTP traces. Install it from telerik.com/fiddler, launch it, and then run your app and reproduce the issue. Fiddler is available for Windows, macOS, and Linux.
If you connect using HTTPS, there are some extra steps to ensure Fiddler can decrypt the HTTPS traffic. For more information, see the Fiddler documentation.
Once you've collected the trace, you can export the trace by choosing File > Save > All Sessions from the menu bar.
Collect a network trace with tcpdump (macOS and Linux only)
This method works for all apps.
You can collect raw TCP traces using tcpdump by running the following command from a command shell. You may need to be root or prefix the command with sudo if you get a permissions error:
tcpdump -i [interface] -w trace.pcap
Replace [interface] with the network interface you wish to capture on. Usually, this is something like /dev/eth0 (for your standard Ethernet interface) or /dev/lo0 (for localhost traffic). For more information, see the tcpdump man page on your host system.
man tcpdump
Collect a network trace in the browser (Browser-based apps only)
Most browser Developer Tools have a "Network" tab that allows you to capture network activity between the browser and the server.
Note
If the issues you are investigating require multiple requests to reproduce, select the Preserve Log option with Microsoft Edge, Google Chrome, and Safari. For Mozilla Firefox select the Persist Logs option.
Microsoft Edge (Chromium)
Open the DevTools
- Select
F12 - Select
Ctrl+Shift+I(Windows/Linux) orCommand+Option+I(macOS) - Select
Settings and moreand thenMore Tools > Developer Tools
- Select
Select the
NetworkTabRefresh the page (if needed) and reproduce the problem
Select the
Export HAR...in the toolbar to export the trace as a "HAR" file
Google Chrome
Open the Chrome DevTools
- Select
F12 - Select
Ctrl+Shift+I(Windows/Linux) orCommand+Option+I(macOS) - Select
Customize and control Google Chromeand thenMore Tools > Developer Tools
- Select
Select the
NetworkTabRefresh the page (if needed) and reproduce the problem
Select the
Export HAR...in the toolbar to export the trace as a "HAR" file
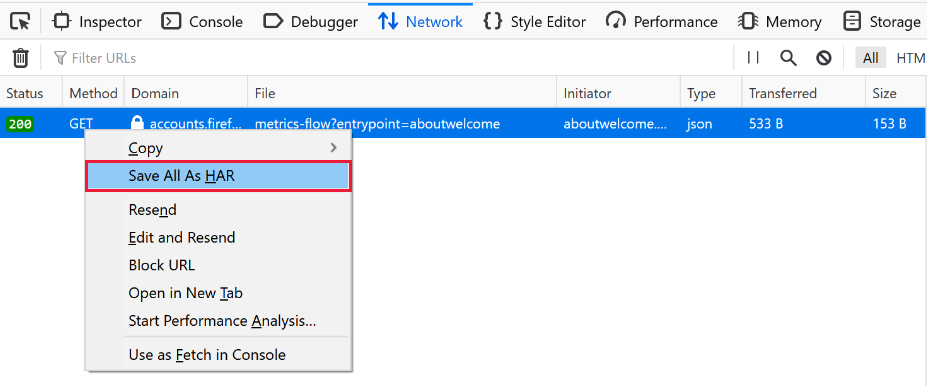
Mozilla Firefox
Open the Firefox Developer Tools
- Select
F12 - Select
Ctrl+Shift+I(Windows/Linux) orCommand+Option+I(macOS) - Select
Open menuand thenWeb Developer > Toggle Tools
- Select
Select the
NetworkTabRefresh the page (if needed) and reproduce the problem
Right-click anywhere in the list of requests and choose "Save All As HAR"
Safari
- Open the Web Development Tools
- Select
Command+Option+I - Select
Developermenu and then selectShow Web Inspector
- Select
- Select the
NetworkTab - Refresh the page (if needed) and reproduce the problem
- Right-click anywhere in the list of requests and choose "Save All As HAR"
Feedback
Coming soon: Throughout 2024 we will be phasing out GitHub Issues as the feedback mechanism for content and replacing it with a new feedback system. For more information see: https://aka.ms/ContentUserFeedback.
Submit and view feedback for