Monitor and debug an Azure Batch .NET application with Application Insights
Application Insights provides an elegant and powerful way for developers to monitor and debug applications deployed to Azure services. Use Application Insights to monitor performance counters and exceptions as well as instrument your code with custom metrics and tracing. Integrating Application Insights with your Azure Batch application allows you to gain deep insights into behaviors and investigate issues in near-real time.
This article shows how to add and configure the Application Insights library into your Azure Batch .NET solution and instrument your application code. It also shows ways to monitor your application via the Azure portal and build custom dashboards. For Application Insights support in other languages, see the languages, platforms, and integrations documentation.
A sample C# solution with code to accompany this article is available on GitHub. This example adds Application Insights instrumentation code to the TopNWords example. If you're not familiar with that example, try building and running TopNWords first. Doing this will help you understand a basic Batch workflow of processing a set of input blobs in parallel on multiple compute nodes.
Tip
As an alternative, configure your Batch solution to display Application Insights data such as VM performance counters in Batch Explorer. Batch Explorer is a free, rich-featured, standalone client tool to help create, debug, and monitor Azure Batch applications. Download an installation package for Mac, Linux, or Windows. See the batch-insights repo for quick steps to enable Application Insights data in Batch Explorer.
Prerequisites
Application Insights resource. Use the Azure portal to create an Application Insights resource. Select the General Application type.
Copy the instrumentation key from the Azure portal. You'll need this value later.
Note
You may be charged for data stored in Application Insights. This includes the diagnostic and monitoring data discussed in this article.
Add Application Insights to your project
The Microsoft.ApplicationInsights.WindowsServer NuGet package and its dependencies are required for your project. Add or restore them to your application's project. To install the package, use the Install-Package command or NuGet Package Manager.
Install-Package Microsoft.ApplicationInsights.WindowsServer
Reference Application Insights from your .NET application by using the Microsoft.ApplicationInsights namespace.
Instrument your code
To instrument your code, your solution needs to create an Application Insights TelemetryClient. In the example, the TelemetryClient loads its configuration from the ApplicationInsights.config file. Be sure to update ApplicationInsights.config in the following projects with your Application Insights instrumentation key: Microsoft.Azure.Batch.Samples.TelemetryStartTask and TopNWordsSample.
<InstrumentationKey>YOUR-IKEY-GOES-HERE</InstrumentationKey>
Also add the instrumentation key in the file TopNWords.cs.
The example in TopNWords.cs uses the following instrumentation calls from the Application Insights API:
TrackMetric()- Tracks how long, on average, a compute node takes to download the required text file.TrackTrace()- Adds debugging calls to your code.TrackEvent()- Tracks interesting events to capture.
This example purposely leaves out exception handling. Instead, Application Insights automatically reports unhandled exceptions, which significantly improves the debugging experience.
The following snippet illustrates how to use these methods.
public void CountWords(string blobName, int numTopN, string storageAccountName, string storageAccountKey)
{
    // simulate exception for some set of tasks
    Random rand = new Random();
    if (rand.Next(0, 10) % 10 == 0)
    {
        blobName += ".badUrl";
    }

    // log the url we are downloading the file from
    insightsClient.TrackTrace(new TraceTelemetry(string.Format("Task {0}: Download file from: {1}", this.taskId, blobName), SeverityLevel.Verbose));

    // open the cloud blob that contains the book
    var storageCred = new StorageCredentials(storageAccountName, storageAccountKey);
    CloudBlockBlob blob = new CloudBlockBlob(new Uri(blobName), storageCred);
    using (Stream memoryStream = new MemoryStream())
    {
        // calculate blob download time
        DateTime start = DateTime.Now;
        blob.DownloadToStream(memoryStream);
        TimeSpan downloadTime = DateTime.Now.Subtract(start);

        // track how long the blob takes to download on this node
        // this will help debug timing issues or identify poorly performing nodes
        insightsClient.TrackMetric("Blob download in seconds", downloadTime.TotalSeconds, this.CommonProperties);

        memoryStream.Position = 0; //Reset the stream
        var sr = new StreamReader(memoryStream);
        var myStr = sr.ReadToEnd();
        string[] words = myStr.Split(' ');

        // log how many words were found in the text file
        insightsClient.TrackTrace(new TraceTelemetry(string.Format("Task {0}: Found {1} words", this.taskId, words.Length), SeverityLevel.Verbose));
        var topNWords =
            words.
                Where(word => word.Length > 0).
                GroupBy(word => word, (key, group) => new KeyValuePair<String, long>(key, group.LongCount())).
                OrderByDescending(x => x.Value).
                Take(numTopN).
                ToList();
        foreach (var pair in topNWords)
        {
            Console.WriteLine("{0} {1}", pair.Key, pair.Value);
        }

        // emit an event to track the completion of the task
        insightsClient.TrackEvent("Done counting words");
    }
}
Azure Batch telemetry initializer helper
When reporting telemetry for a given server and instance, Application Insights uses the Azure VM Role and VM name for the default values. In the context of Azure Batch, the example shows how to use the pool name and compute node name instead. Use a telemetry initializer to override the default values.
using Microsoft.ApplicationInsights.Channel;
using Microsoft.ApplicationInsights.Extensibility;
using System;
using System.Threading;

namespace Microsoft.Azure.Batch.Samples.TelemetryInitializer
{
    public class AzureBatchNodeTelemetryInitializer : ITelemetryInitializer
    {
        // Azure Batch environment variables
        private const string PoolIdEnvironmentVariable = "AZ_BATCH_POOL_ID";
        private const string NodeIdEnvironmentVariable = "AZ_BATCH_NODE_ID";

        private string roleInstanceName;
        private string roleName;

        public void Initialize(ITelemetry telemetry)
        {
            if (string.IsNullOrEmpty(telemetry.Context.Cloud.RoleName))
            {
                // override the role name with the Azure Batch Pool name
                string name = LazyInitializer.EnsureInitialized(ref this.roleName, this.GetPoolName);
                telemetry.Context.Cloud.RoleName = name;
            }

            if (string.IsNullOrEmpty(telemetry.Context.Cloud.RoleInstance))
            {
                // override the role instance with the Azure Batch Compute Node name
                string name = LazyInitializer.EnsureInitialized(ref this.roleInstanceName, this.GetNodeName);
                telemetry.Context.Cloud.RoleInstance = name;
            }
        }

        private string GetPoolName()
        {
            return Environment.GetEnvironmentVariable(PoolIdEnvironmentVariable) ?? string.Empty;
        }

        private string GetNodeName()
        {
            return Environment.GetEnvironmentVariable(NodeIdEnvironmentVariable) ?? string.Empty;
        }
    }
}
To enable the telemetry initializer, the ApplicationInsights.config file in the TopNWordsSample project includes the following:
<TelemetryInitializers>
    <Add Type="Microsoft.Azure.Batch.Samples.TelemetryInitializer.AzureBatchNodeTelemetryInitializer, Microsoft.Azure.Batch.Samples.TelemetryInitializer"/>
</TelemetryInitializers>
Update the job and tasks to include Application Insights binaries
In order for Application Insights to run correctly on your compute nodes, make sure the binaries are correctly placed. Add the required binaries to your task's resource files collection so that they get downloaded at the time your task executes. The following snippets are similar to code in Job.cs.
First, create a static list of Application Insights files to upload.
private static readonly List<string> AIFilesToUpload = new List<string>()
{
    // Application Insights config and assemblies
    "ApplicationInsights.config",
    "Microsoft.ApplicationInsights.dll",
    "Microsoft.AI.Agent.Intercept.dll",
    "Microsoft.AI.DependencyCollector.dll",
    "Microsoft.AI.PerfCounterCollector.dll",
    "Microsoft.AI.ServerTelemetryChannel.dll",
    "Microsoft.AI.WindowsServer.dll",

    // custom telemetry initializer assemblies
    "Microsoft.Azure.Batch.Samples.TelemetryInitializer.dll",
 };
...
Next, create the staging files that are used by the task.
...
// create file staging objects that represent the executable and its dependent assembly to run as the task.
// These files are copied to every node before the corresponding task is scheduled to run on that node.
FileToStage topNWordExe = new FileToStage(TopNWordsExeName, stagingStorageAccount);
FileToStage storageDll = new FileToStage(StorageClientDllName, stagingStorageAccount);

// Upload Application Insights assemblies
List<FileToStage> aiStagedFiles = new List<FileToStage>();
foreach (string aiFile in AIFilesToUpload)
{
    aiStagedFiles.Add(new FileToStage(aiFile, stagingStorageAccount));
}
...
The FileToStage method is a helper function in the code sample that allows you to easily upload a file from local disk to an Azure Storage blob. Each file is later downloaded to a compute node and referenced by a task.
Finally, add the tasks to the job and include the necessary Application Insights binaries.
...
// initialize a collection to hold the tasks that will be submitted in their entirety
List<CloudTask> tasksToRun = new List<CloudTask>(topNWordsConfiguration.NumberOfTasks);
for (int i = 1; i <= topNWordsConfiguration.NumberOfTasks; i++)
{
    CloudTask task = new CloudTask("task_no_" + i, String.Format("{0} --Task {1} {2} {3} {4}",
        TopNWordsExeName,
        string.Format("https://{0}.blob.core.windows.net/{1}",
            accountSettings.StorageAccountName,
            documents[i]),
        topNWordsConfiguration.TopWordCount,
        accountSettings.StorageAccountName,
        accountSettings.StorageAccountKey));

    //This is the list of files to stage to a container -- for each job, one container is created and
    //files all resolve to Azure Blobs by their name (so two tasks with the same named file will create just 1 blob in
    //the container).
    task.FilesToStage = new List<IFileStagingProvider>
                        {
                            // required application binaries
                            topNWordExe,
                            storageDll,
                        };
    foreach (FileToStage stagedFile in aiStagedFiles)
   {
        task.FilesToStage.Add(stagedFile);
   }
    task.RunElevated = false;
    tasksToRun.Add(task);
}
View data in the Azure portal
Now that you've configured the job and tasks to use Application Insights, run the example job in your pool. Navigate to the Azure portal and open the Application Insights resource that you provisioned. After the pool is provisioned, you should start to see data flowing and getting logged. The rest of this article touches on only a few Application Insights features, but feel free to explore the full feature set.
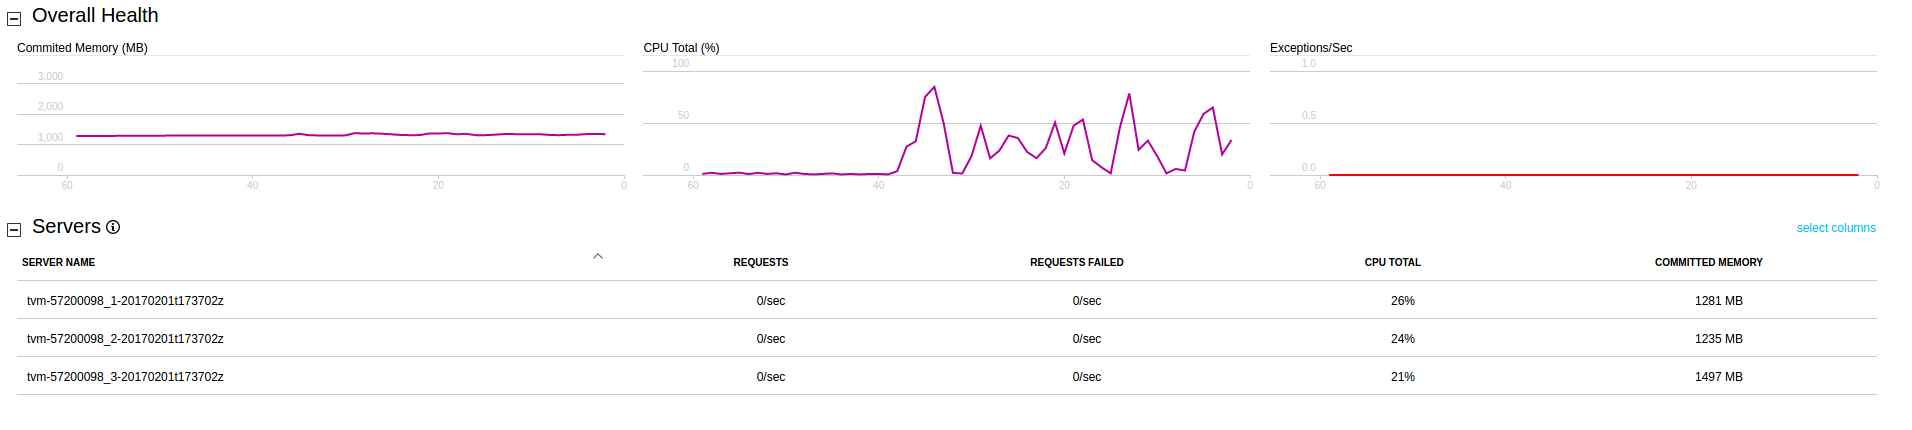
View live stream data
To view trace logs in your Applications Insights resource, click Live Stream. The following screenshot shows how to view live data coming from the compute nodes in the pool, for example the CPU usage per compute node.
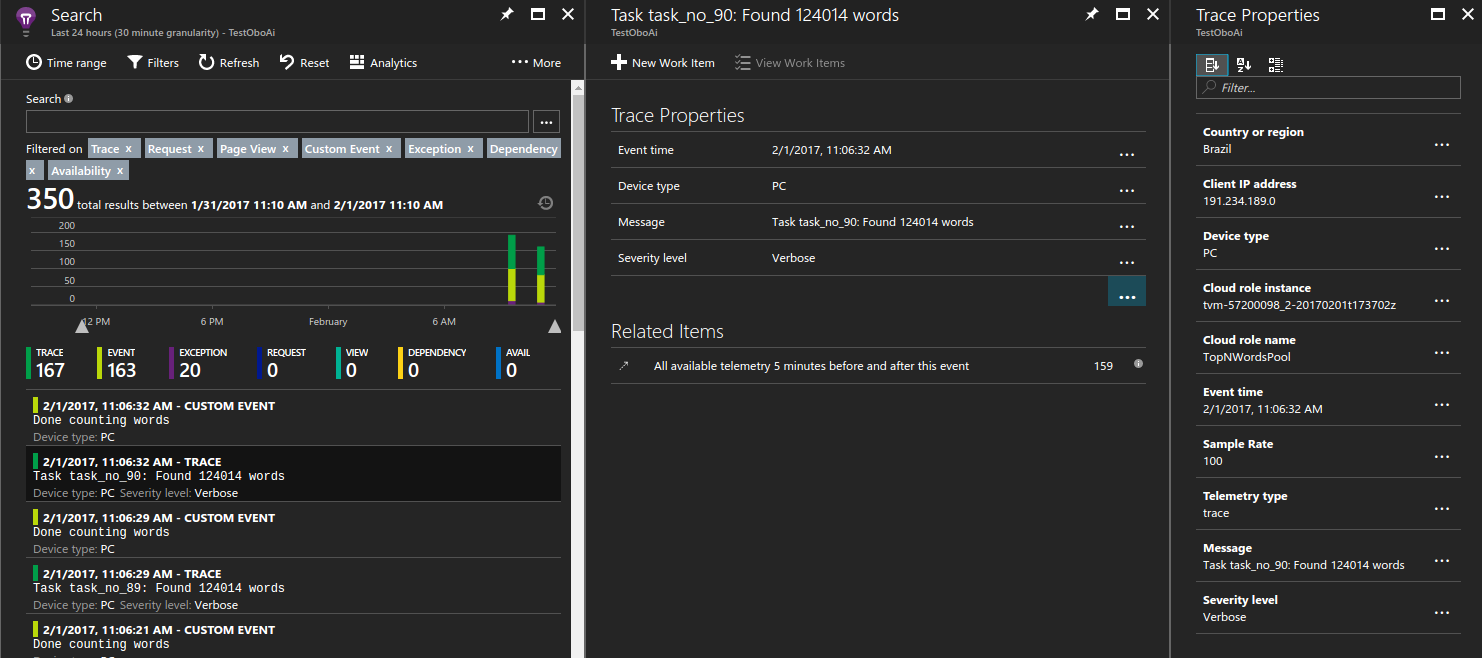
View trace logs
To view trace logs in your Applications Insights resource, click Search. This view shows a list of diagnostic data captured by Application Insights including traces, events, and exceptions.
The following screenshot shows how a single trace for a task is logged and later queried for debugging purposes.
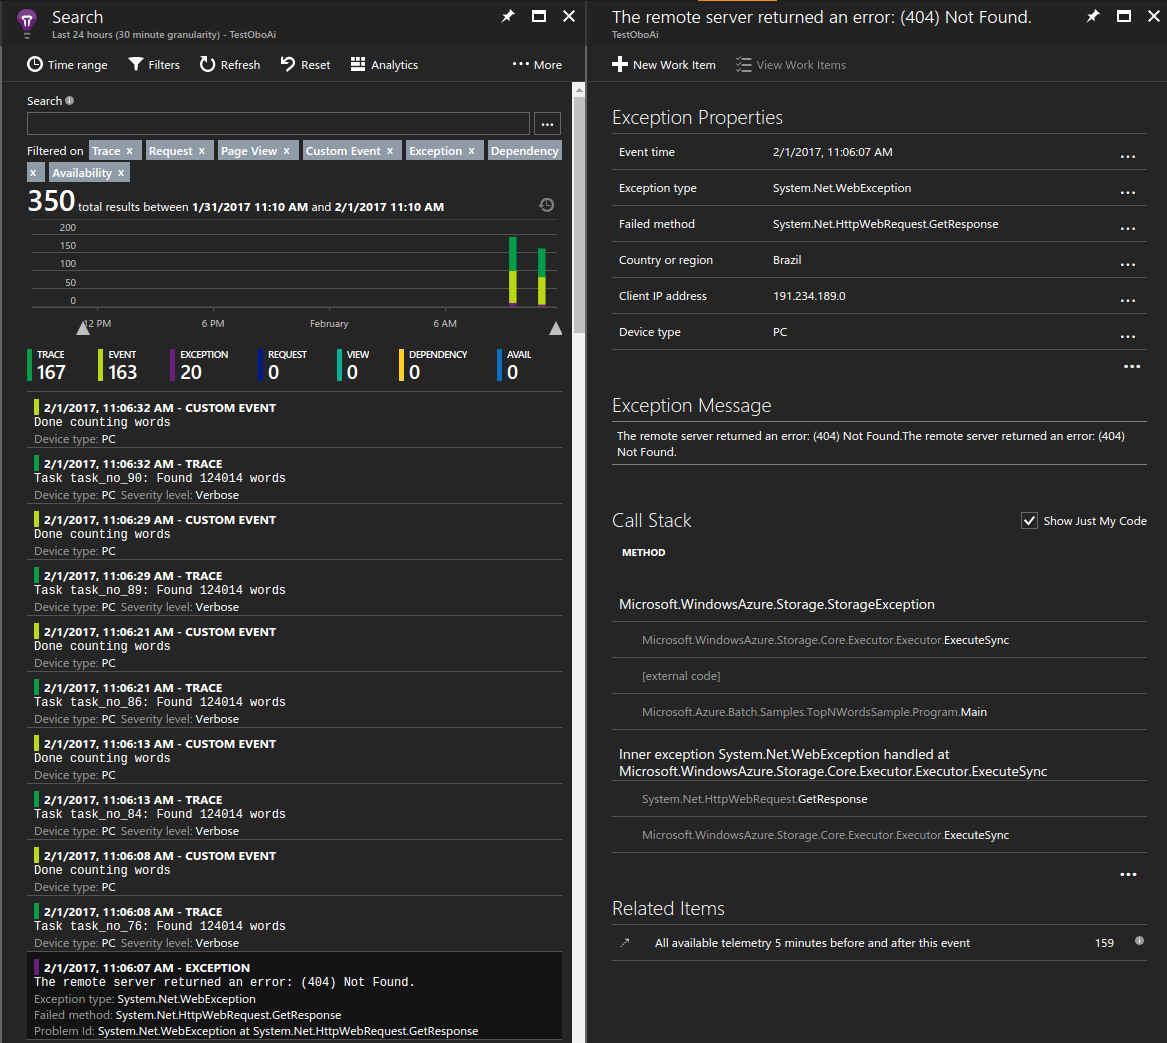
View unhandled exceptions
Application Insights logs exceptions thrown from your application. In this case, within seconds of the application throwing the exception, you can drill into a specific exception and diagnose the issue.
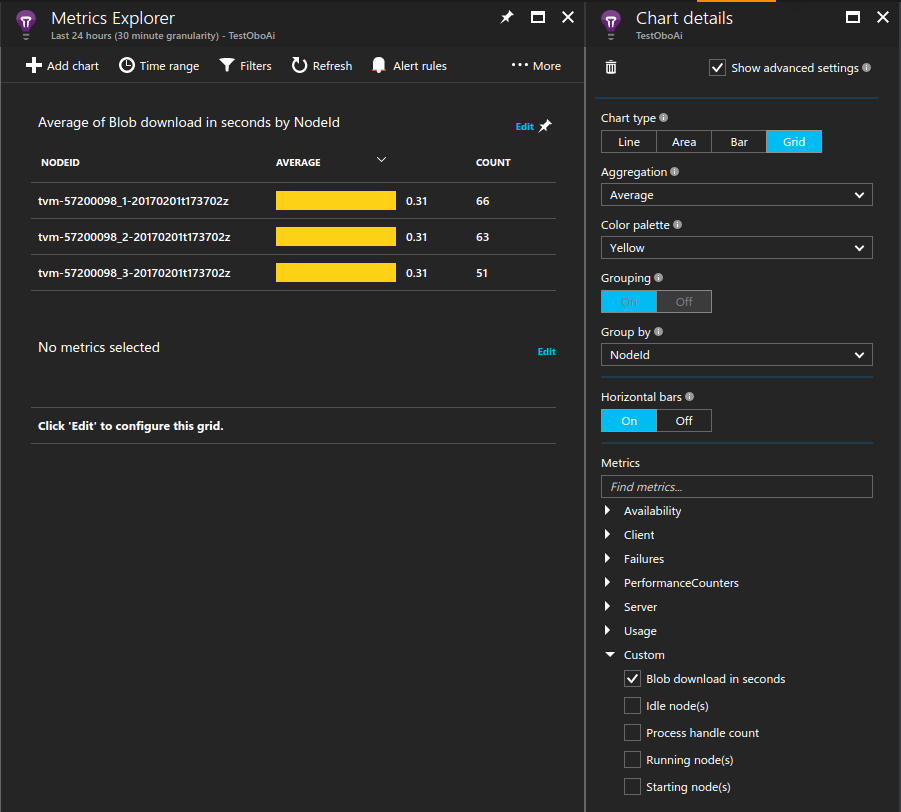
Measure blob download time
Custom metrics are also a valuable tool in the portal. For example, you can display the average time it took each compute node to download the required text file it was processing.
To create a sample chart:
- In your Application Insights resource, click Metrics Explorer > Add chart.
- Click Edit on the chart that was added.
- Update the chart details as follows:
- Set Chart type to Grid.
- Set Aggregation to Average.
- Set Group by to NodeId.
- In Metrics, select Custom > Blob download in seconds.
- Adjust display Color palette to your choice.
Monitor compute nodes continuously
You may have noticed that all metrics, including performance counters, are only logged when the tasks are running. This behavior is useful because it limits the amount of data that Application Insights logs. However, there are cases when you would always like to monitor the compute nodes. For example, they might be running background work which is not scheduled via the Batch service. In this case, set up a monitoring process to run for the life of the compute node.
One way to achieve this behavior is to spawn a process that loads the Application Insights library and runs in the background. In the example, the start task loads the binaries on the machine and keeps a process running indefinitely. Configure the Application Insights configuration file for this process to emit additional data you're interested in, such as performance counters.
...
 // Batch start task telemetry runner
private const string BatchStartTaskFolderName = "StartTask";
private const string BatchStartTaskTelemetryRunnerName = "Microsoft.Azure.Batch.Samples.TelemetryStartTask.exe";
private const string BatchStartTaskTelemetryRunnerAIConfig = "ApplicationInsights.config";
...
CloudPool pool = client.PoolOperations.CreatePool(
    topNWordsConfiguration.PoolId,
    targetDedicated: topNWordsConfiguration.PoolNodeCount,
    virtualMachineSize: "standard_d1_v2",
    VirtualMachineConfiguration: new VirtualMachineConfiguration(
    imageReference: new ImageReference(
                        publisher: "MicrosoftWindowsServer",
                        offer: "WindowsServer",
                        sku: "2019-datacenter-core",
                        version: "latest"),
    nodeAgentSkuId: "batch.node.windows amd64");
...

// Create a start task which will run a dummy exe in background that simply emits performance
// counter data as defined in the relevant ApplicationInsights.config.
// Note that the waitForSuccess on the start task was not set so the Compute Node will be
// available immediately after this command is run.
pool.StartTask = new StartTask()
{
    CommandLine = string.Format("cmd /c {0}", BatchStartTaskTelemetryRunnerName),
    ResourceFiles = resourceFiles
};
...
Tip
To increase the manageability of your solution, you can bundle the assembly in an application package. Then, to deploy the application package automatically to your pools, add an application package reference to the pool configuration.
Throttle and sample data
Due to the large-scale nature of Azure Batch applications running in production, you might want to limit the amount of data collected by Application Insights to manage costs. See Sampling in Application Insights for some mechanisms to achieve this.
Next steps
- Learn more about Application Insights.
- For Application Insights support in other languages, see the languages, platforms, and integrations documentation.
Feedback
Coming soon: Throughout 2024 we will be phasing out GitHub Issues as the feedback mechanism for content and replacing it with a new feedback system. For more information see: https://aka.ms/ContentUserFeedback.
Submit and view feedback for