Tutorial: Use Univariate Anomaly Detector in Azure Data Explorer
Important
Starting on the 20th of September, 2023 you won’t be able to create new Anomaly Detector resources. The Anomaly Detector service is being retired on the 1st of October, 2026.
Introduction
The Anomaly Detector API enables you to check and detect abnormalities in your time series data without having to know machine learning. The Anomaly Detector API's algorithms adapt by automatically finding and applying the best-fitting models to your data, regardless of industry, scenario, or data volume. Using your time series data, the API decides boundaries for anomaly detection, expected values, and which data points are anomalies.
Azure Data Explorer is a fully managed, high-performance, big data analytics platform that makes it easy to analyze high volumes of data in near real-time. The Azure Data Explorer toolbox gives you an end-to-end solution for data ingestion, query, visualization, and management.
Anomaly Detection functions in Azure Data Explorer
Function 1: series_uv_anomalies_fl()
The function series_uv_anomalies_fl() detects anomalies in time series by calling the Univariate Anomaly Detector API. The function accepts a limited set of time series as numerical dynamic arrays and the required anomaly detection sensitivity level. Each time series is converted into the required JSON (JavaScript Object Notation) format and posts it to the Anomaly Detector service endpoint. The service response has dynamic arrays of high/low/all anomalies, the modeled baseline time series, its normal high/low boundaries (a value above or below the high/low boundary is an anomaly) and the detected seasonality.
Function 2: series_uv_change_points_fl()
The function series_uv_change_points_fl() finds change points in time series by calling the Univariate Anomaly Detector API. The function accepts a limited set of time series as numerical dynamic arrays, the change point detection threshold, and the minimum size of the stable trend window. Each time series is converted into the required JSON format and posts it to the Anomaly Detector service endpoint. The service response has dynamic arrays of change points, their respective confidence, and the detected seasonality.
These two functions are user-defined tabular functions applied using the invoke operator. You can either embed its code in your query or you can define it as a stored function in your database.
Where to use these new capabilities?
These two functions are available to use either in Azure Data Explorer website or in the Kusto Explorer application.

Create resources
- Create an Azure Data Explorer Cluster in the Azure portal, after the resource is created successfully, go to the resource and create a database.
- Create an Anomaly Detector resource in the Azure portal and check the keys and endpoints that you’ll need later.
- Enable plugins in Azure Data Explorer
- These new functions have inline Python and require enabling the python() plugin on the cluster.
- These new functions call the anomaly detection service endpoint and require:
- Enable the http_request plugin / http_request_post plugin on the cluster.
- Modify the callout policy for type
webapito allow accessing the service endpoint.
Download sample data
This quickstart uses the request-data.csv file that can be downloaded from our GitHub sample data
You can also download the sample data by running:
curl "https://raw.githubusercontent.com/Azure/azure-sdk-for-python/main/sdk/anomalydetector/azure-ai-anomalydetector/samples/sample_data/request-data.csv" --output request-data.csv
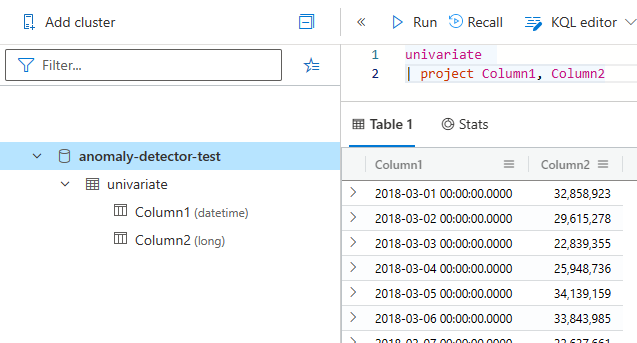
Then ingest the sample data to Azure Data Explorer by following the ingestion guide. Name the new table for the ingested data univariate.
Once ingested, your data should look as follows:
Detect anomalies in an entire time series
In Azure Data Explorer, run the following query to make an anomaly detection chart with your onboarded data. You could also create a function to add the code to a stored function for persistent usage.
let series_uv_anomalies_fl=(tbl:(*), y_series:string, sensitivity:int=85, tsid:string='_tsid')
{
    let uri = '[Your-Endpoint]anomalydetector/v1.0/timeseries/entire/detect';
    let headers=dynamic({'Ocp-Apim-Subscription-Key': h'[Your-key]'});
    let kwargs = pack('y_series', y_series, 'sensitivity', sensitivity);
    let code = ```if 1:
        import json
        y_series = kargs["y_series"]
        sensitivity = kargs["sensitivity"]
        json_str = []
        for i in range(len(df)):
            row = df.iloc[i, :]
            ts = [{'value':row[y_series][j]} for j in range(len(row[y_series]))]
            json_data = {'series': ts, "sensitivity":sensitivity}     # auto-detect period, or we can force 'period': 84. We can also add 'maxAnomalyRatio':0.25 for maximum 25% anomalies
            json_str = json_str + [json.dumps(json_data)]
        result = df
        result['json_str'] = json_str
    ```;
    tbl
    | evaluate python(typeof(*, json_str:string), code, kwargs)
    | extend _tsid = column_ifexists(tsid, 1)
    | partition by _tsid (
       project json_str
       | evaluate http_request_post(uri, headers, dynamic(null))
       | project period=ResponseBody.period, baseline_ama=ResponseBody.expectedValues, ad_ama=series_add(0, ResponseBody.isAnomaly), pos_ad_ama=series_add(0, ResponseBody.isPositiveAnomaly)
       , neg_ad_ama=series_add(0, ResponseBody.isNegativeAnomaly), upper_ama=series_add(ResponseBody.expectedValues, ResponseBody.upperMargins), lower_ama=series_subtract(ResponseBody.expectedValues, ResponseBody.lowerMargins)
       | extend _tsid=toscalar(_tsid)
      )
}
;
let stime=datetime(2018-03-01);
let etime=datetime(2018-04-16);
let dt=1d;
let ts = univariate
| make-series value=avg(Column2) on Column1 from stime to etime step dt
| extend _tsid='TS1';
ts
| invoke series_uv_anomalies_fl('value')
| lookup ts on _tsid
| render anomalychart with(xcolumn=Column1, ycolumns=value, anomalycolumns=ad_ama)
After you run the code, you'll render a chart like this:

