Voice and video Insights
In this document, we outline the available insights dashboard to monitor Voice and Video logs and metrics.
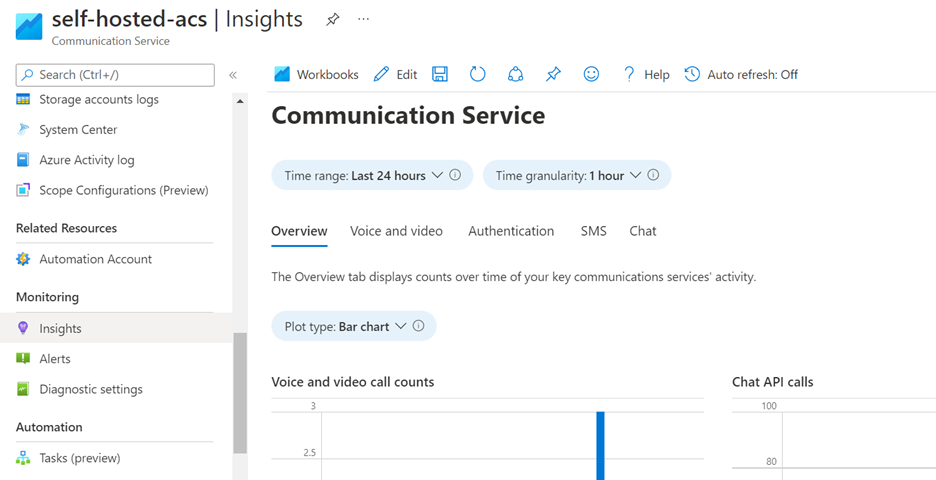
Overview
Within your Communications Resource, we've provided an Insights Preview feature that displays many data visualizations conveying insights from the Azure Monitor logs and metrics monitored for your Communications Services. The visualizations within Insights are made possible via Azure Monitor Workbooks. In order to take advantage of Workbooks, follow the instructions outlined in Enable Azure Monitor in Diagnostic Settings. To enable Workbooks, you need to send your logs to a Log Analytics workspace destination.
Prerequisites
- In order to take advantage of Workbooks, follow the instructions outlined in Enable Azure Monitor in Diagnostic Settings. You need to enable
Operational Authentication Logs,Call Summary Logs,Call Diagnostic Logs. - To use Workbooks, you need to send your logs to a Log Analytics workspace destination.
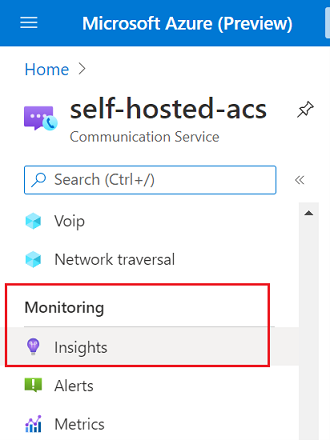
Accessing Azure Insights for Communication Services
Inside your Azure Communication Services resource, scroll down on the left nav bar to the Monitor category and click on the Insights tab:
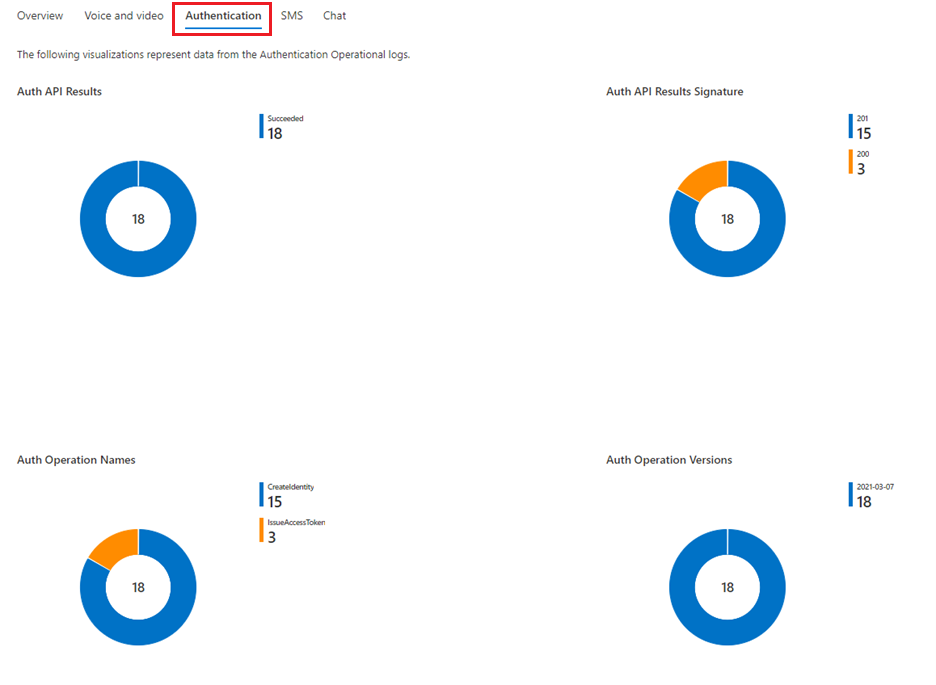
Authentication insights
The Authentication tab shows authentication logs, which are created through operations such as issuing an access token or creating an identity. The data displayed includes the types of operations performed and the results of those operations:
Voice and Video Insights
Since Voice and video logs are the most complex in nature, this modality is broken down into four subsections:
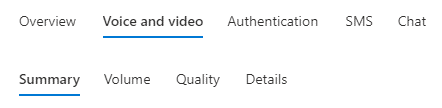
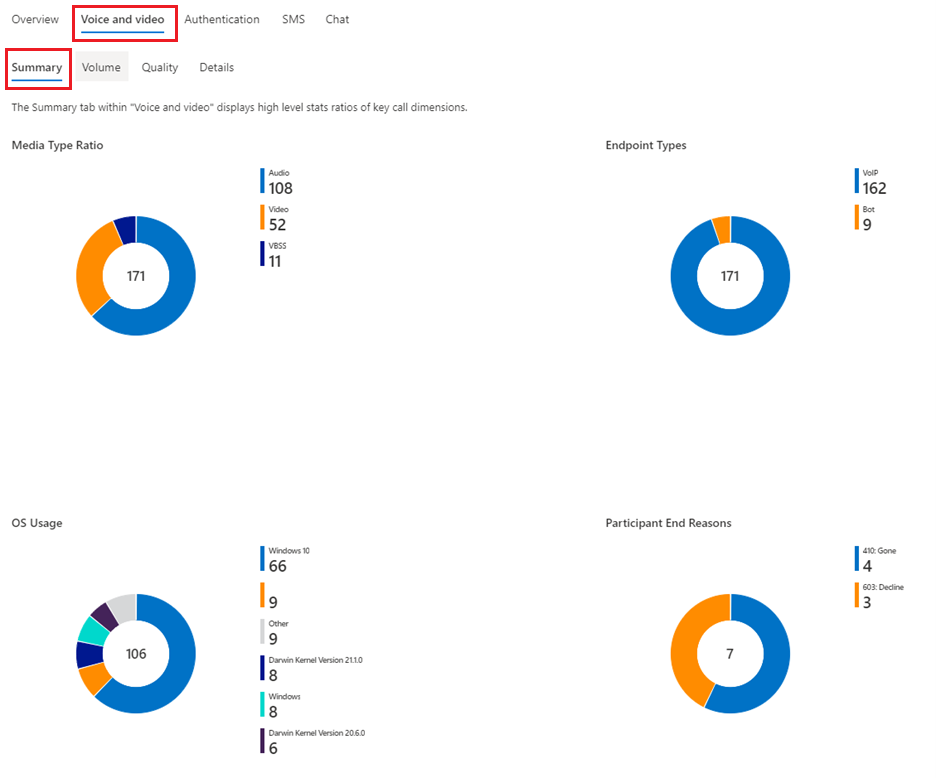
The Summary tab contains general information about Voice and video usage, including the types of media streams shared, the types of endpoints participating in a call (e.g. VoIP, Bot, Application, PSTN, or Server), the OS usage, and participant end reasons:
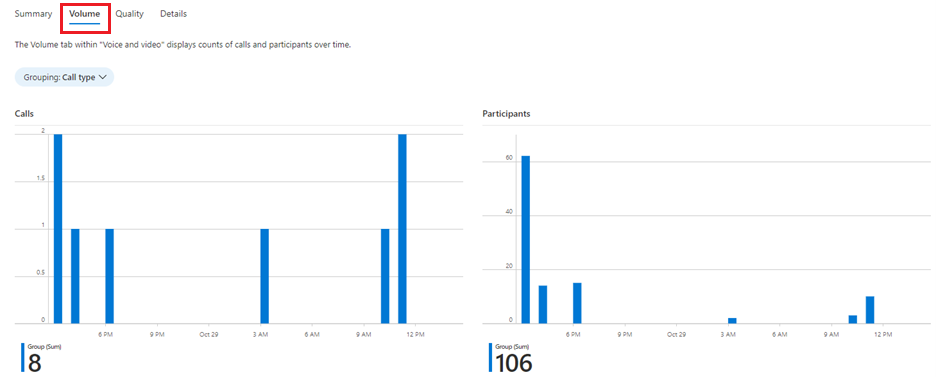
The Volume tab under the Voice and video modality displays the number of calls and the number of participants in a specific period of time (Time range parameter), subdivided into time bins (Time granularity parameter):
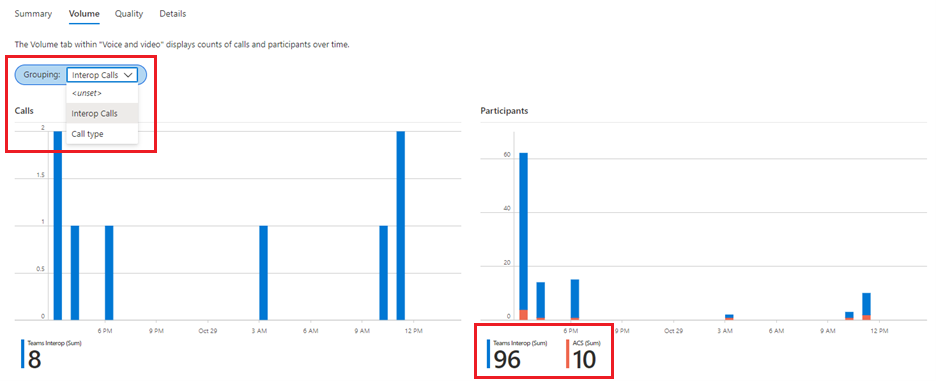
The Volume tab contains a Grouping parameter, which helps visualize the number of calls and participants segmented by either Call type (P2P vs. Group calls) and Interop Calls (pure Azure Communication Services vs. Teams Interop):
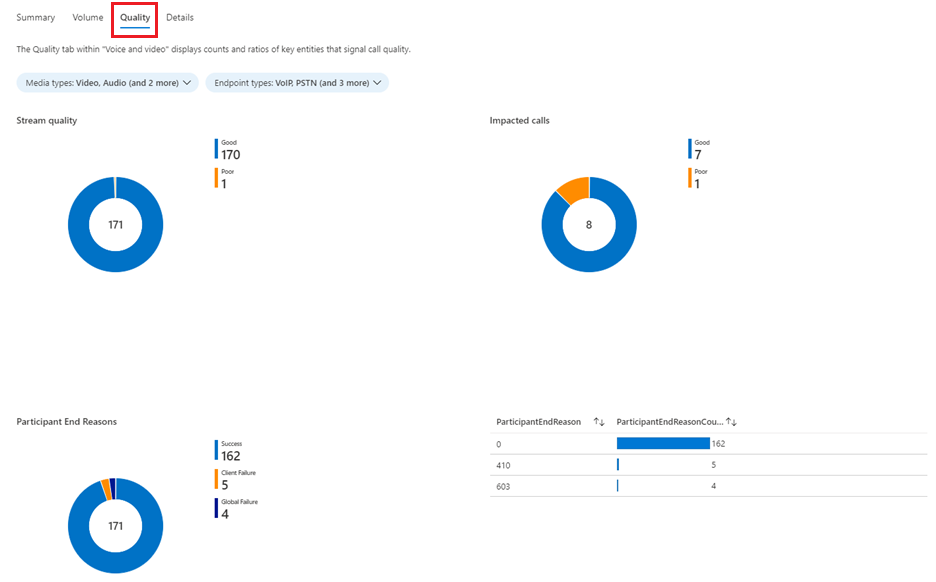
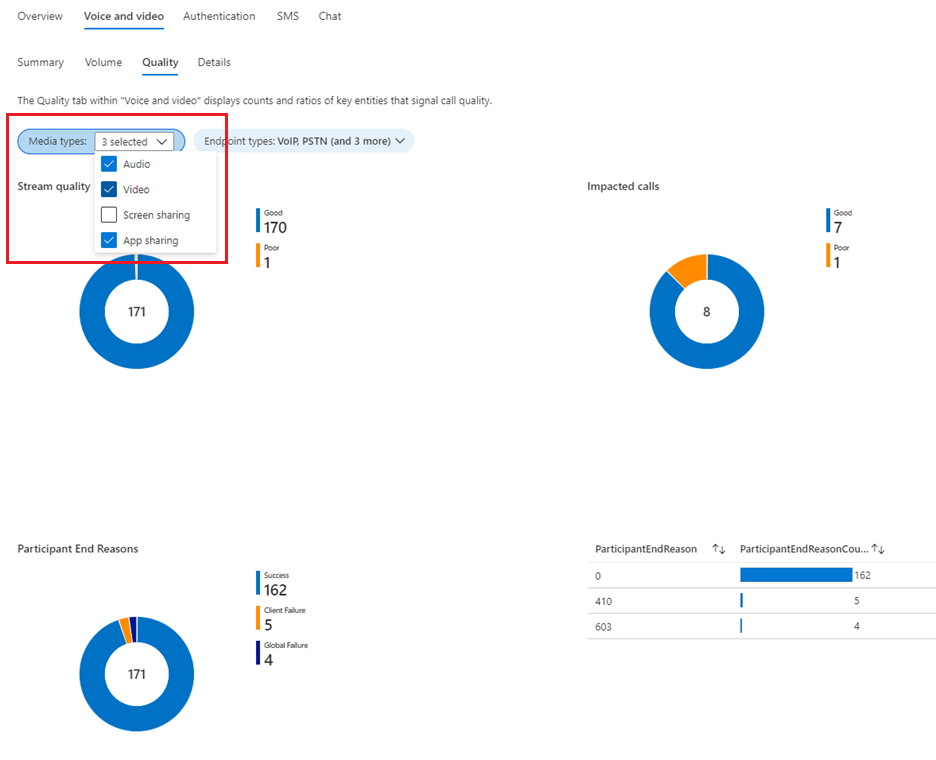
The Quality tab under Voice and video allows users to inspect the quality distribution of calls, where quality is defined at three levels for this dashboard:
The proportion of poor-quality media streams (Stream quality plot), where a stream’s quality is classified as Poor when it has at least one unhealthy telemetry value, where unhealthy ranges are defined as:
- Jitter > 30 milliseconds
- Packet loss rate > 10%
- Round trip time > 500 milliseconds
The proportion of Impacted calls, where an impacted call is defined as a call that has at least one poor quality stream
Participant end reasons, which keep track of the reason why a participant left a call. End reasons are SIP codes, which are numeric codes that describe the specific status of a signaling request. SIP codes can be grouped into six categories: Success, Client Failure, Server Failure, Global Failure, Redirection, and Provisional. The distribution of SIP code categories is shown in the pie chart on the left hand side, while a list of the specific SIP codes for participant end reasons is provided on the right hand side
Quality can also be filtered by the types of media streams (Media Type parameter) used in the call, e.g. to only get the impacted calls in terms of video stream quality:
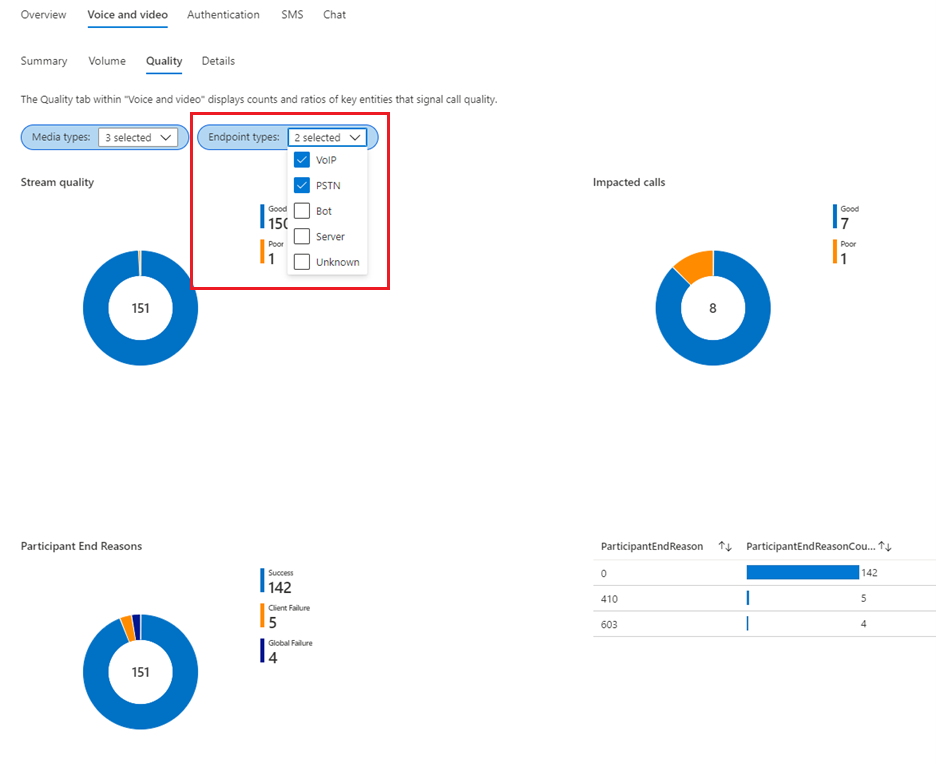
And can also be filtered by endpoint types (Endpoint Type parameter), e.g. getting the participant end reasons for PSTN participants. These filters allow for multiple selections:
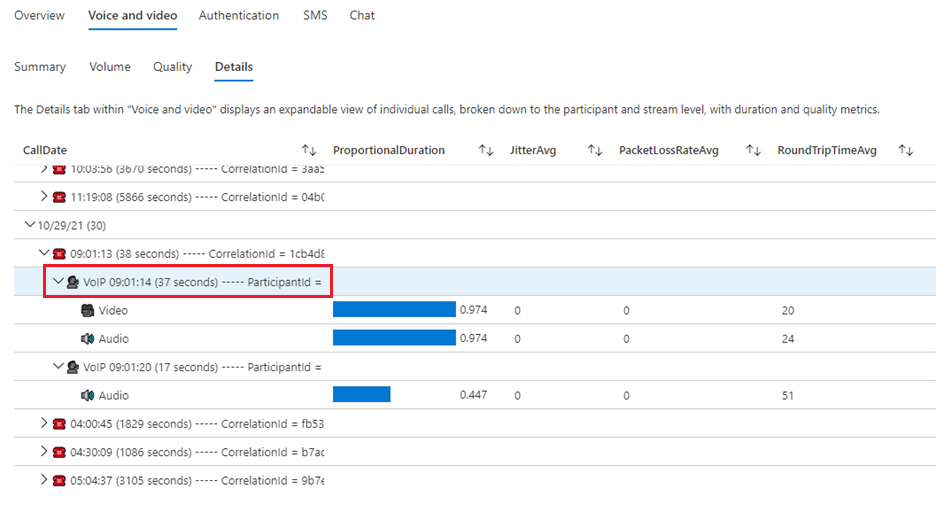
The Details tab offers a quick way to navigate through the Voice and video calls made in a time range by grouping calls by dates, and showing the details of every call made in terms of the participants in that call and the outgoing streams per participant, together with duration and telemetry values for these:
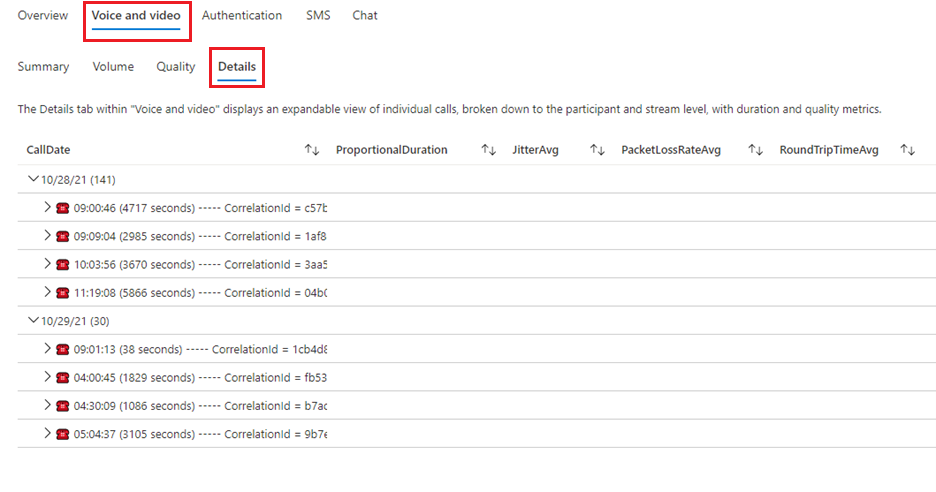
The details of a call are initially hidden. A list of the participants is displayed after clicking on a call:
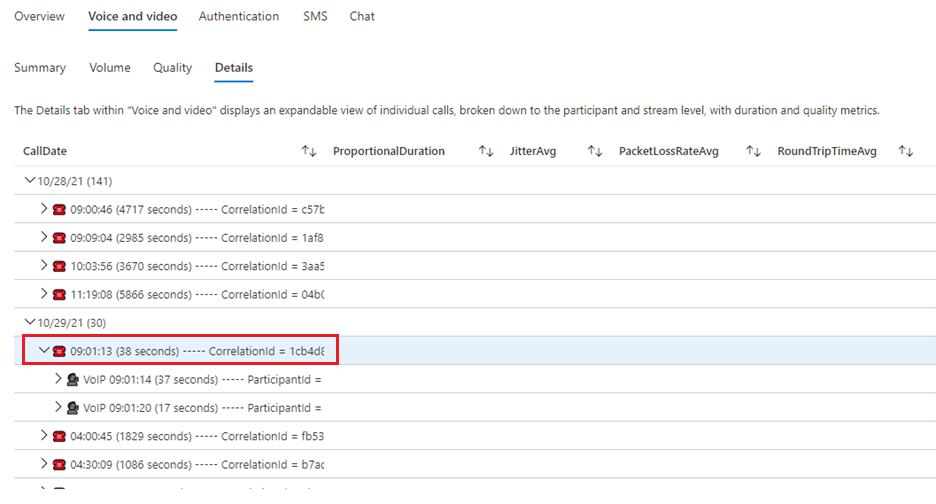
And clicking on a participant displays a list of the outgoing streams for that participant, together with their duration (proportional to the full call duration) and telemetry values, where unhealthy values are displayed in red:
More information about workbooks
For an in-depth description of workbooks, refer to the Azure Monitor Workbooks documentation.
Editing dashboards
The Insights dashboards provided with your Communication Service resource can be customized by clicking on the Edit button on the top navigation bar:
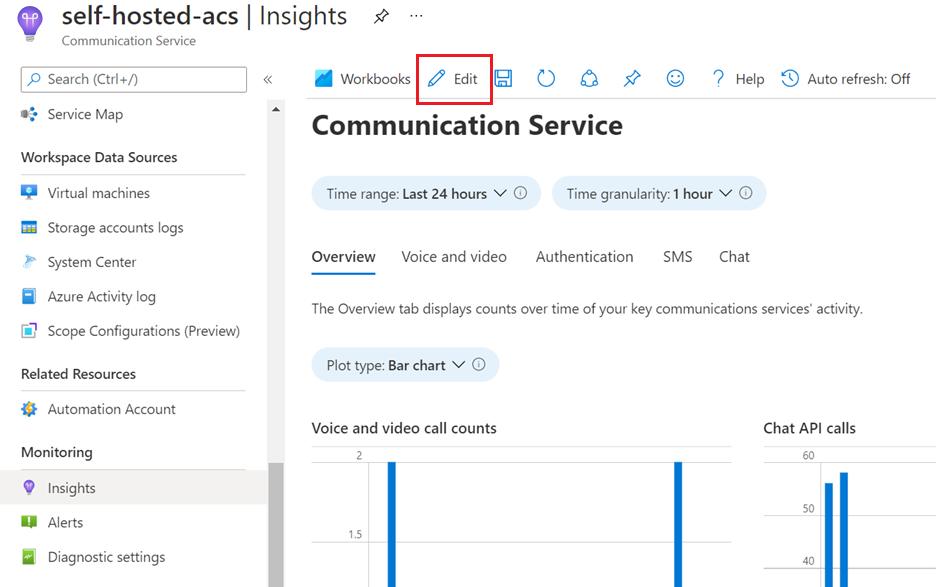
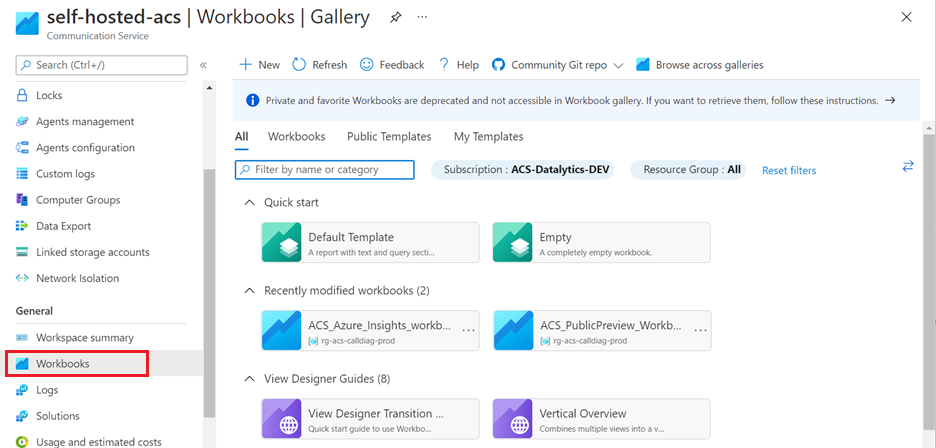
Editing these dashboards doesn't modify the Insights tab, but rather creates a separate workbook that can be accessed on your resource’s Workbooks tab:
For an in-depth description of workbooks, refer to the Azure Monitor Workbooks documentation.
Feedback
Coming soon: Throughout 2024 we will be phasing out GitHub Issues as the feedback mechanism for content and replacing it with a new feedback system. For more information see: https://aka.ms/ContentUserFeedback.
Submit and view feedback for