Query call logs
Overview and access
Before you can take advantage of Log Analytics for your Communications Services logs, you must first follow the steps outlined in Enable logging in Diagnostic Settings. Once you've enabled your logs and a Log Analytics Workspace, you will have access to many helpful default query packs that will help you quickly visualize and understand the data available in your logs, which are described below. Through Log Analytics, you also get access to more Communications Services Insights via Azure Monitor Workbooks, the ability to create our own queries and Workbooks, Log Analytics APIs overview to any query.
Access
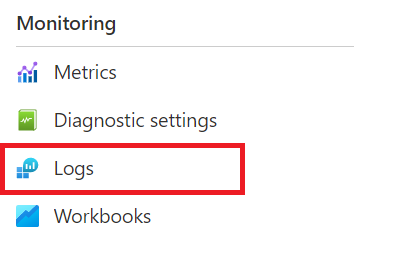
You can access the queries by starting on your Communications Services resource page, and then clicking on "Logs" in the left navigation within the Monitor section:
From there, you're presented with a modal screen that contains all of the default query packs available for your Communications Services, with list of Query Packs available to navigate to the left.

If you close the modal screen, you can still navigate to the various query packs, directly access data in the form of tables based on the schema of the logs and metrics you've enabled in your Diagnostic Setting. Here, you can create your own queries from the data using KQL (Kusto). Learn more about using, editing, and creating queries by reading more about: Log Analytics Queries


Default query packs for call summary and call diagnostic logs
The following are descriptions of each query in the default query pack, for the Call Summary and Call Diagnostic logs including code samples and example outputs for each query available:
Call Overview Queries
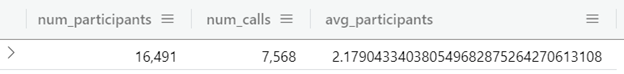
Number of participants per call
// Count number of calls and participants,
// and print average participants per call
ACSCallSummary
| distinct CorrelationId, ParticipantId, EndpointId
| summarize num_participants=count(), num_calls=dcount(CorrelationId)
| extend avg_participants = todecimal(num_participants) / todecimal(num_calls)
Sample output:
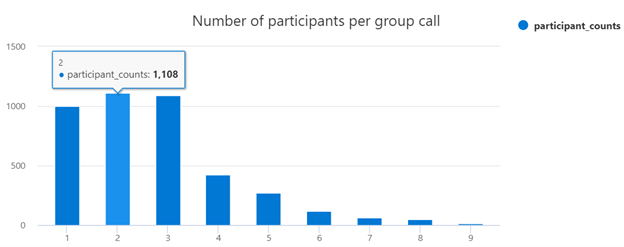
Number of participants per group call
// Count number of participants per group call
ACSCallSummary
| where CallType == 'Group'
| distinct CorrelationId, ParticipantId
| summarize num_participants=count() by CorrelationId
| summarize participant_counts=count() by num_participants
| order by num_participants asc
| render columnchart with  (xcolumn = num_participants, title="Number of participants per group call")
Sample output:
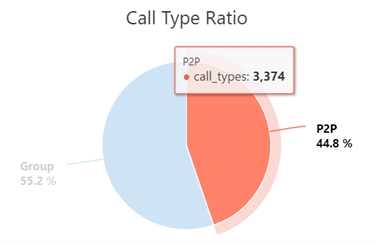
Ratio of call types
// Ratio of call types
ACSCallSummary
| summarize call_types=dcount(CorrelationId) by CallType
| render piechart title="Call Type Ratio"
Sample output:
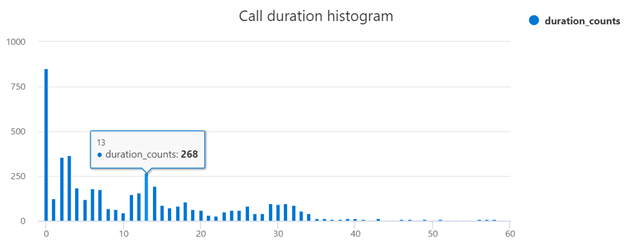
Call duration distribution
// Call duration histogram
ACSCallSummary
| distinct CorrelationId, CallDuration
|summarize duration_counts=count() by CallDuration
| order by CallDuration asc
| render columnchart with (xcolumn = CallDuration, title="Call duration histogram")
Sample output:
Call duration percentiles
// Call duration percentiles
ACSCallSummary
| distinct CorrelationId, CallDuration
| summarize avg(CallDuration), percentiles(CallDuration, 50, 90, 99)
Sample output:

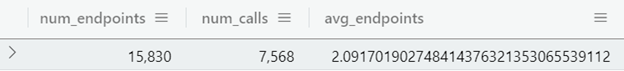
Endpoint information queries
Number of endpoints per call
// Count number of calls and endpoints,
// and print average endpoints per call
ACSCallSummary
| distinct CorrelationId, EndpointId
| summarize num_endpoints=count(), num_calls=dcount(CorrelationId)
| extend avg_endpoints = todecimal(num_endpoints) / todecimal(num_calls)
Sample output:
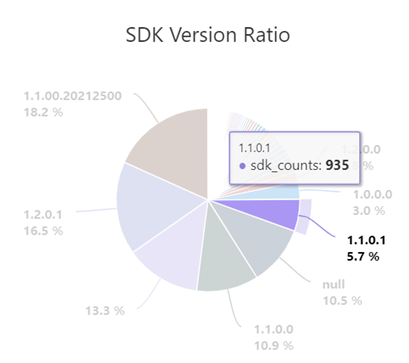
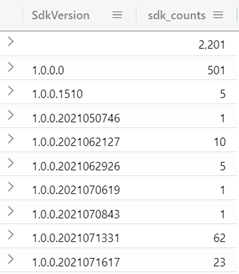
Ratio of SDK versions
// Ratio of SDK Versions
ACSCallSummary
| distinct CorrelationId, ParticipantId, EndpointId, SdkVersion
| summarize sdk_counts=count() by SdkVersion
| order by SdkVersion asc
| render piechart title="SDK Version Ratio"
Sample output:
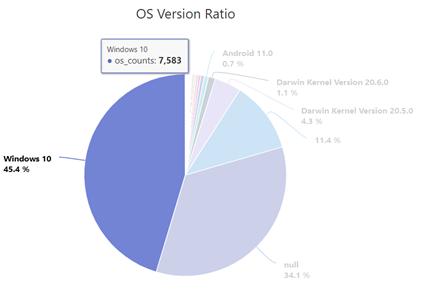
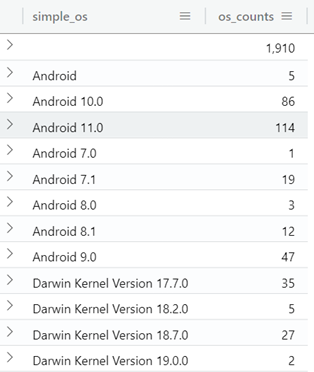
Ratio of OS versions (simplified OS name)
// Ratio of OS Versions (simplified OS name)
ACSCallSummary
| distinct CorrelationId, ParticipantId, EndpointId, OsVersion
| extend simple_os = case(  indexof(OsVersion, "Android") != -1, tostring(split(OsVersion, ";")[0]),
                            indexof(OsVersion, "Darwin") != -1, tostring(split(OsVersion, ":")[0]),
                            indexof(OsVersion, "Windows") != -1, tostring(split(OsVersion, ".")[0]),
                            OsVersion
                        )
| summarize os_counts=count() by simple_os
| order by simple_os asc
| render piechart title="OS Version Ratio"
Sample output:
Media stream queries
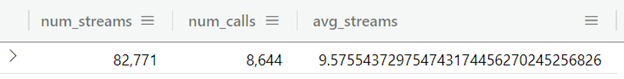
Streams per call
// Count number of calls and streams,
// and print average streams per call
ACSCallDiagnostics
| summarize num_streams=count(), num_calls=dcount(CorrelationId)
| extend avg_streams = todecimal(num_streams) / todecimal(num_calls)
Sample output:
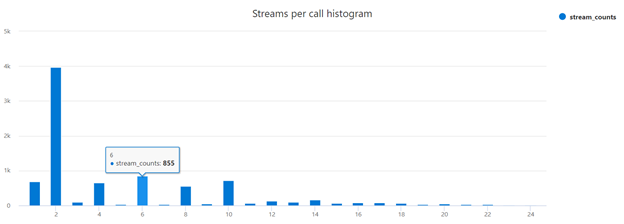
Streams per call histogram
// Distribution of streams per call
ACSCallDiagnostics
| summarize streams_per_call=count() by CorrelationId
| summarize stream_counts=count() by streams_per_call
| order by streams_per_call asc
| render columnchart title="Streams per call histogram"
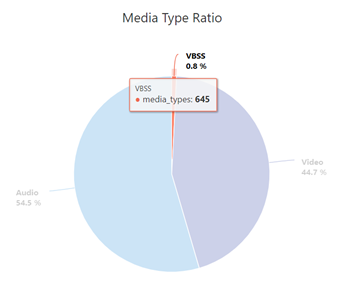
Ratio of media types
// Ratio of media types by call
ACSCallDiagnostics
| summarize media_types=count() by MediaType
| render piechart title="Media Type Ratio"
Quality metrics queries
Average telemetry values
// Average telemetry values over all streams
ACSCallDiagnostics
| summarize Avg_JitterAvg=avg(JitterAvg),
            Avg_JitterMax=avg(JitterMax),
            Avg_RoundTripTimeAvg=avg(RoundTripTimeAvg),
            Avg_RoundTripTimeMax=avg(RoundTripTimeMax),
            Avg_PacketLossRateAvg=avg(PacketLossRateAvg),
            Avg_PacketLossRateMax=avg(PacketLossRateMax)

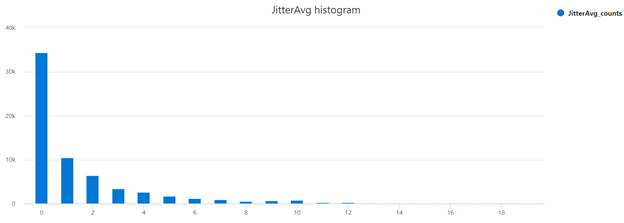
JitterAvg histogram
// Jitter Average Histogram
ACSCallDiagnostics
| where isnotnull(JitterAvg)
| summarize JitterAvg_counts=count() by JitterAvg
| order by JitterAvg asc
| render columnchart with (xcolumn = JitterAvg, title="JitterAvg histogram")
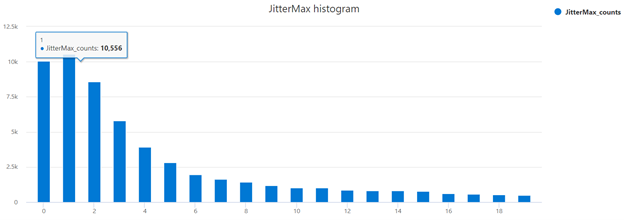
JitterMax histogram
// Jitter Max Histogram
ACSCallDiagnostics
| where isnotnull(JitterMax)
|summarize JitterMax_counts=count() by JitterMax
| order by JitterMax asc
| render columnchart with (xcolumn = JitterMax, title="JitterMax histogram")
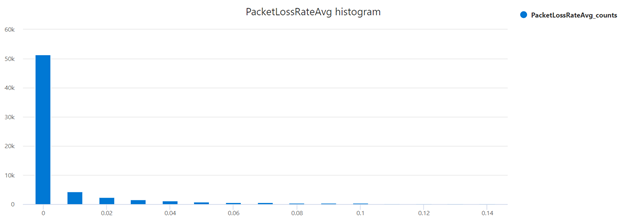
PacketLossRateAvg histogram
// PacketLossRate Average Histogram
ACSCallDiagnostics
| where isnotnull(PacketLossRateAvg)
|summarize PacketLossRateAvg_counts=count() by bin(PacketLossRateAvg, 0.01)
| order by PacketLossRateAvg asc
| render columnchart with (xcolumn = PacketLossRateAvg, title="PacketLossRateAvg histogram")
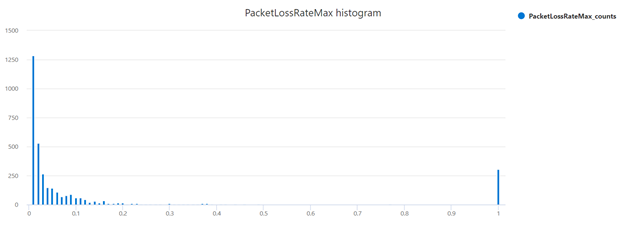
PacketLossRateMax histogram
// PacketLossRate Max Histogram
ACSCallDiagnostics
| where isnotnull(PacketLossRateMax)
|summarize PacketLossRateMax_counts=count() by bin(PacketLossRateMax, 0.01)
| order by PacketLossRateMax asc
| render columnchart with (xcolumn = PacketLossRateMax, title="PacketLossRateMax histogram")
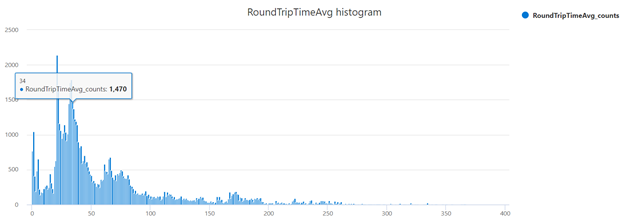
RoundTripTimeAvg histogram
// RoundTripTime Average Histogram
ACSCallDiagnostics
| where isnotnull(RoundTripTimeAvg)
|summarize RoundTripTimeAvg_counts=count() by RoundTripTimeAvg
| order by RoundTripTimeAvg asc
| render columnchart with (xcolumn = RoundTripTimeAvg, title="RoundTripTimeAvg histogram")
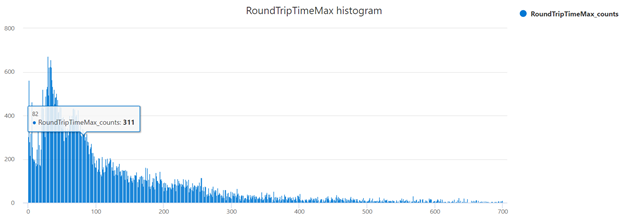
RoundTripTimeMax histogram
// RoundTripTime Max Histogram
ACSCallDiagnostics
| where isnotnull(RoundTripTimeMax)
|summarize RoundTripTimeMax_counts=count() by RoundTripTimeMax
| order by RoundTripTimeMax asc
| render columnchart with (xcolumn = RoundTripTimeMax, title="RoundTripTimeMax histogram")
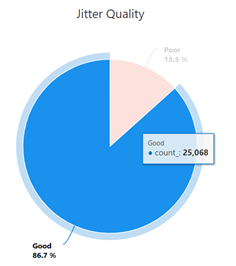
Poor Jitter Quality
// Get proportion of calls with poor quality jitter
// (defined as jitter being higher than 30ms)
ACSCallDiagnostics
| extend JitterQuality = iff(JitterAvg > 30, "Poor", "Good")
| summarize count() by JitterQuality
| render piechart title="Jitter Quality"
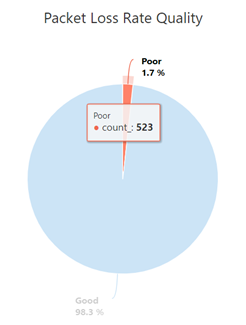
PacketLossRate Quality
// Get proportion of calls with poor quality packet loss
// rate (defined as packet loss being higher than 10%)
ACSCallDiagnostics
| extend PacketLossRateQuality = iff(PacketLossRateAvg > 0.1, "Poor", "Good")
| summarize count() by PacketLossRateQuality
| render piechart title="Packet Loss Rate Quality"
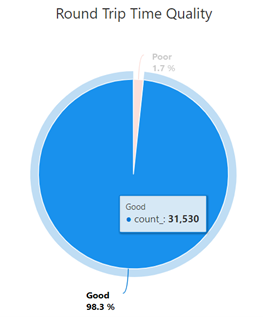
RoundTripTime Quality
// Get proportion of calls with poor quality packet loss
// rate (defined as packet loss being higher than 10%)
ACSCallDiagnostics
| extend PacketLossRateQuality = iff(PacketLossRateAvg > 0.1, "Poor", "Good")
| summarize count() by PacketLossRateQuality
| render piechart title="Packet Loss Rate Quality"
Parameterizable Queries
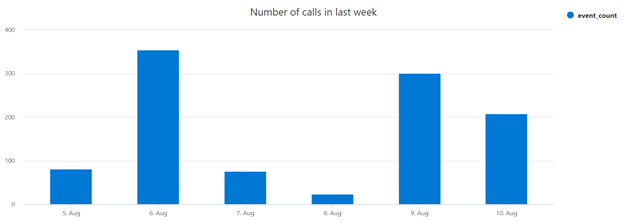
Daily calls in the last week
// Histogram of daily calls over the last week
ACSCallSummary
| where CallStartTime > now() - 7d
| distinct CorrelationId, CallStartTime
| extend hour  = floor(CallStartTime, 1d)
| summarize event_count=count() by day
| sort by day asc
| render columnchart title="Number of calls in last week"
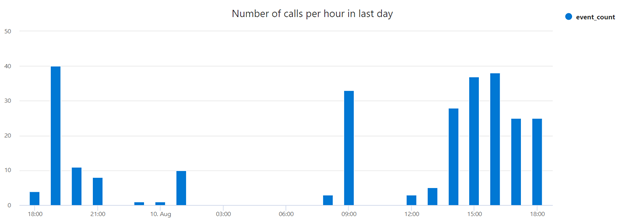
Calls per hour in last day
// Histogram of calls per hour in the last day
ACSCallSummary
| where CallStartTime > now() - 1d
| distinct CorrelationId, CallStartTime
| extend hour = floor(CallStartTime, 1h)
| summarize event_count=count() by hour
| sort by hour asc
| render columnchart title="Number of calls per hour in last day"
Feedback
Coming soon: Throughout 2024 we will be phasing out GitHub Issues as the feedback mechanism for content and replacing it with a new feedback system. For more information see: https://aka.ms/ContentUserFeedback.
Submit and view feedback for