Solution for supply chain traceability using the Azure Cosmos DB for Gremlin
APPLIES TO:
![]() Gremlin
Gremlin
This article provides an overview of the traceability graph solution implemented by Infosys. This solution uses the Azure Cosmos DB for Gremlin and other Azure capabilities to provide a track-and-trace capability for finished goods in global supply chains.
In this article, you'll learn:
- What traceability is in the context of a supply chain.
- The architecture of a global traceability solution delivered through Azure capabilities.
- How the Azure Cosmos DB graph database helps you track intricate relationships between raw materials and finished goods in a global supply chain.
- How Azure integration platform services such as Azure API Management and Event Hubs help you integrate diverse application ecosystems for supply chains.
- How you can get help from Infosys to use this solution for your traceability needs.
Overview
In the food supply chain, traceability is the ability to track and trace a product across the supply chain throughout the product's lifecycle. The supply chain includes supply, manufacturing, and distribution. Traceability is vital for food safety, brand, and regulatory exposure.
In the past, some organizations failed to track and trace products effectively in their supply chains. Results included expensive recalls, fines, and consumer health issues.
Traceability solutions had to address the needs of data harmonization and data ingestion at various velocities and veracities. They also had to follow the inventory cycle. These objectives weren't possible with traditional platforms.
Solution architecture
Supply chain traceability commonly shares patterns in ingesting pallet movements, handing quality incidents, and tracing/analyzing store data. Infosys developed an end-to-end traceability solution that uses Azure application services, integration services, and database services. The solution provides these capabilities:
- Receive streaming data from factories, warehouses, and distribution centers across geographies.
- Ingest and process parallel stock-movement events.
- View a knowledge graph that analyzes relationships between raw materials, production batches, pallets of finished goods, multilevel parent/child relationships of pallets (copack/repack), and movement of goods.
- Access to a user portal with a search capability that includes wildcards and specific keywords.
- Identify impacts of a quality incident, such as affected raw materials, batches, pallets, and locations of pallets.
- Capture the history of events across multiple markets, including product recall information.
The Infosys traceability solution supports cloud-native, API-first, and data-driven capabilities. The following diagram illustrates the architecture of this solution:

The architecture uses the following Azure services to help with specialized tasks:
- Azure Cosmos DB enables you to scale performance up or down elastically. By using the API for Gremlin, you can create and query complex relationships between raw materials, finished goods, and warehouses.
- Azure API Management provides APIs for stock movement events to third-party logistics (3PL) providers and warehouse management systems (WMSs).
- Azure Event Hubs provides the ability to gather large numbers of concurrent events from 3PL providers and WMSs for further processing.
- Azure Functions (through function apps) processes events and ingests data for Azure Cosmos DB by using the API for Gremlin.
- Azure Search enables complex searches and the filtering of pallet information.
- Azure Databricks reads the change feed and creates models in Azure Synapse Analytics for self-service reporting for users in Power BI.
- Azure App Service and its Web Apps feature enable the deployment of a user portal.
- Azure Storage stores archived data for long-term regulatory needs.
Graph database and its data design
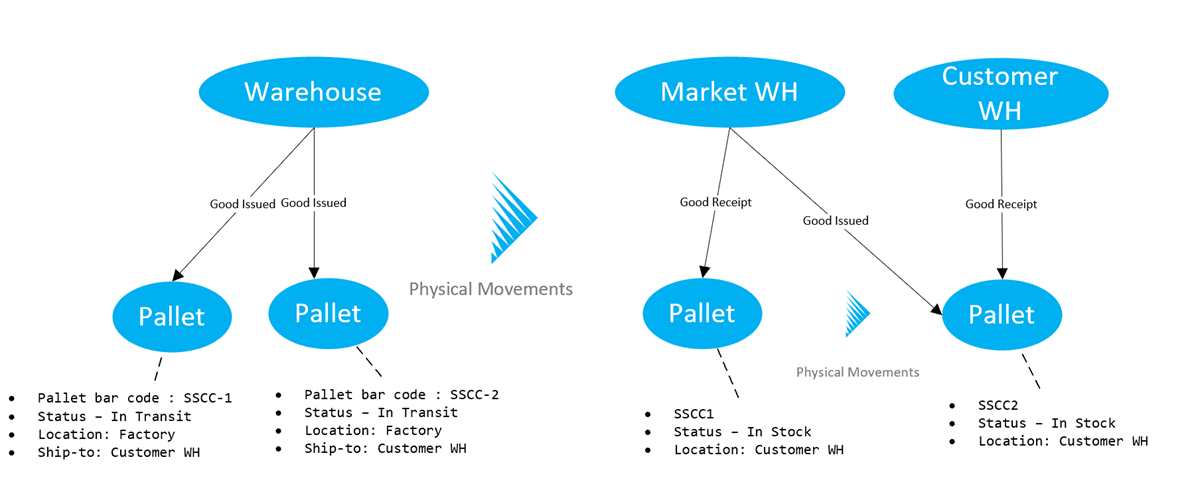
The production and distribution of goods require maintaining a complex and dynamic set of relationships. An adaptive data model in the form of a traceability graph allows storing these relationships through all the steps in the supply chain. Here's a high-level visualization of the process:

The preceding diagram is a simplified view of a complex process. However, getting stock-movement information from the factories and warehouses in real time makes it possible to create an elaborate graph that connects all these disparate pieces of information:
The traceability process starts when the supplier sends raw materials to the factories. The solution creates the initial nodes (vertices) of the graph and relationships (edges).
The finished goods are produced from raw materials and packed into pallets.
The pallets are moved to factory warehouses or market warehouses according to customer orders. The warehouses might be owned by the company or by 3PL providers.
The pallets are shipped to various other warehouses according to customer orders. Depending on customers' needs, child pallets or child-of-child pallets are created to accommodate the ordered quantity.
Sometimes, a whole new item is made by mixing multiple items. For example, in a copack scenario that produces a variety pack, sometimes the same item is repacked to smaller or larger quantities in a different pallet as part of a customer order.
Pallets travel through the supply chain network and eventually reach the customer warehouse. During that process, the pallets can be further broken down or combined with other pallets to produce new pallets to fulfill customer orders.
Eventually, the system creates a complex graph that holds relationship information for quality incident management.
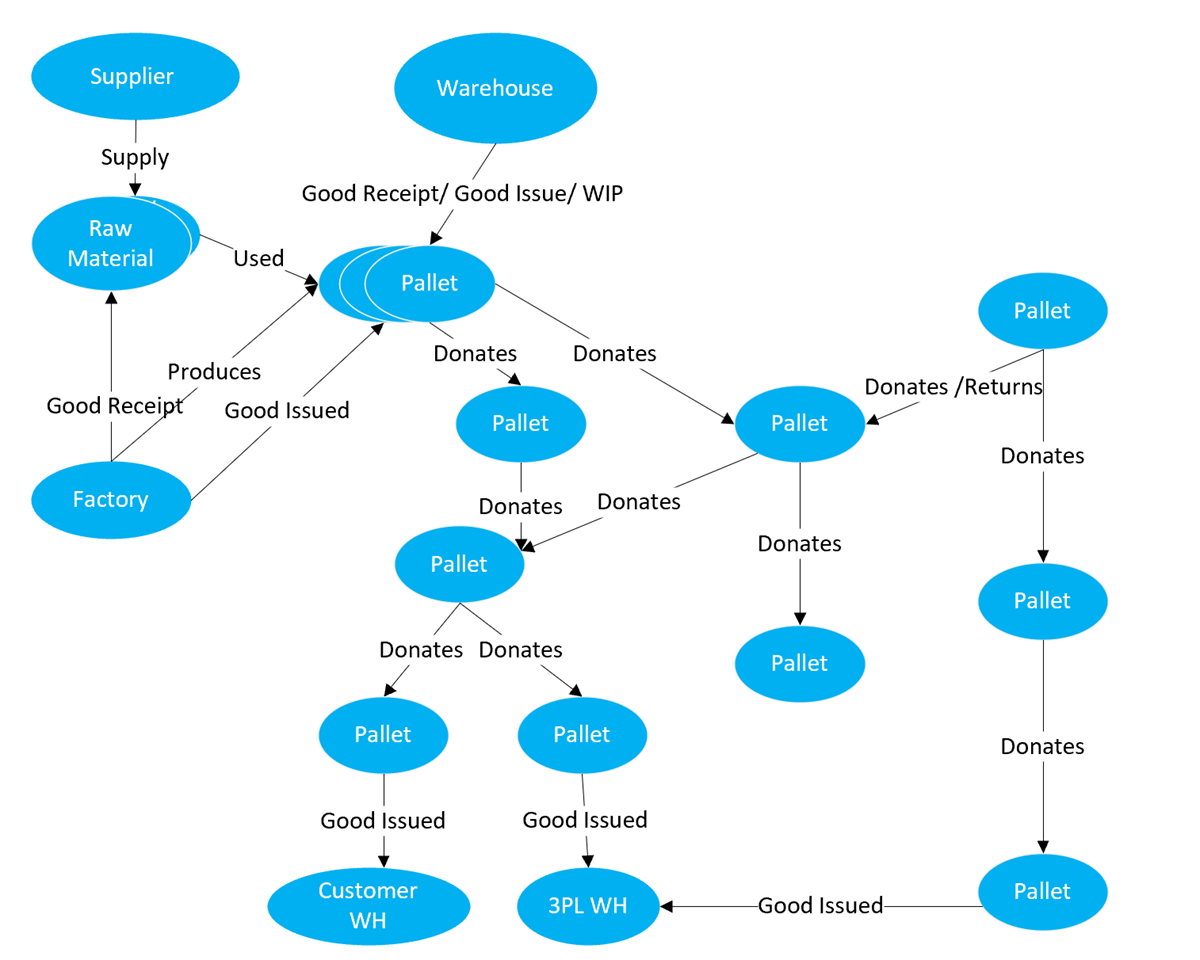
These intricate relationships are vital in a quality incident where the system can track and trace pallets across the supply chain. The graph and its traversals provide the required information for this. For example, if there's an issue with one raw material, the graph can show the affected pallets and the current location.


Next steps
- Learn about Infosys Integrate+ for Azure.
- To visualize graph data, see the API for Gremlin visualization solutions.
- To model your graph data, see the API for Gremlin modeling solutions.
Feedback
Coming soon: Throughout 2024 we will be phasing out GitHub Issues as the feedback mechanism for content and replacing it with a new feedback system. For more information see: https://aka.ms/ContentUserFeedback.
Submit and view feedback for