How to monitor the server-side latency for operations in an Azure Cosmos DB container or account
APPLIES TO:
![]() NoSQL
NoSQL
![]() MongoDB
MongoDB
![]() Cassandra
Cassandra
![]() Gremlin
Gremlin
![]() Table
Table
Azure Monitor for Azure Cosmos DB provides a metrics view to monitor your account and create dashboards. The Azure Cosmos DB metrics are collected by default, this feature doesn't require you to enable or configure anything explicitly. The server-side latency metric direct and server-side latency gateway metrics are used to view the server-side latency of an operation in two different connection modes. Use server-side latency gateway metric if your request operation is in gateway connectivity mode. Use server-side latency direct metric if your request operation is in direct connectivity mode. Azure Cosmos DB provides SLA of less than 10 ms for point read/write operations with direct connectivity. For point read and point write operations, the SLAs are calculated as detailed in the SLA document. For more information about connection mode, see the Connectivity modes article.
The following table indicates which API supports server-side latency metrics (Direct versus Gateway):
| API | Server Side Latency Direct | Server Side Latency Gateway |
|---|---|---|
| SQL | ✓ | ✓ |
| MongoDB | ✓ | |
| Cassandra | ✓ | |
| Gremlin | ✓ | |
| Table | ✓ | ✓ |
You can monitor server-side latency metrics if you see unusually high latency for point operation such as:
- A GET or a SET operation with partition key and ID
- A read or write operation or
- A query
You can look up the diagnostic log to see the size of the data returned. If you see a sustained high latency for query operations, you should look up the diagnostic log for higher throughput or RU/s used. Server side latency shows the amount of time spent on the backend infrastructure before the data was returned to the client. It's important to look at this metric to rule out any backend latency issues.
View the server-side latency metrics
Sign in to the Azure portal.
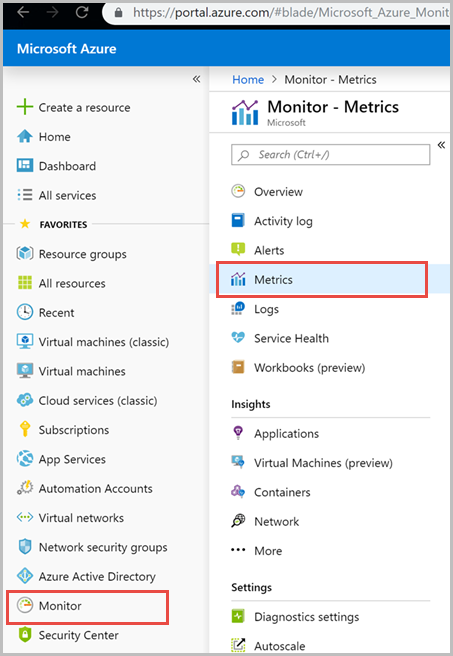
Select Monitor from the left-hand navigation bar and select Metrics.
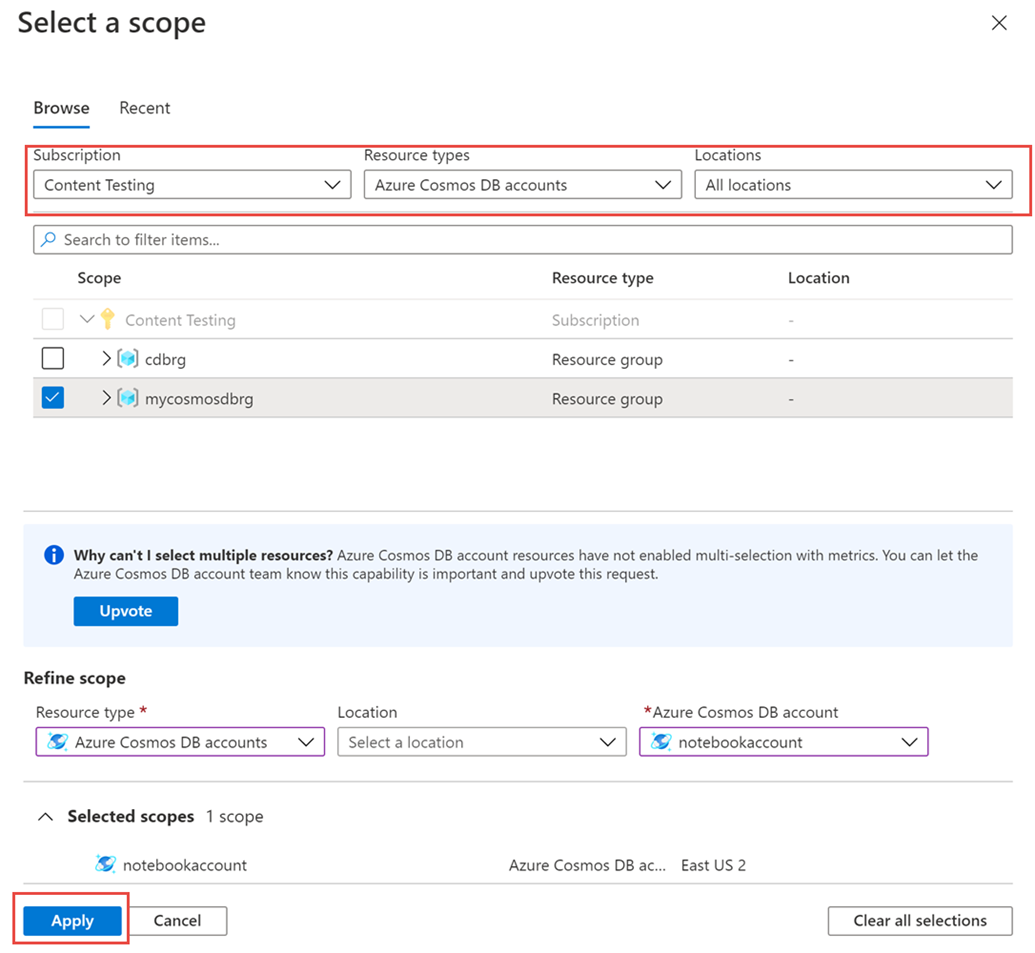
From the Metrics pane > Select a resource > choose the required subscription, and resource group. For the Resource type, select Azure Cosmos DB accounts, choose one of your existing Azure Cosmos DB accounts, and select Apply.
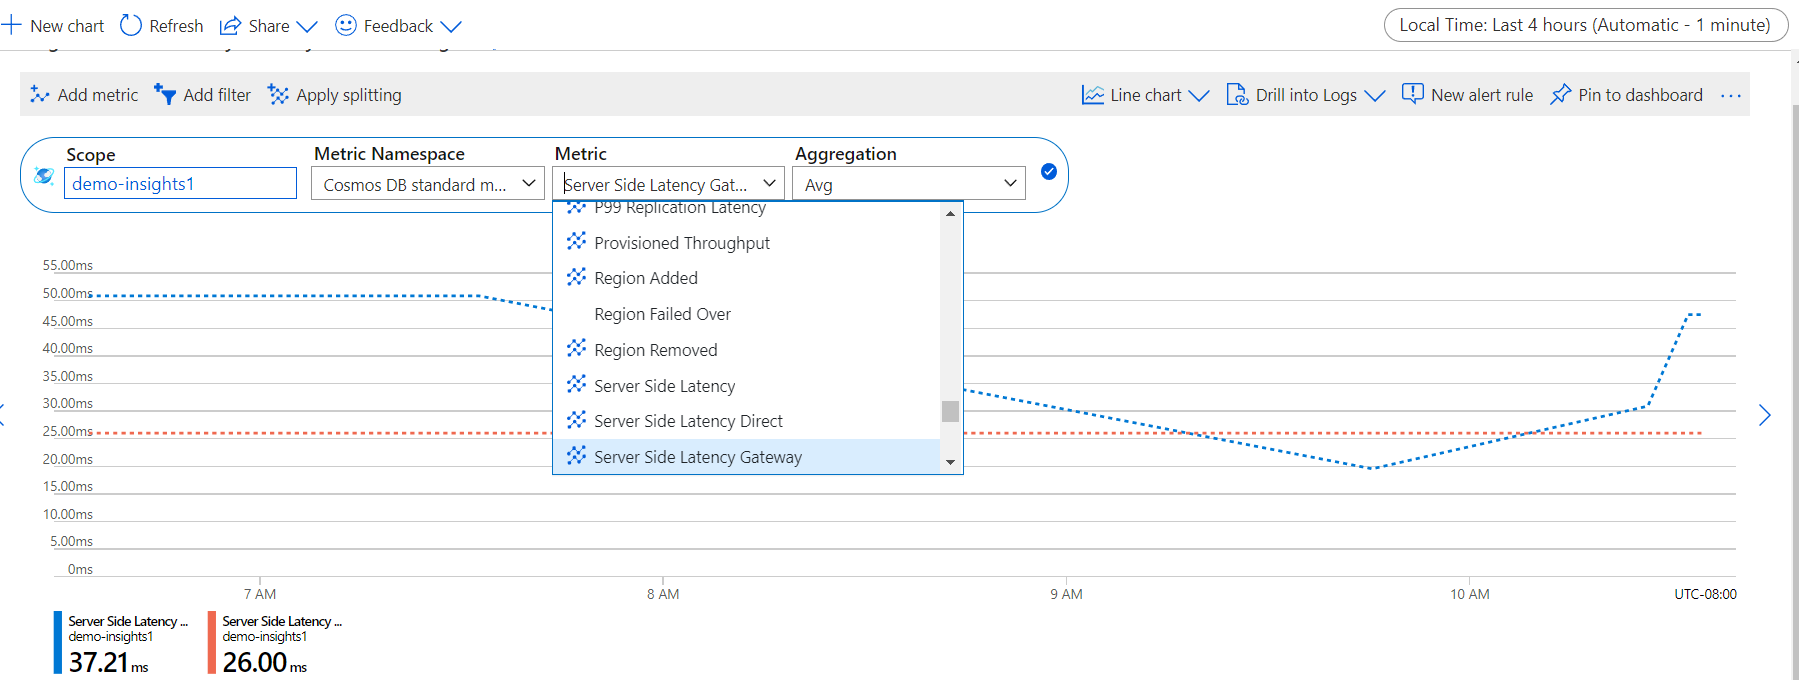
Next select the Server Side Latency Gateway metric from the list of available metrics, if your operation is in gateway connectivity mode. Select the Server Side Latency Direct metric, if your operation is in direct connectivity mode. To learn in detail about all the available metrics in this list, see the Metrics by category article. In this example, let's select Server Side Latency Gateway and Avg as the aggregation value. In addition to these details, you can also select the Time range and Time granularity of the metrics. At max, you can view metrics for the past 30 days. After you apply the filter, a chart is displayed based on your filter. You can see the server-side latency in gateway connectivity mode per 5 minutes for the selected period.

Filters for server-side latency
You can also filter metrics and get the charts displayed by a specific CollectionName, DatabaseName, OperationType, Region, and PublicAPIType.
To filter the metrics, select Add filter and choose the required property such as PublicAPIType and select the value Sql. Select Apply splitting for OperationType. The graph then displays the server-side latency for different operations in gateway connection mode during the selected period. The operations executed via Stored procedure aren't logged so they aren't available under the OperationType metric.
The Server Side Latency Gateway metrics for each operation are displayed as shown in the following image:

You can also group the metrics by using the Apply splitting option.
Note
Requests coming into Azure Cosmos DB don’t always target a container. For example, you could create a database inside a globally distributed account and the request will still be recorded for the server-side latency metric. The request is recorded because it does take time to create a database resource, but it does not target a container. If you see that the value of the CollectionName metric is <empty>, this means that the target is not a container, but another resource in Azure Cosmos DB.
As a workaround, you can proactively filter your metrics to a specific container (CollectionName) to exclude requests that aren't specific to the container that's the subject of your query.
Next steps
- Monitor Azure Cosmos DB data by using diagnostic settings in Azure.
- Audit Azure Cosmos DB control plane operations
Feedback
Coming soon: Throughout 2024 we will be phasing out GitHub Issues as the feedback mechanism for content and replacing it with a new feedback system. For more information see: https://aka.ms/ContentUserFeedback.
Submit and view feedback for