View amortized benefit costs
This article helps you understand what amortized costs are and how to view them in cost analysis. For simplicity, this article refers to a reservation or savings plan as a benefit. When you buy a benefit, you're normally committing to a one-year or three-year plan to save money compared to pay-as-you-go costs. You can choose to pay for the benefit up front or with monthly payments. If you pay up front, the one-time payment is charged to your subscription. If your organization needs to charge back or show back partial costs of the benefit to users or departments that use it, then you might need to determine what the monthly or daily cost of the benefit is. Amortization is the process of breaking the one-time cost into periodic costs.
However, if your organization doesn't charge back or show back benefit use to the users or departments that use them, then you might not need to worry about amortized costs.
The examples in the article use a reservation. However, the same logic applies to a savings plan.
How Azure calculates amortized costs
To understand how amortized costs are shown in cost analysis for reservations, let's look at some examples.
First, let's look at a one-year virtual machine reservation that was purchased on January 1. Depending on your view, instead of seeing a $365 purchase on January 1, 2022, you'll see a $1.00 purchase every day from January 1, 2022 to December 31, 2022. In addition to basic amortization, the costs are also reallocated and associated to the specific resources that used the reservation. For example, if the $1.00 daily charge was split between two virtual machines, you'd see two $0.50 charges for the day. If part of the reservation isn't utilized for the day, you'd see one $0.50 charge associated with the applicable virtual machine and another $0.50 charge with a charge type of UnusedReservation. Unused reservation costs can be seen only when viewing amortized cost.
Now, let's look at a one-year reservation purchased at some other point in a month. For example, if you buy a reservation on May 26, 2022 with a monthly or upfront payment, the amortized cost is divided by 365 (assuming it's not a leap year) and spread from May 26, 2022 through May 25, 2023. In this example, the daily cost would be the same for every day. However, the monthly cost varies because of the varying number of days in a month. Also, if the reservation period includes a leap year, costs for the leap year get divided evenly by 366.
Because of the change in how costs are represented, it's important to note that actual cost and amortized cost views show different total numbers. Depending on your view in Cost analysis, the total cost of months with a reservation purchase decreases when viewing amortized costs, and months following a reservation purchase increase. Amortization is available only for reservation purchases and doesn't apply to Azure Marketplace purchases currently.
Although the preceding example shows how to calculate amortized costs for a reservation, the same logic applies to a savings plan. The only difference is that you use the charge type of UnusedSavingsPlan instead of UnusedReservation.
Metrics affect how costs are shown
In Cost analysis, you view costs with a metric. They include Actual cost and Amortized cost. Each metric affects how data is shown for your benefit charges.
Actual cost - Shows the purchase as it appears on your bill. For example, if you bought a one-year reservation for $1200 in January 2022 and you paid for the entire purchase cost upfront, then cost analysis shows a $1200 cost in the month of January for the reservation. It doesn't show a reservation cost for other months of the year. However, if you're paying the reservation on a monthly basis, then you see this recurring cost on the monthly anniversary date. If you group your actual costs by VM, then a VM that received the reservation benefit for a given month would have zero cost for the month.
Amortized cost - Shows a reservation purchase split as an amortized cost over the duration of the reservation term. With the same previous example, cost analysis shows a different amount for each month depending on the number of days in the month. If you group costs by VM in this example, you'd see cost attributed to each VM that received the reservation benefit. However, unused reservation costs aren't attributed to the subscription used to buy the reservation because the unused portion isn't attributable to any specific resource or subscription. Similarly, unused saving plan costs aren't attributed to the subscription used to buy the saving plan.
View amortized costs
By default, cost analysis shows charges as they appear on your bill. The charges are shown as actual costs or amortized over the course of your benefit period.
Note
You can buy a reservation with a pay-as-you-go (MS-AZR-0003P) subscription. However, Cost Analysis doesn't support viewing amortized reservation costs for a pay-as-you-go subscription.
Amortized costs are available only for reservations and savings plans. They aren't available for Azure Marketplace purchases. However, virtual machine software usage reservations available in the Azure Marketplace are supported.
Depending on the view you use in cost analysis, you see different benefit costs. For example:
When you use the DailyCosts view with a date filter applied, you easily see when a benefit was purchased with an increase in actual daily costs. If you try to view costs with the Amortized cost metric, you see the same results as Actual Cost.
Let's look at an example one-year benefit purchased for $12,016.00, purchased on October 23, 2019. The term ends on October 23, 2020, and a leap year day is included in the term, so the term's duration is 366 days.
Although the following example shows a reservation, the same logic applies to a savings plan. The only difference is that you use PricingModel: SavingsPlan instead of Pricing Model: Reservation.
In the Azure portal, navigate to cost analysis for your scope. For example, Cost Management > Cost analysis.
- Select a date range that includes a period of the benefit term.
- Add a filter for Pricing Model: Reservation to see only reservation costs.
- Then, set Granularity to Daily. Here's an example showing the purchase with the date range set from October through November 2019.
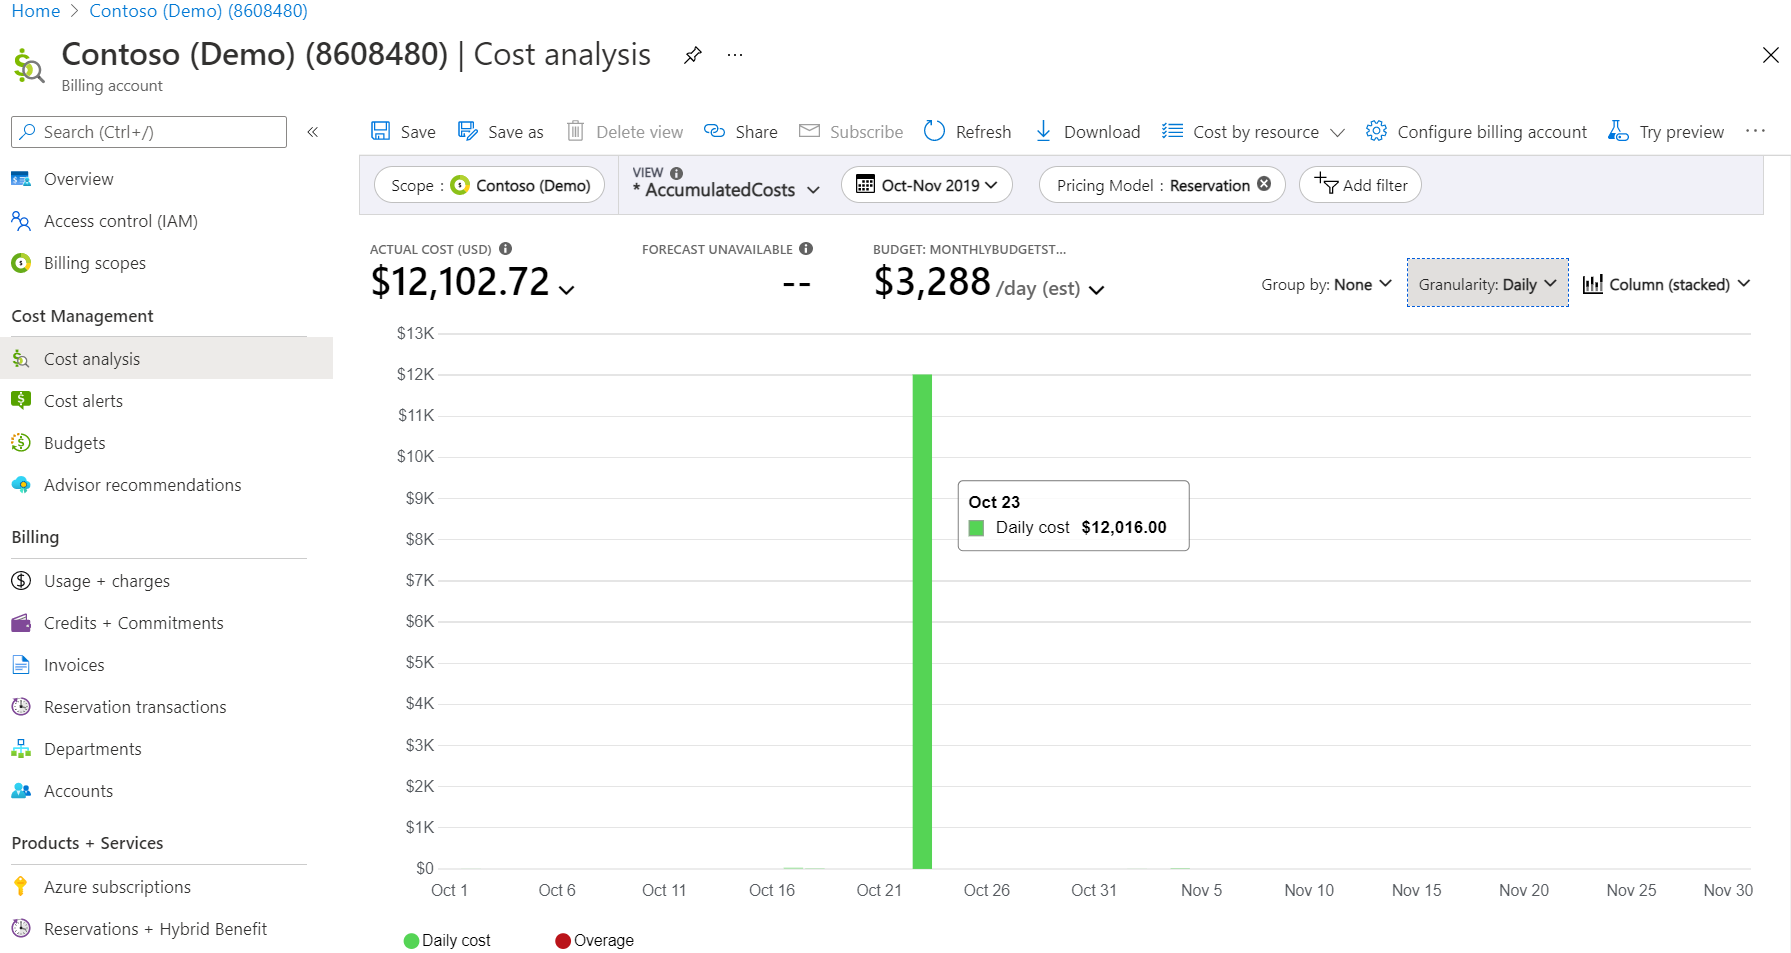
- Under Scope and next to the cost shown, select the down arrow symbol and then select Amortized cost metric. Here's an example showing the daily cost of all reservations for the selected date range. For the highlighted day, the daily cost is about $37.90. Azure accounts for costs to further decimal places, but only shows costs to two decimal places.

- If you have multiple reservations (the previous example does), then use the Group by list to group the results by Reservation name. Here's an example showing the daily amortized cost of the reservation named
VM_WUS_DS3_Upfrontfor $32.83. In this example, Azure determined the cost by: $12,016 / 366 = $32.83 per day. Because the reservation term includes a leap year (2020), 366 is used to divide the total cost, not 365.

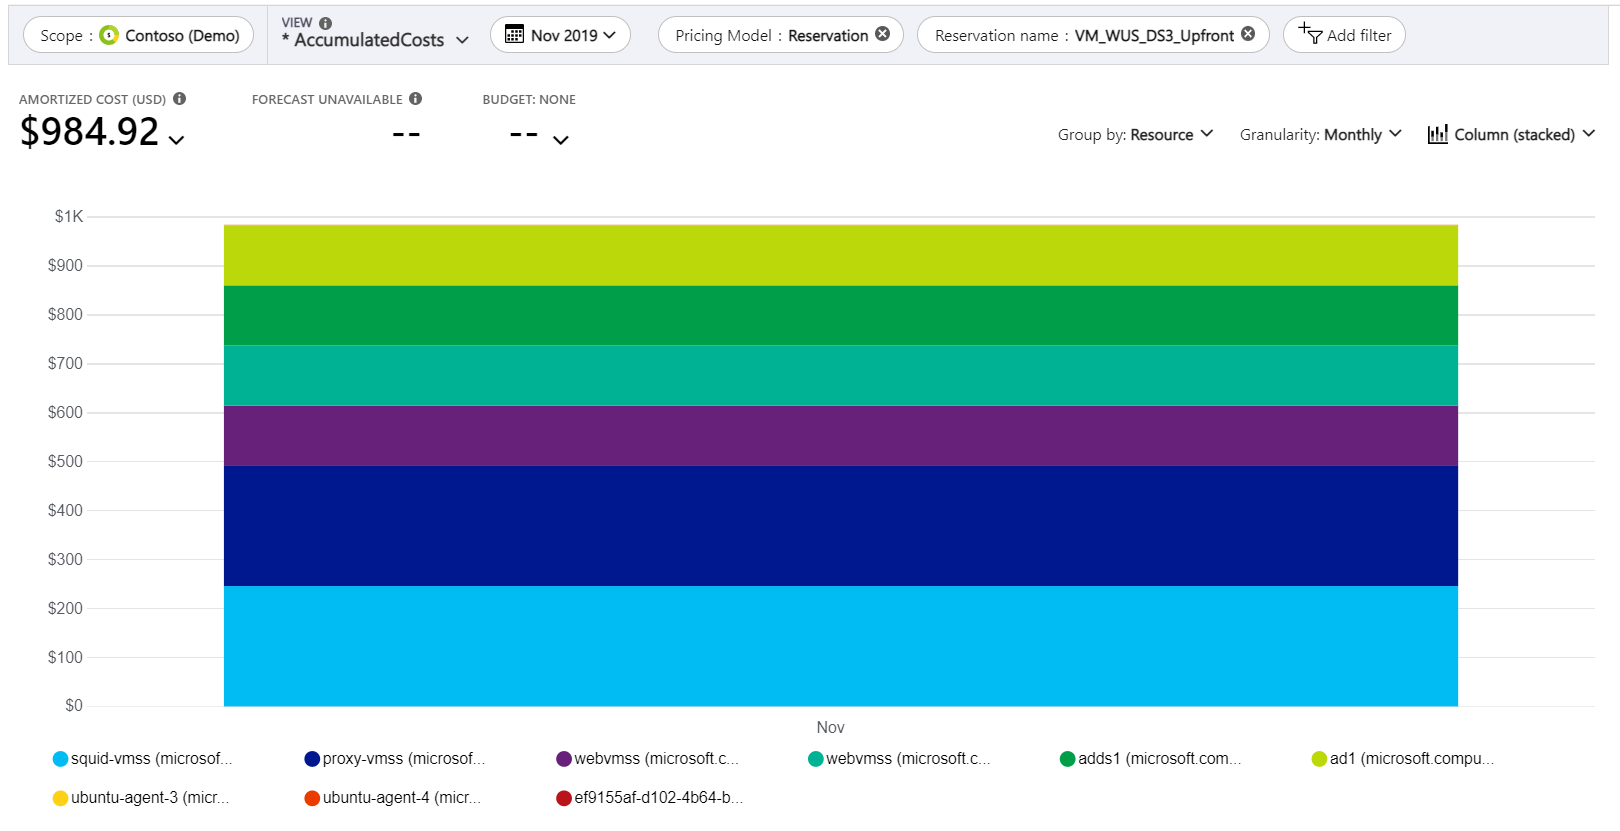
- Next, change the Granularity to Monthly and expand the date range. The following example shows varying monthly costs for reservations. The cost varies because the number of days in each month differs. November has 30 days, so the daily cost of $32.83 * 30 = ~$984.90.


View benefit resource amortized costs
To charge back or show back costs for a benefit, you need to know which resources used the benefit. Use the following steps to see amortized costs for individual resources. In this example, we examine November 2019, which was the first month of full reservation use.
- Select a date range in the benefit term where you want to view resources that used the benefit.
- Add a filter for Pricing Model: Reservation to see only reservation costs.
- Set Granularity to Monthly.
- Under Scope and next to the cost shown, select the down arrow symbol and then select the Amortized cost metric.
- If you have multiple reservations, use the Group by list to group the results by Reservation name.
- In the chart, select a reservation. A filter is added for the reservation name.
- In the Group by list, select Resource. The chart shows the resources that used the reservation. In the following example image, November 2019 had eight resources that used the reservation. There's one unused item, which is the subscription that was used to buy the reservation.
- To see the cost more easily for individual resources, select Table in the chart list. Expand items as needed. Here's an example for November 2019 showing the amortized reservation costs for the eight resources that used the reservation. The highlighted cost is the unused portion of the reservation.


Another easy way to view reservation amortized cost is to use the Reservations view. To easily navigate to it, in Cost analysis in the top menu select Views, and then select the Reservations smart view.

Next steps
- To learn more about charge back processes for reservations, read Charge back Azure Reservation costs.
- To learn more about charge back processes for savings-plans, read Charge back Azure saving plan costs.
Feedback
Coming soon: Throughout 2024 we will be phasing out GitHub Issues as the feedback mechanism for content and replacing it with a new feedback system. For more information see: https://aka.ms/ContentUserFeedback.
Submit and view feedback for