Plan to manage costs for Azure Data Factory
APPLIES TO:  Azure Data Factory
Azure Synapse Analytics
Azure Data Factory
Azure Synapse Analytics
Tip
Try out Data Factory in Microsoft Fabric, an all-in-one analytics solution for enterprises. Microsoft Fabric covers everything from data movement to data science, real-time analytics, business intelligence, and reporting. Learn how to start a new trial for free!
This article describes how you plan for and manage costs for Azure Data Factory.
First, at the beginning of the ETL project, you use a combination of the Azure pricing and per-pipeline consumption and pricing calculators to help plan for Azure Data Factory costs before you add any resources for the service to estimate costs. Next, as you add Azure resources, review the estimated costs. After you've started using Azure Data Factory resources, use Cost Management features to set budgets and monitor costs. You can also review forecasted costs and identify spending trends to identify areas where you might want to act. Costs for Azure Data Factory are only a portion of the monthly costs in your Azure bill. Note that this article only explains how to plan for and manage costs for data factory. You're billed for all Azure services and resources used in your Azure subscription, including the third-party services.
Prerequisites
Cost analysis in Cost Management supports most Azure account types, but not all of them. To view the full list of supported account types, see Understand Cost Management data. To view cost data, you need at least read access for an Azure account. For information about assigning access to Azure Cost Management data, see Assign access to data.
Estimate costs before using Azure Data Factory
Use the ADF pricing calculator to get an estimate of the cost of running your ETL workload in Azure Data Factory. To use the calculator, you have to input details such as number of activity runs, number of data integration unit hours, type of compute used for Data Flow, core count, instance count, execution duration, and etc.
One of the commonly asked questions for the pricing calculator is what values should be used as inputs. During the proof-of-concept phase, you can conduct trial runs using sample datasets to understand the consumption for various ADF meters. Then based on the consumption for the sample dataset, you can project out the consumption for the full dataset and operational schedule.
Note
The prices used in this example below are hypothetical and are not intended to imply actual pricing.
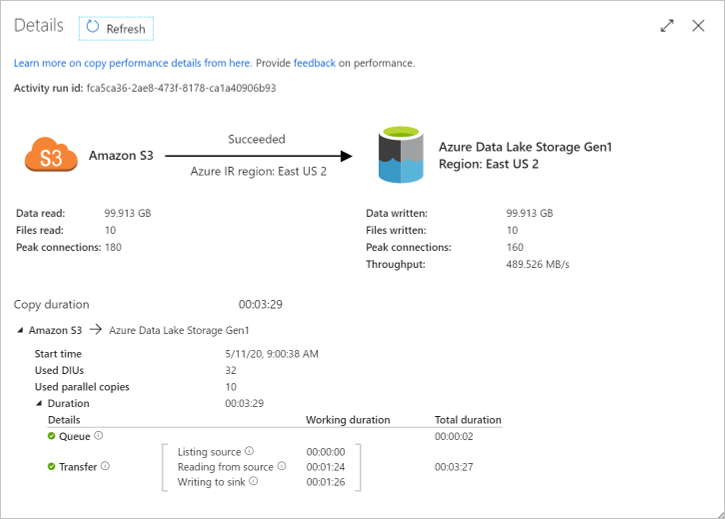
For example, let’s say you need to move 1 TB of data daily from AWS S3 to Azure Data Lake Gen2. You can perform POC of moving 100 GB of data to measure the data ingestion throughput and understand the corresponding billing consumption.
Here's a sample copy activity run detail (your actual mileage will vary based on the shape of your specific dataset, network speeds, egress limits on S3 account, ingress limits on ADLS Gen2, and other factors).
By using the consumption monitoring at pipeline-run level, you can see the corresponding data movement meter consumption quantities:
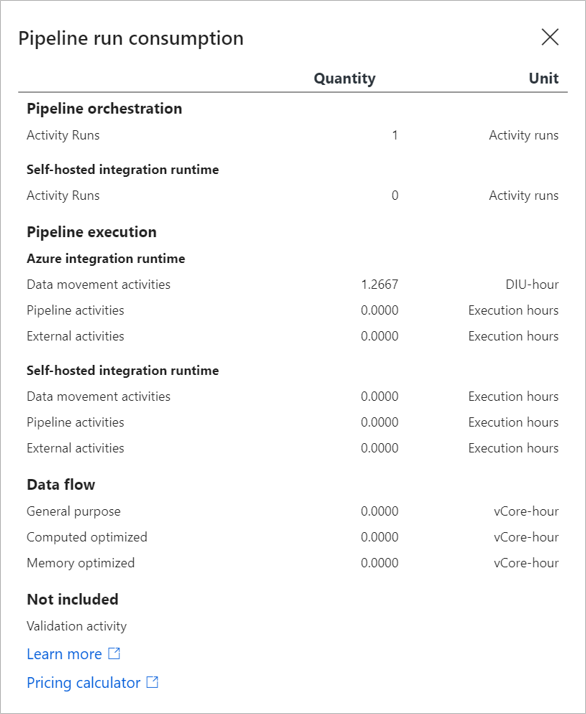
Therefore, the total number of DIU-hours it takes to move 1 TB per day for the entire month is:
1.2667 (DIU-hours) * (1 TB / 100 GB) * 30 (days in a month) = 380 DIU-hours
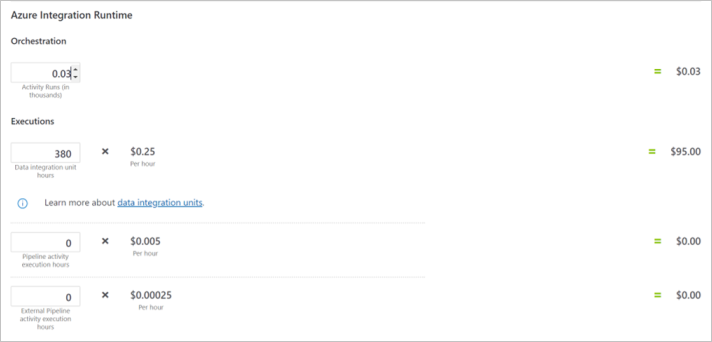
Now you can plug 30 activity runs and 380 DIU-hours into ADF pricing calculator to get an estimate of your monthly bill:
Understand the full billing model for Azure Data Factory
Azure Data Factory runs on Azure infrastructure that accrues costs when you deploy new resources. It's important to understand that other extra infrastructure costs might accrue.
How you're charged for Azure Data Factory
Azure Data Factory is a serverless and elastic data integration service built for cloud scale. There isn't a fixed-size compute that you need to plan for peak load; rather you specify how much resource to allocate on demand per operation, which allows you to design the ETL processes in a much more scalable manner. In addition, ADF is billed on a consumption-based plan, which means you only pay for what you use.
When you create or use Azure Data Factory resources, you might get charged for the following meters:
- Orchestration Activity Runs - You're charged for it based on the number of activity runs orchestrate.
- Data Integration Unit (DIU) Hours - For copy activities run on Azure Integration Runtime, you're charged based on number of DIU used and execution duration.
- vCore Hours - for data flow execution and debugging, you're charged for based on compute type, number of vCores, and execution duration.
At the end of your billing cycle, the charges for each meter are summed. Your bill or invoice shows a section for all Azure Data Factory costs. There's a separate line item for each meter.
Other costs that might accrue with Azure Data Factory
When you create resources for Azure Data Factory (ADF), resources for other Azure services are also created. They include:
- Pipeline Activity execution
- External Pipeline Activity execution
- Creation/editing/retrieving/monitoring of data factory artifacts
- SSIS Integration Runtime (IR) duration based on instance type and duration
Note
You can assign the same tag to your ADF and other Azure resources, putting them into the same category to view their consolidated billing. ADF tag will be inherited by all SSIS IRs in it. If you change your ADF tag, you need to stop and restart all SSIS IRs in it for them to inherit the new tag, see Reconfigure SSIS IR section.
Using Azure Prepayment with Azure Data Factory
You can pay for Azure Data Factory charges with your Azure Prepayment credit. However, you can't use Azure Prepayment credit to pay for charges for third party products and services including those from the Azure Marketplace.
Monitor costs
Azure Data Factory costs can be monitored at the factory, pipeline, pipeline-run and activity-run levels.
Monitor costs at factory level with Cost Analysis
As you use Azure resources with Data Factory, you incur costs. Azure resource usage unit costs vary by time intervals (seconds, minutes, hours, and days) or by unit usage (bytes, megabytes, and so on.) As soon as Data Factory use starts, costs are incurred and you can see the costs in cost analysis.
When you use cost analysis, you view Data Factory costs in graphs and tables for different time intervals. Some examples are by day, current and prior month, and year. You also view costs against budgets and forecasted costs. Switching to longer views over time can help you identify spending trends. And you see where overspending might have occurred. If you've created budgets, you can also easily see where they're exceeded.
To view Data Factory costs in cost analysis:
- Sign in to the Azure portal.
- Open the scope in the Azure portal and select Cost analysis in the menu. For example, go to Subscriptions, select a subscription from the list, and then select Cost analysis in the menu. Select Scope to switch to a different scope in cost analysis.
- By default, cost for services are shown in the first donut chart. Select the area in the chart labeled Azure Data Factory v2.
Actual monthly costs are shown when you initially open cost analysis. Here's an example showing all monthly usage costs.
- To narrow costs for a single service, like Data Factory, select Add filter and then select Service name. Then, select Azure Data Factory v2.
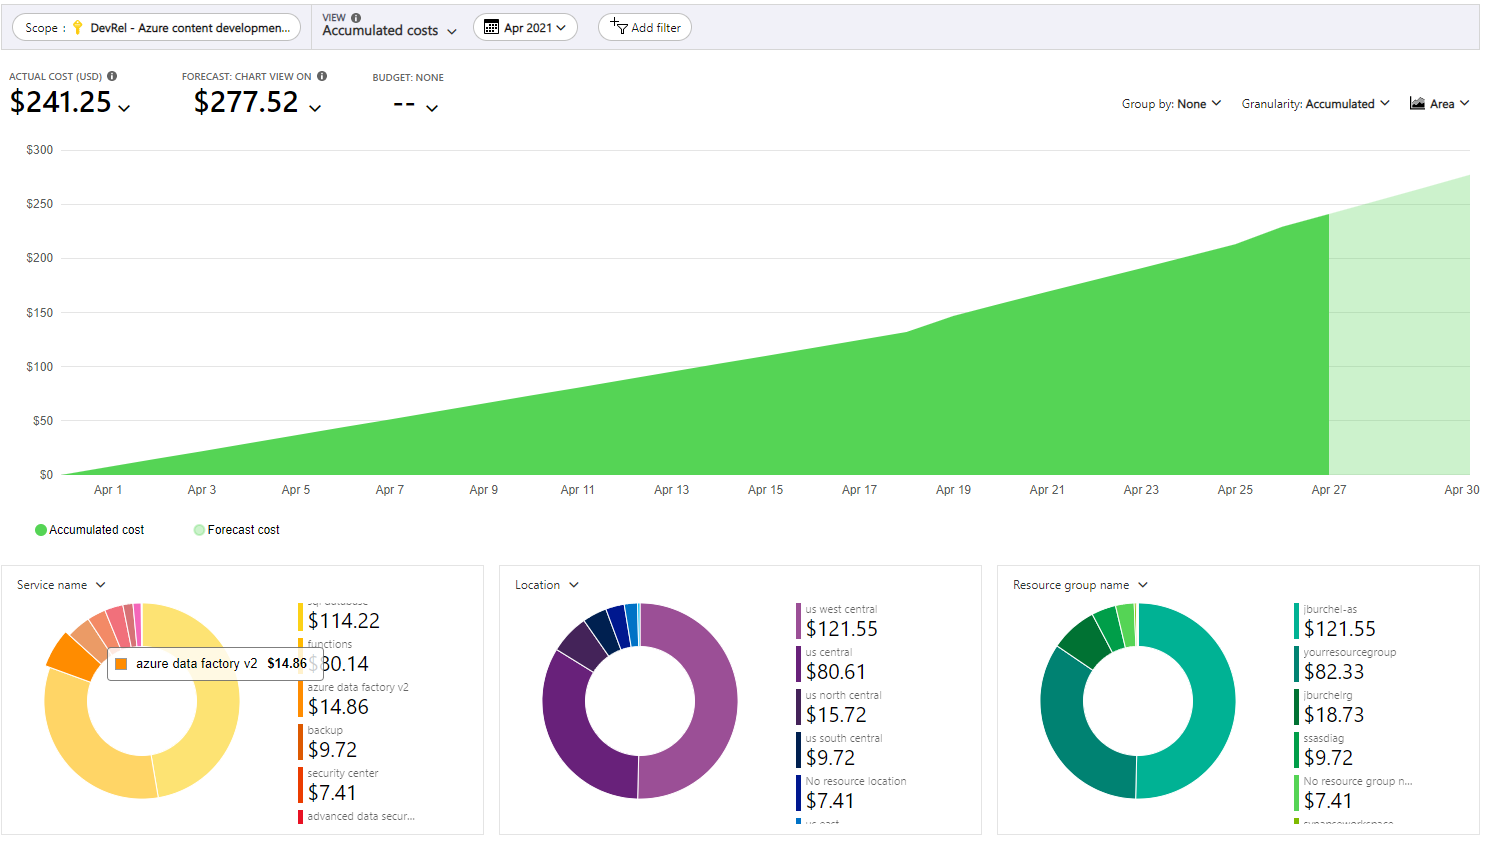
Here's an example showing costs for just Data Factory.

In the preceding example, you see the current cost for the service. Costs by Azure regions (locations) and Data Factory costs by resource group are also shown. From here, you can explore costs on your own.
Monitor costs at pipeline level with Cost Analysis
In certain cases, you may want a granular breakdown of cost of operations within our factory, for instance, for charge back purposes. Integrating Azure Billing cost analysis platform, Data Factory can separate out billing charges for each pipeline. By opting in Azure Data Factory detailed billing reporting for a factory, you can better understand how much each pipeline is costing you, within the aforementioned factory.
You need to opt in for each factory that you want detailed billing for. To turn on per pipeline detailed billing feature,
- Go to Azure Data Factory portal
- Under Manage tab, select Factory setting in General section
- Select Showing billing report by pipeline
- Publish the change

Note
The detailed pipeline billing settings is not included in the exported ARM templates from your factory. That means Continuous Integration and Delivery (CI/CD) will not overwrite billing behaviors for the factory. This allows you to set different billing behaviors for development, test, and production factories.
Once the feature is enabled, each pipeline will have a separate entry in our Billing report: It shows exactly how much each pipeline costs, in the selected time interval. It allows you to identify spending trends, and notice overspending, if any occurred.
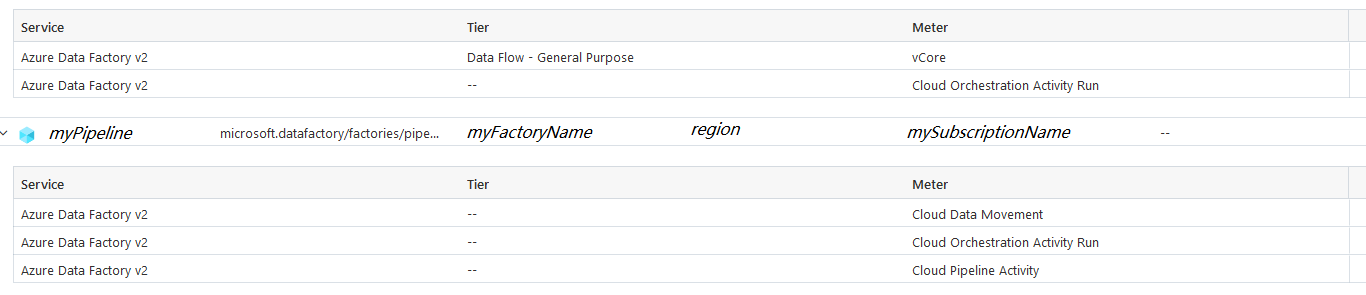
Using the graphing tools of Cost Analysis, you get similar charts and trends lines as shown above, but for individual pipelines. You also get the summary view by factory name, as factory name is included in billing report, allowing for proper filtering when necessary.
The change only impacts how bills are emitted going forward, and does not change past charges. Please give some time before the change populate to billing report: typically, the change is reflected within 1 day.
Warning
By opting in the per billing setting, there will be one entry for each pipeline in your factory. Please be particularly aware if you have excessive amount of pipelines in the factory, as it may significantly lengthen and complicate your billing report.
Limitations
Following are known limitations of per pipeline billing features. These billing meters won't file under the pipeline that spins it, but instead will file under a fall-back line item for your factory.
- Data Factory Operations charges, including Read/Write and Monitoring
- Charges for Azure Data Factory SQL Server Integration Services (SSIS) nodes
- If you have Time to Live (TTL) configured for Azure Integration Runtime (Azure IR), Data Flow activities run on these IR won't file under individual pipelines.
Monitor consumption at pipeline-run level in Azure Data Factory
Depending on the types of activities you have in your pipeline, how much data you're moving and transforming, and the complexity of the transformation, executing a pipeline will spin different billing meters in Azure Data Factory.
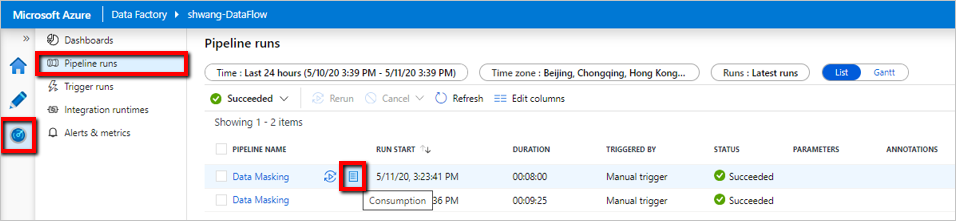
You can view the amount of consumption for different meters for individual pipeline runs in the Azure Data Factory user experience. To open the monitoring experience, select the Monitor & Manage tile in the data factory blade of the Azure portal. If you're already in the ADF UX, select on the Monitor icon on the left sidebar. The default monitoring view is list of pipeline runs.
Clicking the Consumption button next to the pipeline name will display a pop-up window showing you the consumption for your pipeline run aggregated across all of the activities within the pipeline.

The pipeline run consumption view shows you the amount consumed for each ADF meter for the specific pipeline run, but it doesn't show the actual price charged, because the amount billed to you is dependent on the type of Azure account you have and the type of currency used. To view the full list of supported account types, see Understand Cost Management data.
Monitor consumption at activity-run level in Azure Data Factory
Once you understand the aggregated consumption at pipeline-run level, there are scenarios where you need to further drill down and identify which is the most costly activity within the pipeline.
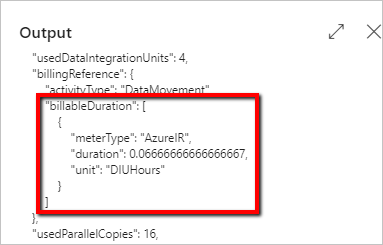
To see the consumption at activity-run level, go to your data factory Author & Monitor UI. From the Monitor tab where you see a list of pipeline runs, select the pipeline name link to access the list of activity runs in the pipeline run. Select on the Output button next to the activity name and look for billableDuration property in the JSON output:
Here's a sample out from a copy activity run:
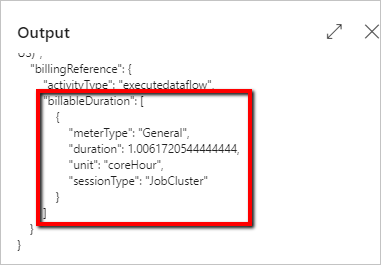
And here's a sample out from a Mapping Data Flow activity run:
Create budgets
You can create budgets to manage costs and create alerts that automatically notify stakeholders of spending anomalies and overspending risks. Alerts are based on spending compared to budget and cost thresholds. Budgets and alerts are created for Azure subscriptions and resource groups, so they're useful as part of an overall cost monitoring strategy.
Budgets can be created with filters for specific resources or services in Azure if you want more granularity present in your monitoring. Filters help ensure that you don't accidentally create new resources that cost you extra money. For more information about the filter options available when you create a budget, see Group and filter options.
Export cost data
You can also export your cost data to a storage account. This is helpful when you need or others to do other data analysis for costs. For example, finance teams can analyze the data using Excel or Power BI. You can export your costs on a daily, weekly, or monthly schedule and set a custom date range. Exporting cost data is the recommended way to retrieve cost datasets.
Related content
- Learn how to optimize your cloud investment with Azure Cost Management.
- Learn more about managing costs with cost analysis.
- Learn about how to prevent unexpected costs.
- Take the Cost Management guided learning course.
- Azure Data Factory pricing page
- Understanding Azure Data Factory through examples
- Azure Data Factory pricing calculator
Feedback
Coming soon: Throughout 2024 we will be phasing out GitHub Issues as the feedback mechanism for content and replacing it with a new feedback system. For more information see: https://aka.ms/ContentUserFeedback.
Submit and view feedback for