Analyze programming details and changes
Enhance forensics by displaying programming events occurring on your network devices and analyzing any code changes using the OT sensor. Watching for programming events helps you investigate suspicious programming activity, such as:
- Human error: An engineer programming the wrong device.
- Corrupted programming automation: Programming errors due to automation failures.
- Hacked systems: Unauthorized users logged into a programming device.
Use the Programming Timeline tab on your OT network sensor to review programming data, such as when investigating an alert about unauthorized programming, after a planned controller update, or when a process or machine isn't working correctly and you want to understand who made the last update and when.
Programming activity shown on OT sensors include both authorized and unauthorized events. Authorized events are performed by devices that are either learned or manually defined as programming devices. Unauthorized events are performed by devices that haven't been learned or manually defined as programming devices.
Note
Programming data is available for devices using text based programming protocols, such as DeltaV.
Prerequisites
To perform the procedures in this article, make sure that you have:
An OT sensor installed and configured, with text based programming protocol traffic.
Access to the sensor as a Viewer, Security analyst or Admin user.
Access programming data
The Programming Timeline tab can be accessed from the Device map, Device inventory, and Event timeline pages in the sensor console.
Access programming data from the device map
Sign into the OT sensor console and select Device map.
In the Groups area to the left of the map, select Filter > OT Protocols > select a text based programming protocol, such as DeltaV.
In the map, right-click on the device you want to analyze, and select Programming timeline.

The device details page opens with the Programming Timeline tab open.

Access programming data from the device inventory
Sign into the OT sensor console and select Device inventory.
Filter the device inventory to show devices using text based programming protocols, such as DeltaV.
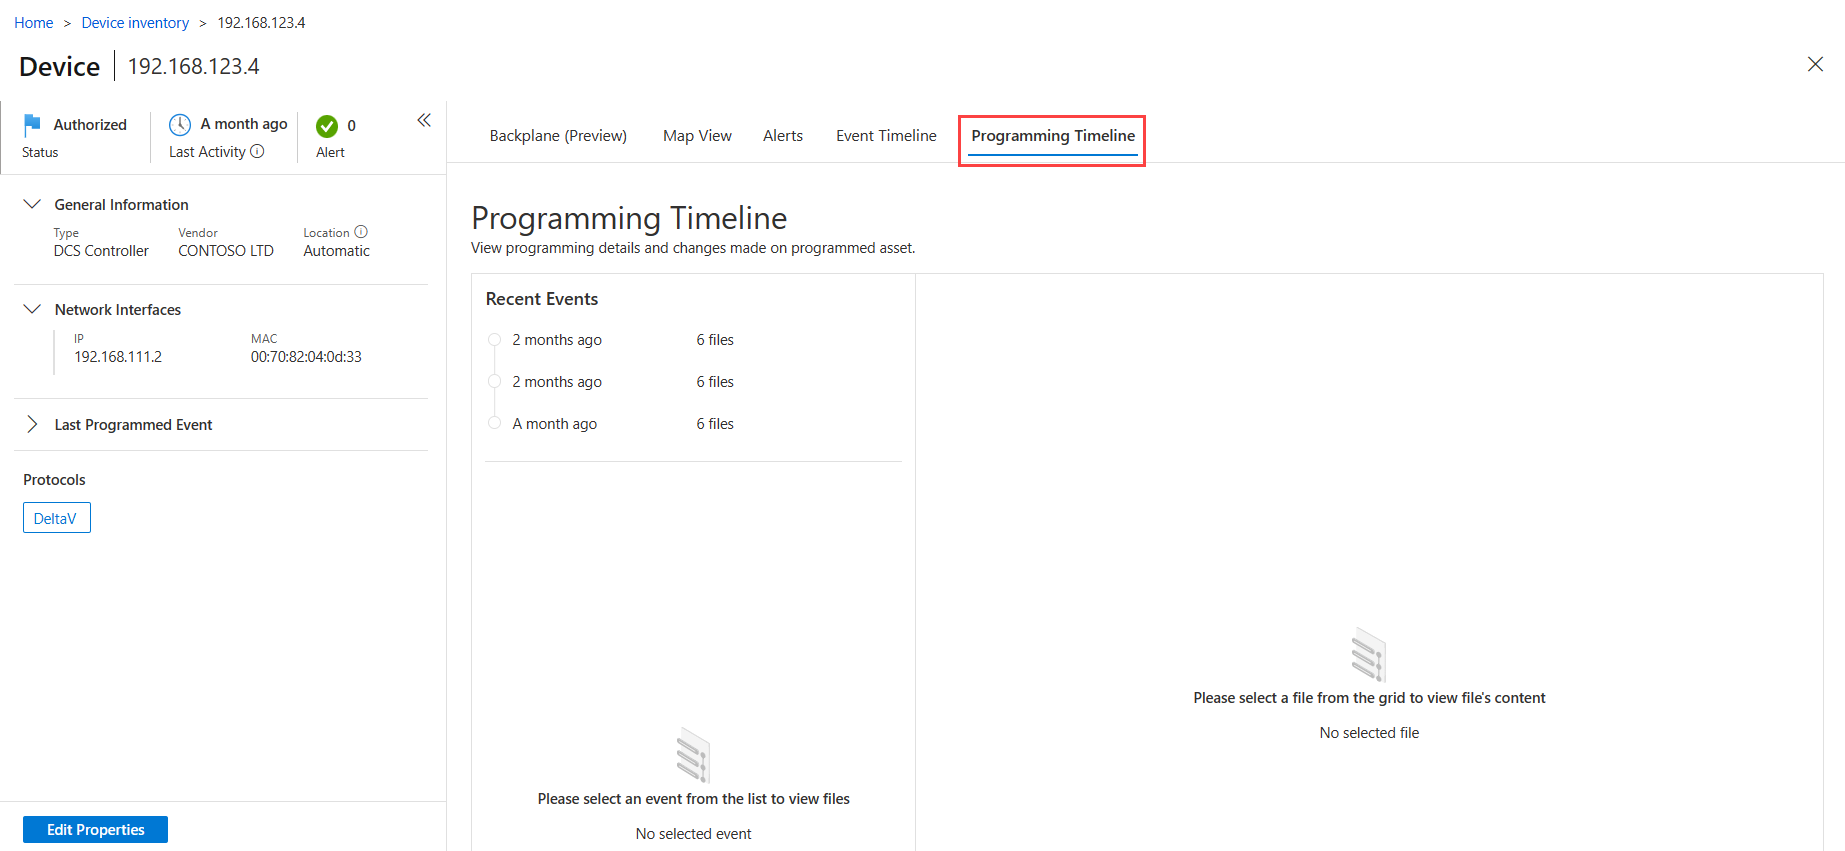
Select the device you want to analyze, and then select View full details to open the device details page.
On the device details page, select the Programming Timeline tab.
For example:

Access programming data from the event timeline
Use the event timeline to display a timeline of events in which programming changes were detected.
Sign into the OT sensor console and select Event timeline.
Filter the event timeline for devices using text based programming protocols, such as DeltaV.
Select the event you want to analyze to open the event details pane on the right, and then select Programming timeline.
View programming details
The Programming Timeline tab shows details about each device that was programmed. Select an event and a file to view full programming details on the right. In the Programming Timeline tab:
The Recent Events area lists the 50 most recent events detected by the OT sensor. Hover over an event period select the star to mark the event as an Important event.
The Files area lists programming files detected for the selected device. The OT sensor can display a maximum of 300 files per device, where each file has a maximum size of 15 MB. The Files area lists each file's name and size, and one of the following statuses to indicate the programming event that occurred:
- Added: The programming file was added to the endpoint
- Updated: The programming file was updated on the endpoint
- Deleted: The programming file was removed from the endpoint
- Unknown: No changes were detected for the programming file
When a programming file is opened on the right, the device that was programmed is listed as the programmed asset. Multiple devices may have made programming changes on the device. Devices that made changes are listed as the programming assets, and details include the hostname, when the change was made, and the user that was signed in to the device at the time.
Tip
Select the ![]() download button to download a copy of the currently displayed programming file.
download button to download a copy of the currently displayed programming file.
For example:

Compare programming detail files
This procedure describes how to compare multiple programming detail files to identify discrepancies or investigate them for suspicious activity.
To compare files:
Open a programming file from an alert or from the Device map or Device inventory pages.
With your first file open, select the compare
 button.
In the Compare pane, select a file for comparison by selecting the scale icon under Action next to the file. For example:

The selected file opens up in a new pane for side-by-side comparison with the first file. The current file installed on the programmed device is labeled Current at the top of the file.
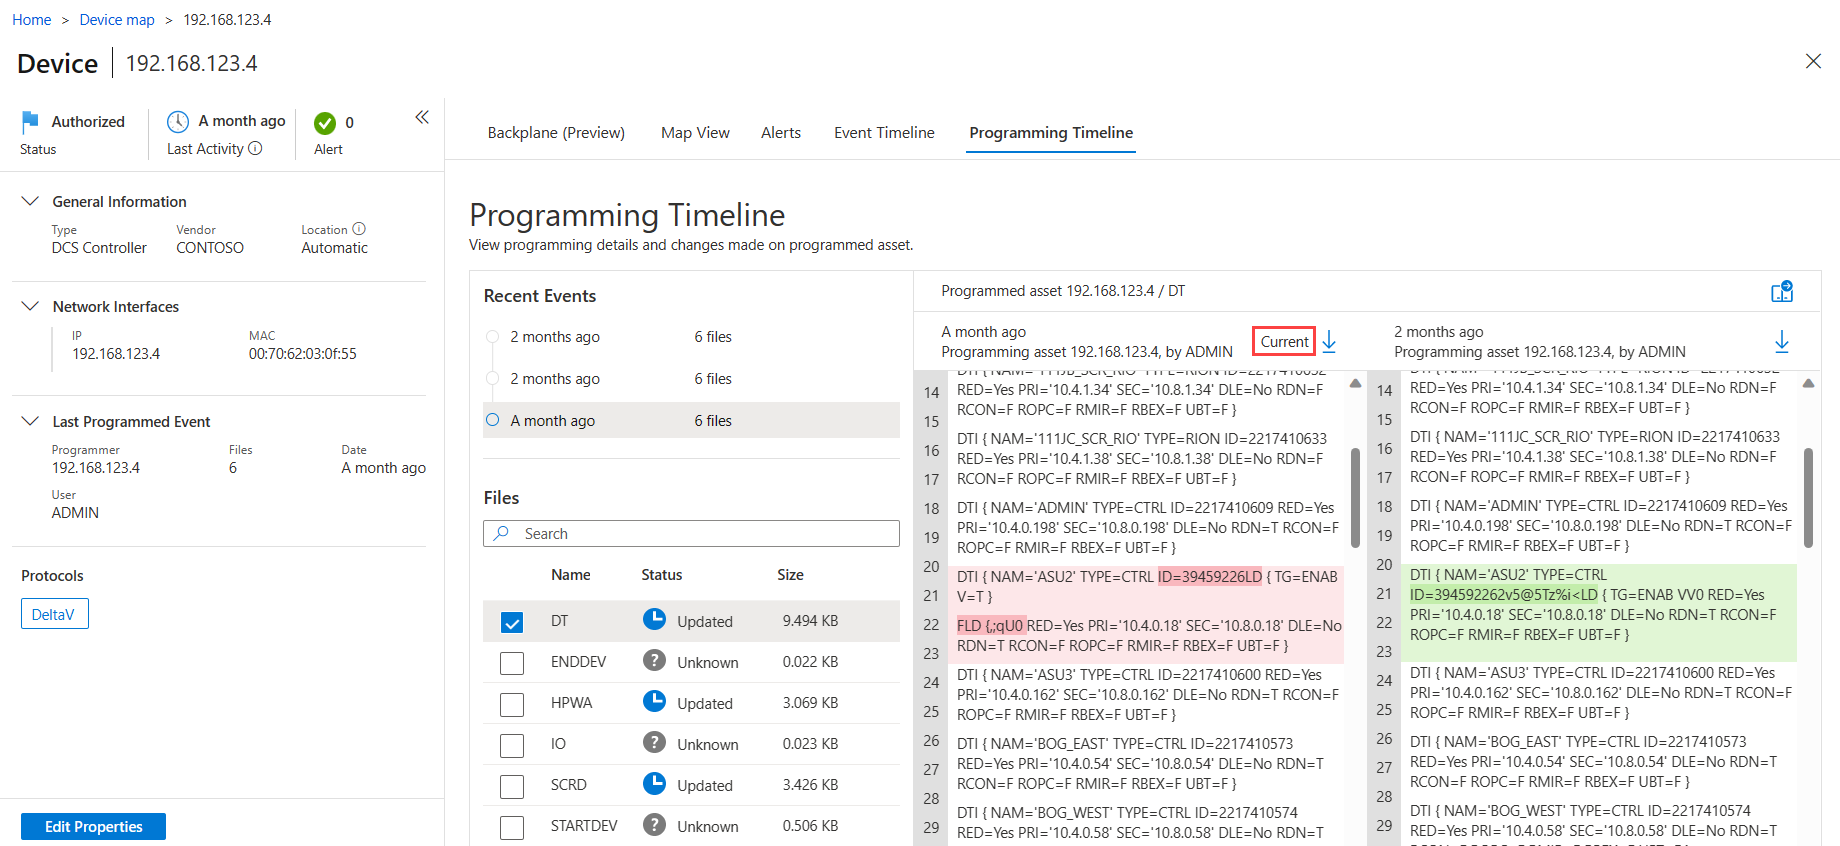
Scroll through the files to see the programming details and any differences between the files. Differences between the two files are highlighted in green and red.


Next steps
For more information, see Import device information to a sensor.
Feedback
Coming soon: Throughout 2024 we will be phasing out GitHub Issues as the feedback mechanism for content and replacing it with a new feedback system. For more information see: https://aka.ms/ContentUserFeedback.
Submit and view feedback for