About Analytics views
Azure DevOps Services | Azure DevOps Server 2022 - Azure DevOps Server 2019
An Analytics view provides a simplified way to specify the filter criteria for a Power BI report based on Analytics data. Analytics views only support Azure Boards data (work items). Analytics views don't support other data types, such as pipelines and tests. Each view corresponds to a flat-list of work items. Work item hierarchies aren't supported.
Important
Analytics views only support Azure Boards data (work items). Analytics views don't support other data types, such as pipelines. Views provide a flat-list of work items and don't support work item hierarchies. At this point, we have no plans to update the connector to support other types of data. For information on other approaches, read the Power BI integration overview.
You can use a default Analytics view or create a custom view. You create custom views in the web portal for Azure DevOps. Once you define a view that supports the data of interest, you can then open the view using Power BI Data Connector to create a report.
Prerequisites
- To view Analytics data and query the service, you need to be a member of a project with Basic access or greater. By default, all project members are granted permissions to query Analytics and define Analytics views.
- To learn about other prerequisites regarding service and feature enablement and general data tracking activities, see Permissions and prerequisites to access Analytics.
Users with Stakeholder access have no access to view or edit Analytics views.
Note
If Boards is disabled, then Analytics views is also disabled. All widgets associated with work item tracking are also disabled in the widget catalog. To re-enable a service, see Turn on or off an Azure DevOps service.
Default Analytics views
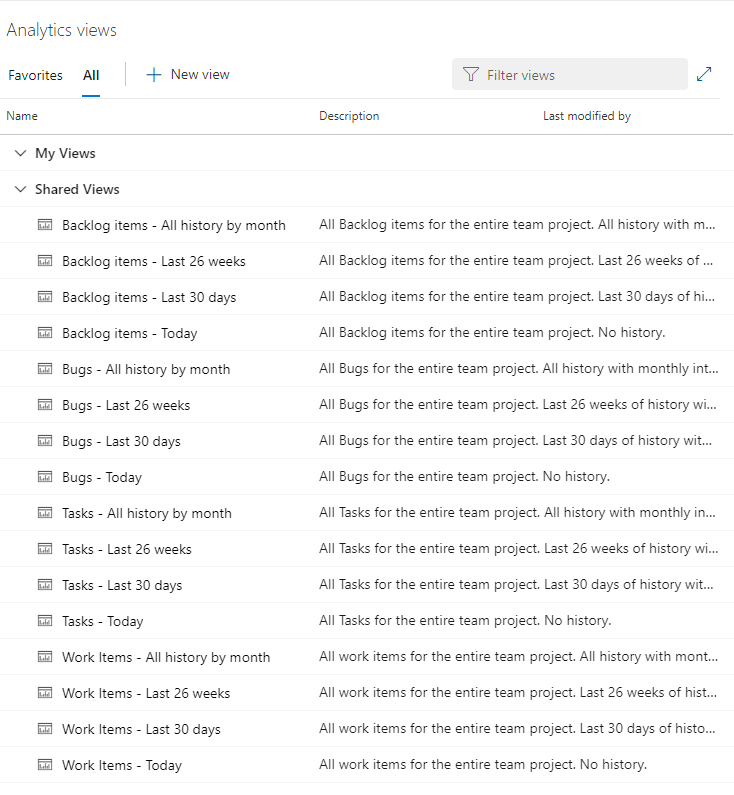
A set of default Analytics views are provided. The default views and are immediately accessible from Power BI. The view you select determines the set of records, fields, and history that is pulled into Power BI.
Here we show the default views created for a project based on the Agile process. For more information, see Manage Analytics views.
Note
The labels you see for the list of default Analytics views will differ depending on the process that was chosen when creating your team project—Basic, Agile, Scrum, or CMMI. However, the basic functionality available to you remains the same unless explicitly mentioned.
When you use the Power BI Data Connector, these same default views appear in the Navigator dialog. The view you select determines the set of records, fields, and history that is loaded into Power BI.


Options for work item types and historical data
Default Analytics views work well for customers with small datasets. Each default Analytics view provides a combination of options for work item types and historical data. The following tables describe each set of options.
| Work item type option | Description |
|---|---|
| Bugs | Load current or historical state of Bugs only |
| Requirement Backlog | Load current or historical state of Stories, Backlog Items or Requirements |
| Tasks | Load current or historical state of Tasks |
| Work Items | Load current or historical state of all work items |
| Historical option | Description |
|---|---|
| Today | Loads only the most recent revision for each work item |
| Last 30 days | Loads work item history for the last 30 days, on a daily interval |
| Last 26 weeks | Loads work item history for the last 26 weeks, on a weekly interval |
| All history by month | Loads all work item history, on a monthly interval |
When a default view doesn't meet your needs
The default Analytics views return all the specified data in a project. They work well for customers with smaller datasets. For larger datasets, the amount of data generated by a default view might be too large for Power BI to load.
In these cases, you can create a custom Analytics view to fine-tune the records, fields, and history loaded into Power BI.
Custom Analytics views
If the default Analytics views don't meet your needs, you can create custom views to fine-tune the records, fields, and history returned to Power BI. With a custom view, you can define the following options:
- Sharing options
- Work item filters
- Team and area path filters
- Backlog and work item type filters
- Field-specific filters
- Fields to display
- View history and trend options
For more information, see Create an Analytics view.
Common reportable fields
Default views automatically include the most common fields for the included work item types used for reporting. All custom fields are included.
For example, the following fields are included when filtered for bugs and user stories. You can look up the description of most of these fields from the Entities and properties reference for Azure Boards or Work item field index.

Two fields that are reported on are only available from Analytics data, Cycle Time Days and Lead Time Days. For more information about how these days are calculated, see Cumulative flow, lead time, and cycle time guidance, Lead time versus cycle time.
For more information on how the dataset is modeled when using the Power BI Data Connector, see Analytics views dataset design.
Next steps
Related articles
Feedback
Coming soon: Throughout 2024 we will be phasing out GitHub Issues as the feedback mechanism for content and replacing it with a new feedback system. For more information see: https://aka.ms/ContentUserFeedback.
Submit and view feedback for