Cumulative Flow Diagram (CFD) sample report
Azure DevOps Services | Azure DevOps Server 2022 - Azure DevOps Server 2019
This article shows you how to display the Stories CFD for a specified team. This data is also available through the built-in chart and dashboard widget. To learn more about these options, see View and configure a Cumulative Flow Diagram.
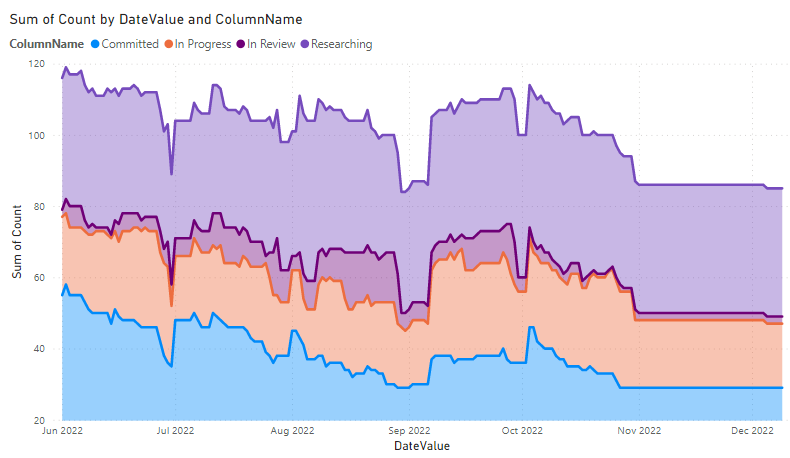
An example is shown in the following image that shows a count of user stories over time in the Researching, Committed, In Progress, and In Review states. Hovering over a date provides information on data for that date.

To learn more about cumulative flow, see Cumulative flow, lead time, and cycle time guidance and Cumulative flow, lead time, and cycle time guidance.
Note
This article assumes you've read Overview of Sample Reports using OData Queries and have a basic understanding of Power BI.
Prerequisites
- To view Analytics data and query the service, you need to be a member of a project with Basic access or greater. By default, all project members are granted permissions to query Analytics and define Analytics views.
- To learn about other prerequisites regarding service and feature enablement and general data tracking activities, see Permissions and prerequisites to access Analytics.
Sample queries
Queries in this section support returning cumulative flow data for User Stories. These queries specify the WorkItemBoardSnapshot entity set as they return data calculated for the Kanban board over time.
Note
To determine available properties for filter or report purposes, see Metadata reference for Azure Boards. You can filter your queries or return properties using any of the Property values under an EntityType or NavigationPropertyBinding Path values available with an EntitySet. Each EntitySet corresponds to an EntityType. To learn more about the data type of each value, review the metadata provided for the corresponding EntityType.
You can paste the Power BI query listed below directly into the Get Data->Blank Query window. For more information, review Overview of sample reports using OData queries.
let
   Source = OData.Feed ("https://analytics.dev.azure.com/{organization}/{project}/_odata/V3.0-preview/WorkItemBoardSnapshot?"
        &"$apply=filter( "
            &"Team/TeamName eq '{teamname}' "
            &"and BoardName eq 'Stories'  "
            &"and DateValue ge {startdate} "
        &") "
        &"/groupby( "
            &"(DateValue,ColumnName,LaneName,State,WorkItemType,AssignedTo/UserName,Area/AreaPath),  "
            &"aggregate($count as Count) "
        &") "
    ,null, [Implementation="2.0",OmitValues = ODataOmitValues.Nulls,ODataVersion = 4])
in
    Source
Substitution strings and query breakdown
Substitute the following strings with your values. Don't include brackets {} with your substitution. For example if your organization name is "Fabrikam", replace {organization} with Fabrikam, not {Fabrikam}.
{organization}- Your organization name{project}- Your team project name, or omit "/{project}" entirely, for a cross-project query
{teamname}- The name of the team to display CFD data
{startdate}- Start your report for items completed on or after a given date with the format:YYYY-MM-DDZ. For example:2022-04-01Zrepresents 2022-April-01. Don't enclose in quotes.
Query breakdown
The following table describes each part of the query.
Query part
Description
$apply=filter(
Start filter() clause.
Team/TeamName eq '{teamname}'
Return items for a specific team.
and BoardName eq 'Stories'
Return items on the Stories backlog. You can specify other backlog names, such as Epics or Features. Specify the backlog level that corresponds to the process selected for your project.
and DateValue ge {startdate}
Return data on or after the specified date, for example, 2022-04-01Z represents 2022-April-01 2019-July-01.
)
Close filter() clause.
/groupby(
Start groupby() clause.
(DateValue, ColumnName, LaneName, State, WorkItemType,AssignedTo/UserName,Area/AreaPath),
Group by DateValue (used for trending), ColumnName, and any other properties you want to report on. Here we include LaneName to enabling filtering by swimlanes.
aggregate($count as Count)
Aggregate as count of work items.
)
Close groupby() clause.
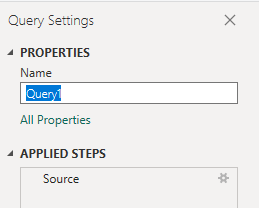
(Optional) Rename query
You can rename the default query label, Query1, to something more meaningful. Simply enter a new name from the Query Settings pane.
Expand columns in Power Query Editor
From the Power Query Editor, choose the query with the data you want to transform. For a CFD chart, you'll need to
expand the Area, Iteration, and AssignedTo columns. To learn how, see the following sections in Transform Analytics data to generate Power BI reports, Expand columns.
(Optional) Rename fields
Once you've expanded the columns, you may want to rename one or more fields. For example, you can rename the column AreaPath to Area Path. To learn how, see Rename column fields.
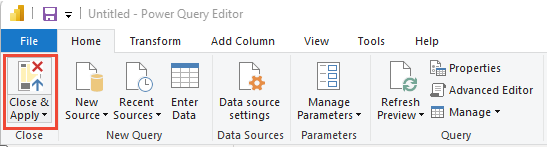
Close the query and apply your changes
Once you've completed all your data transformations, choose Close & Apply from the Home menu to save the query and return to the Report tab in Power BI.
Create the stacked area chart
In the following example, the query was renamed to CFD, but no columns were renamed.
In Power BI, choose the Stacked area chart under Visualizations.
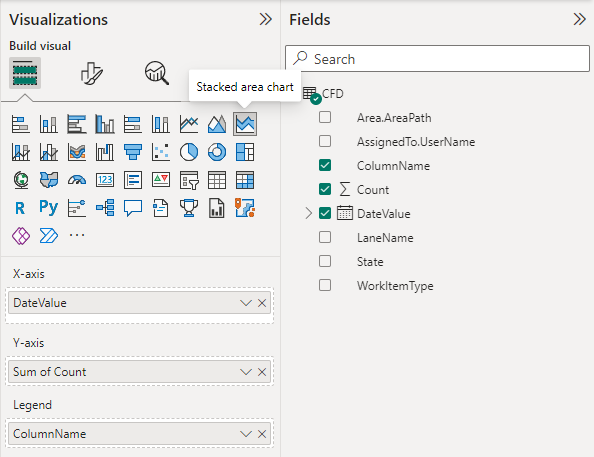
Add
DateValueto Axis and then right-clickDateValueand selectDateValue, rather thanDate Hierarchy.Add
Countto Values.Add
ColumnNameto Legend.In the Filters pane, expand
ColumnName, and select only the values you want to appear on the chart. For example, you may want to unselect New, Proposed, Done, or Closed.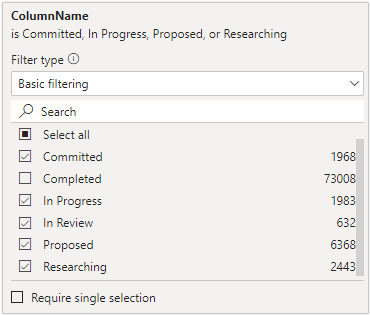
The example report displays the columns in alphabetic order. However, the preferred order is to sort the data according to the Kanban column order, or progressive order.
Sort columns in progressive order
To sort the chart columns in the order specific on the Kanban board, do the following steps:
- Create a new query in Power BI per the following queries. When done, rename the query to ColumnOrder.
You can paste the Power BI query listed below directly into the Get Data->Blank Query window. For more information, review Overview of sample reports using OData queries.
let
   Source = OData.Feed ("https://analytics.dev.azure.com/{organization}/{project}/_odata/V3.0-preview/BoardLocations?"
        &"$apply=filter( "
            &"Team/TeamName eq '{teamname}'  "
            &"and BoardName eq 'Stories'  "
            &"and IsCurrent eq true "
        &") "
        &"/groupby ((ColumnName,ColumnOrder)) "
    ,null, [Implementation="2.0",OmitValues = ODataOmitValues.Nulls,ODataVersion = 4])
in
    Source
Sort the report in the correct order
In Power BI, expand the ColumnOrder query and select
ColumnName.Select Column Tools and then Sort by Column and choose
ColumnOrder.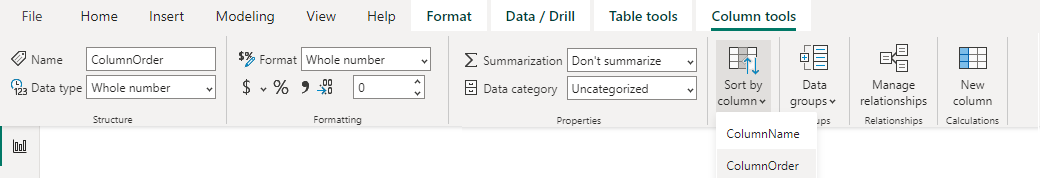
Select the Modeling menu, and then Manage Relationships. Ensure there's a relationship between
CFD.ColumnNameandColumnOrder.ColumnName. It's likely that the relationship was autodetected.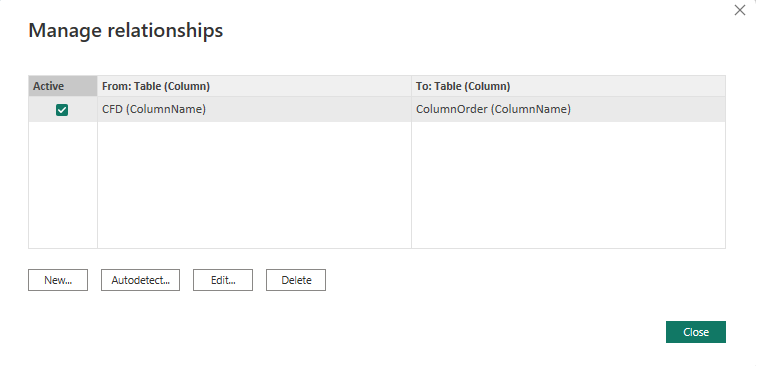
In the report created above, in the Legend, replace
CFD.ColumnNamewithColumnOrder.ColumnNameto Legend.The report refreshes with columns sorted in the same order used by the Kanban board.
Note
If any work items were in a column that has since been deleted, they will appear as "Blank" in the above report.
Related articles
Feedback
Coming soon: Throughout 2024 we will be phasing out GitHub Issues as the feedback mechanism for content and replacing it with a new feedback system. For more information see: https://aka.ms/ContentUserFeedback.
Submit and view feedback for