Collect diagnostic data while testing
Azure DevOps Services | Azure DevOps Server 2022 - Azure DevOps Server 2019
Collect diagnostic data while you test your apps. This data is included in the bugs you file during the test. You can collect diagnostic data from web apps and from desktop apps, and view it in Azure Test Plans.
Prerequisites
You must connect to a project. If you don't have a project yet, create one.
You must be added to a project. To get added, Add users to a project or team.
To request or provide feedback, you must have Stakeholder access or higher.
To add or modify bugs or other work item types, you must have the Edit work items in this node permission set to Allow under the corresponding Area Path.
To add new tags, you must have the Create tag definition permission set to Allow.
For more information, see Set permissions and access for testing.
Collect diagnostic data from web and desktop apps
For web apps under test, you can use web-based Microsoft Test Runner. For desktop apps, download and install the Test Runner desktop client to collect the following data on demand:
For more information, see Exploratory test and submit feedback directly from your browser.
Capture your screen
Do the following steps to capture annotated screenshots from your app.
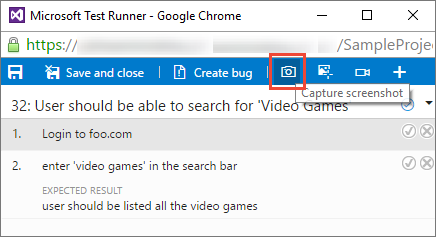
Open Test Runner and choose the Capture screenshot icon. Ensure that the app from which you want to capture data is selected.
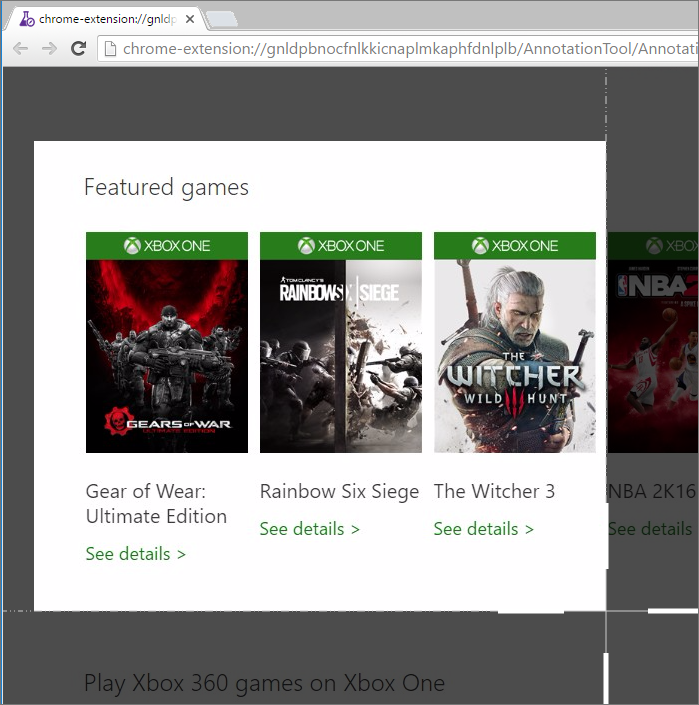
Drag to select the area of the screen you want to capture, or just capture the full screen.
If necessary, edit the title of the screenshot and add annotations and text to it using the icons in the toolbar.
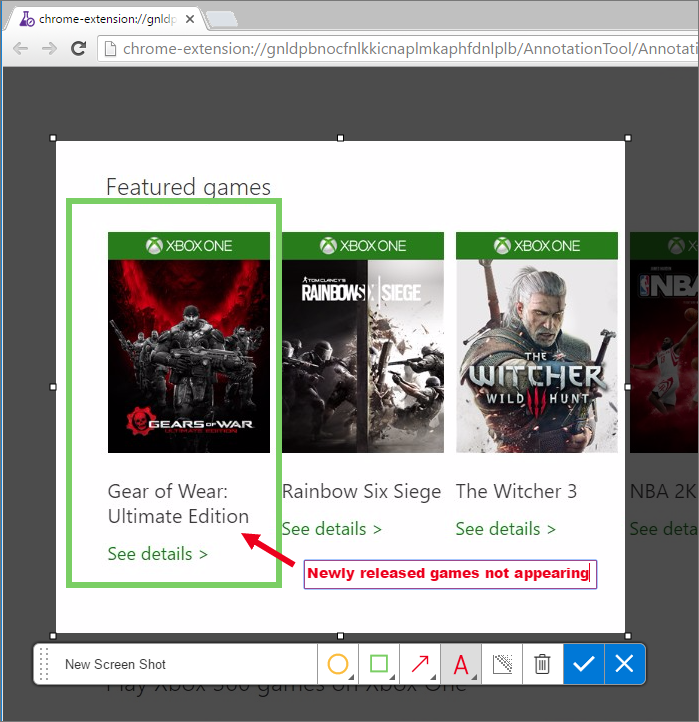
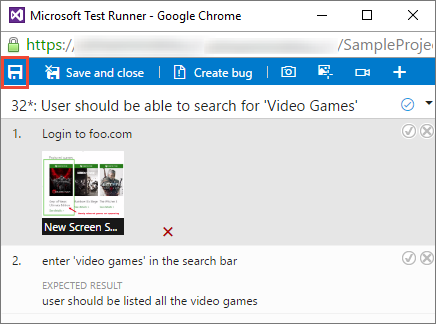
Save your screenshot.
Capture interactions as an image action log
Do the following steps to capture your interactions with the web or desktop app as an image action log that provides context.
Open or switch to the Test Runner and choose the Capture user actions... icon. Ensure that the app from which you want to capture data is selected.
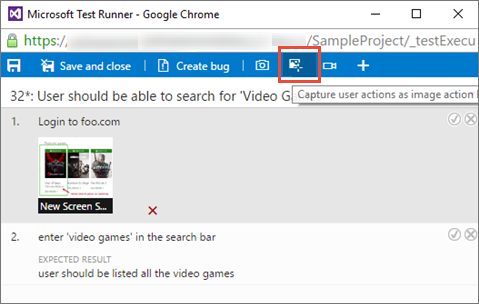
The Test Runner records all the actions you take on the app's browser tab or in the desktop app.
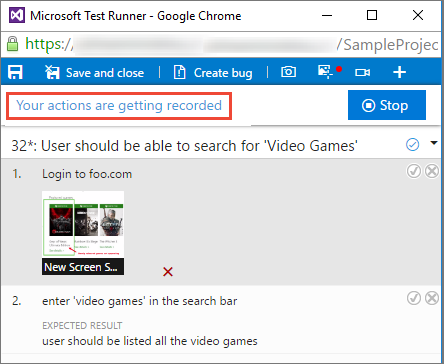
If you create a bug while recording your actions, all the data collected up to that point is included in the bug.
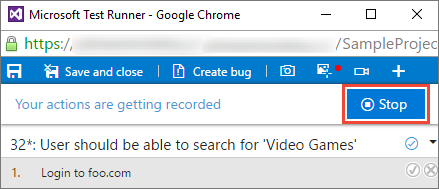
Select Stop to finish capturing your actions, The action log is added to the test results as an attachment.
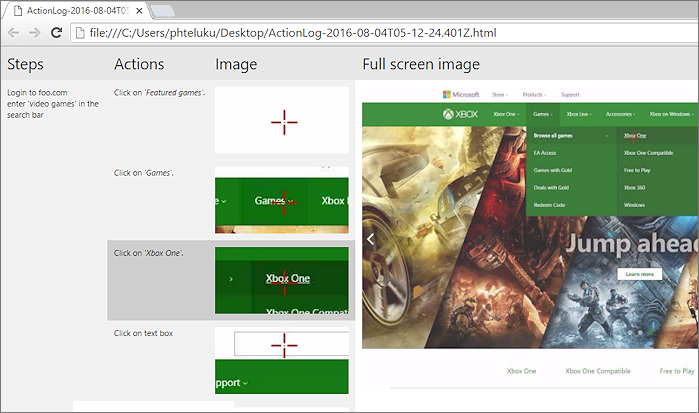
Select the ActionLog... link to view the data captured in the action log.
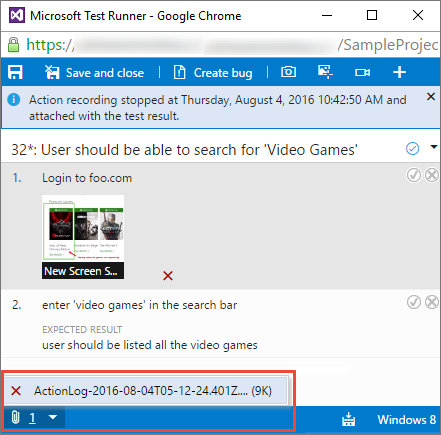
The log opens in your web browser.
Record your screen
Do the following steps to capture screen recordings from your apps.
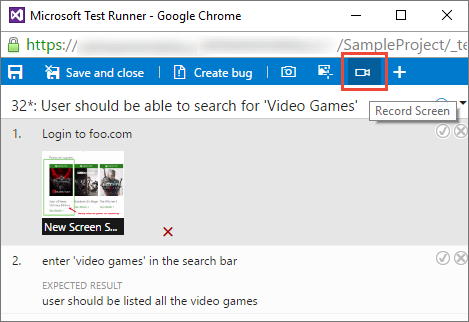
Open or switch to the Test Runner and choose the Record screen icon.
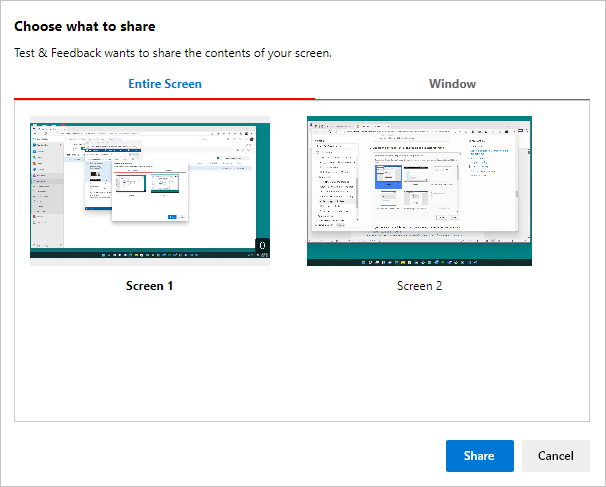
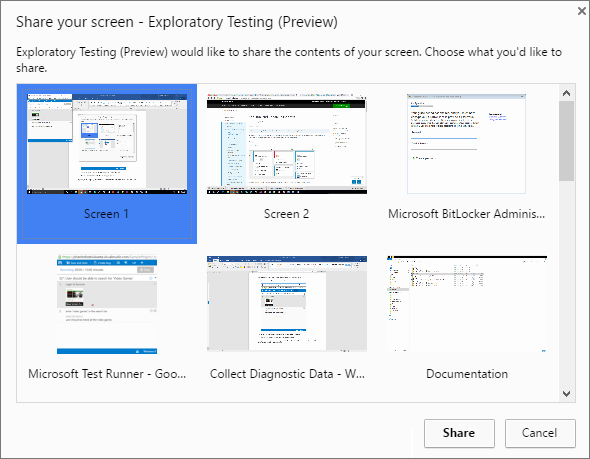
Choose the entire screen, or choose an app to start recording.
If you create a bug while recording your screen, the recording automatically stops and is added to the bug.
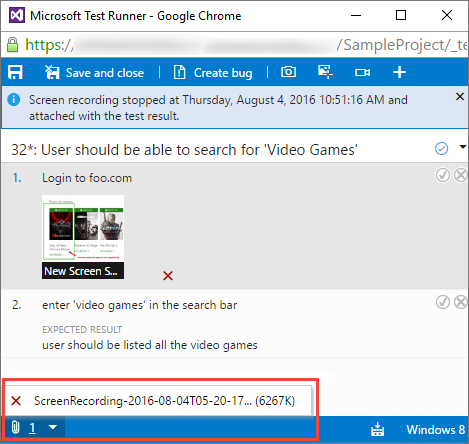
Finish recording your actions by choosing the Stop button. The recording is added to the test results as an attachment.
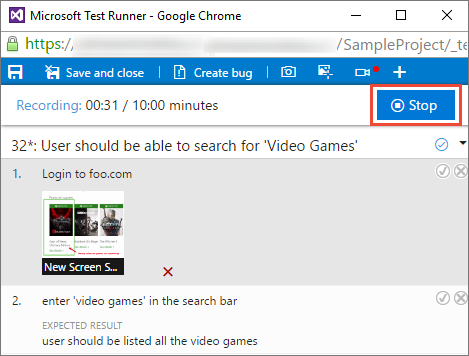
If you don't stop the recording after 10 minutes, it stops automatically and is saved as an attachment to your test results. Restart the recording the Record screen icon if necessary.
Choose the ScreenRecording... link at the bottom of the window to view the captured recording.
View the diagnostic data
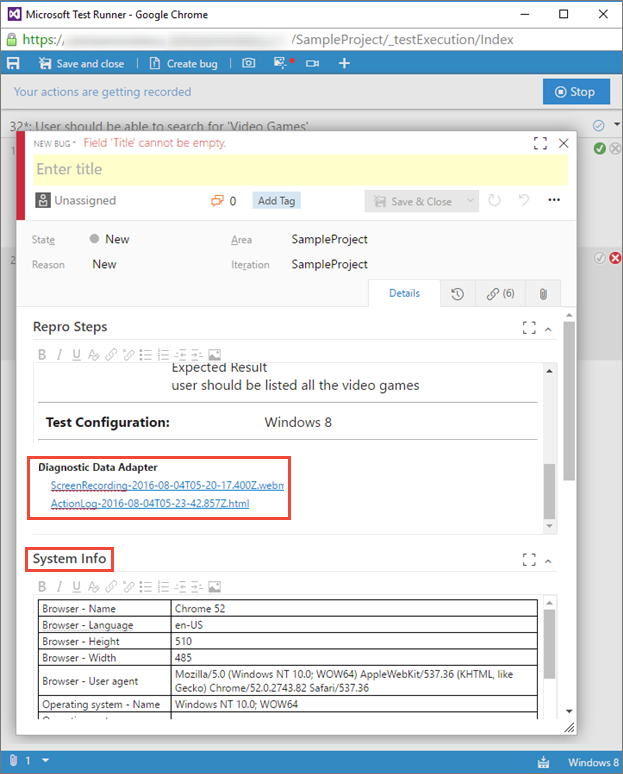
When you create a bug while capturing diagnostic data, all the data captured up to that point gets included in the bug that you create. You can view it before you save the bug.
How do I play the video recordings I created with the extension?
To collect advanced diagnostic data such as code coverage, IntelliTrace, and Test Impact data (in addition to the previously listed data items), you must configure the data collectors and other run settings in Microsoft Test Manager and run your tests using Microsoft Test Manager. For more information, see Run manual tests with Microsoft Test Manager.
Note
If you have an older version of Microsoft Test Manager, we recommend you upgrade to the latest version. However, if you have Microsoft Test Manager 2015 or an earlier version installed, you can choose Microsoft Test Runner 2015 and earlier when you launch the test runner using Run with options. You must configure the data collectors and other run settings in Microsoft Test Manager and specify these as the default settings for the test plan. For more information, see Run manual tests with Microsoft Test Manager.
Related articles
Feedback
Coming soon: Throughout 2024 we will be phasing out GitHub Issues as the feedback mechanism for content and replacing it with a new feedback system. For more information see: https://aka.ms/ContentUserFeedback.
Submit and view feedback for