Integrate airflow logs with Azure Monitor
In this article, you'll learn how to start collecting Airflow Logs for your Microsoft Azure Data Manager for Energy instances into Azure Monitor. This integration feature helps you debug Airflow DAG (Directed Acyclic Graph) run failures.
Prerequisites
An existing Log Analytics Workspace. This workspace will be used to query the Airflow logs using the Kusto Query Language (KQL) query editor in the Log Analytics Workspace. Useful Resource: Create a log analytics workspace in Azure portal.
An existing storage account: It will be used to store JSON dumps of Airflow logs. The storage account doesn’t have to be in the same subscription as your Log Analytics workspace.
Enabling diagnostic settings to collect logs in a storage account
Every Azure Data Manager for Energy instance comes inbuilt with an Azure Data Factory Workflow Orchestration Manager (powered by Apache Airflow) instance. We collect Airflow logs for internal troubleshooting and debugging purposes. Airflow logs can be integrated with Azure Monitor in the following ways:
- Storage account
- Log Analytics workspace
To access logs via any of the above two options, you need to create a Diagnostic Setting. Each Diagnostic Setting has three basic parts:
| Part | Description |
|---|---|
| Name | This is the name of the diagnostic log. Ensure a unique name is set for each log. |
| Categories | Category of logs to send to each of the destinations. The set of categories will vary for each Azure service. Visit: Supported Resource Log Categories |
| Destinations | One or more destinations to send the logs. All Azure services share the same set of possible destinations. Each diagnostic setting can define one or more destinations but no more than one destination of a particular type. It should be a storage account, an Event Hubs namespace or an event hub. |
Follow the following steps to set up Diagnostic Settings:
Open Microsoft Azure Data Manager for Energy' Overview page
Select Diagnostic Settings from the left panel
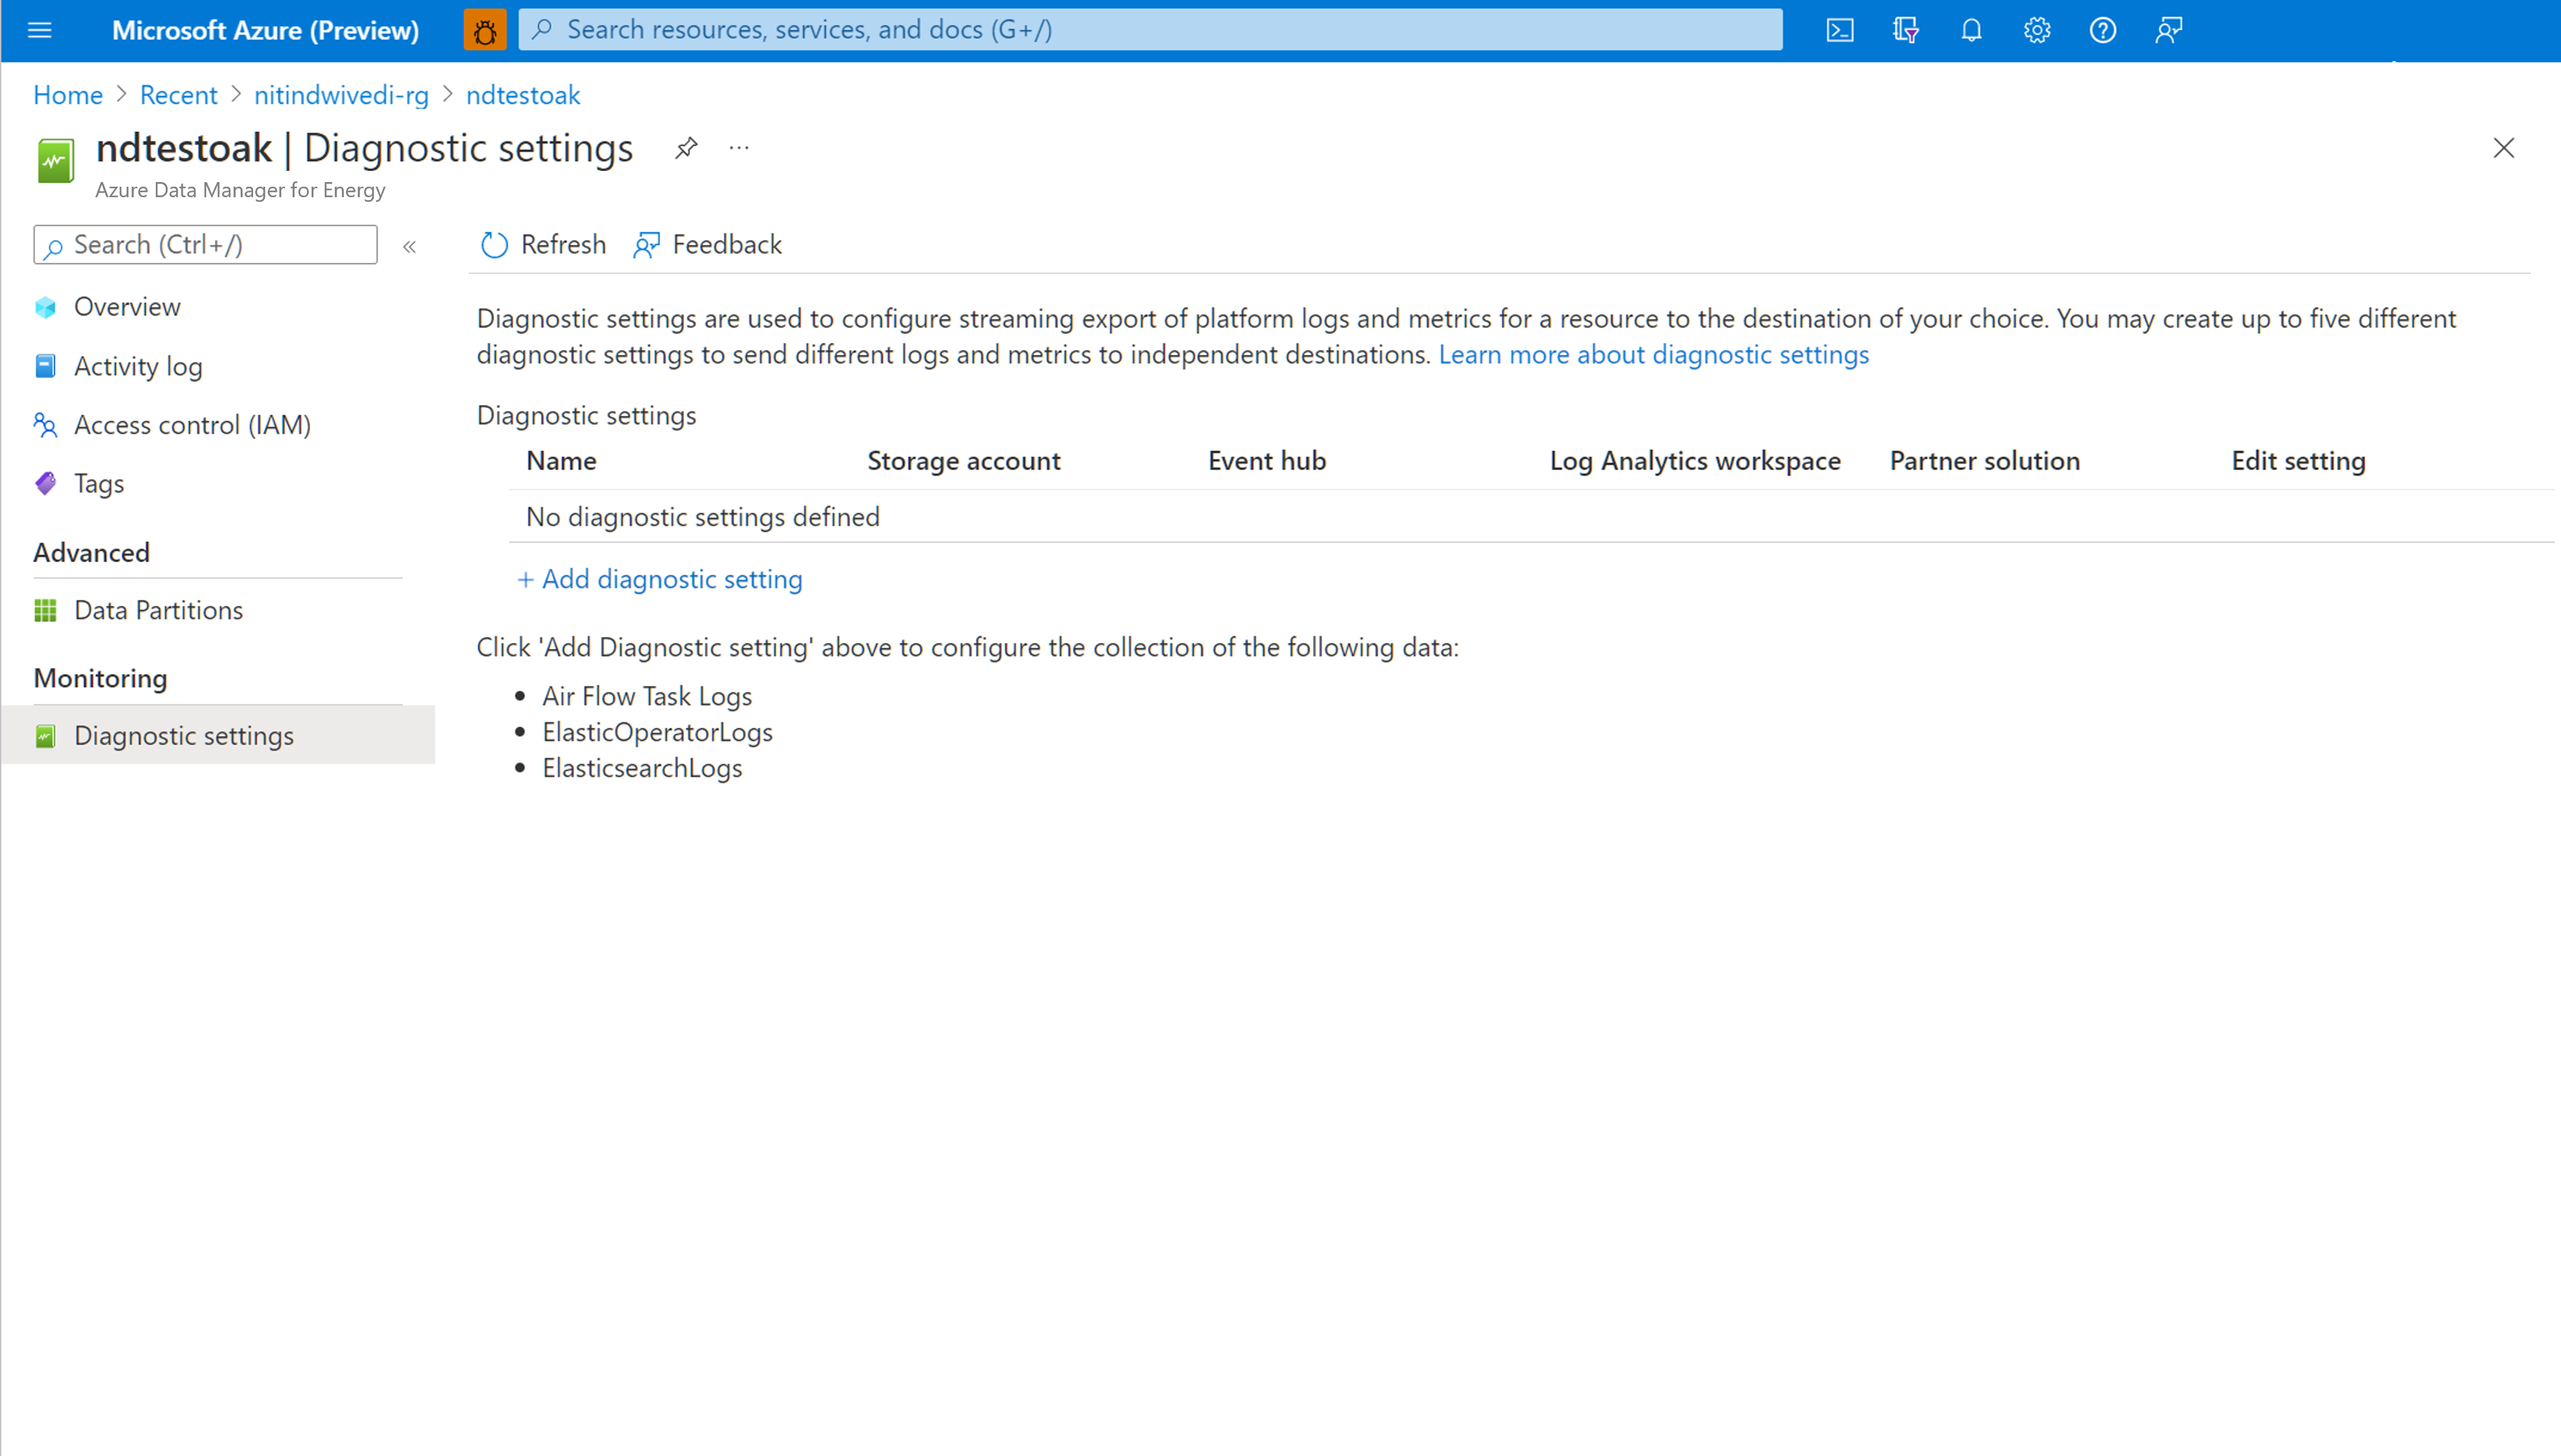
Select Add diagnostic setting
Select Airflow Task Logs under Logs
Select Archive to a storage account
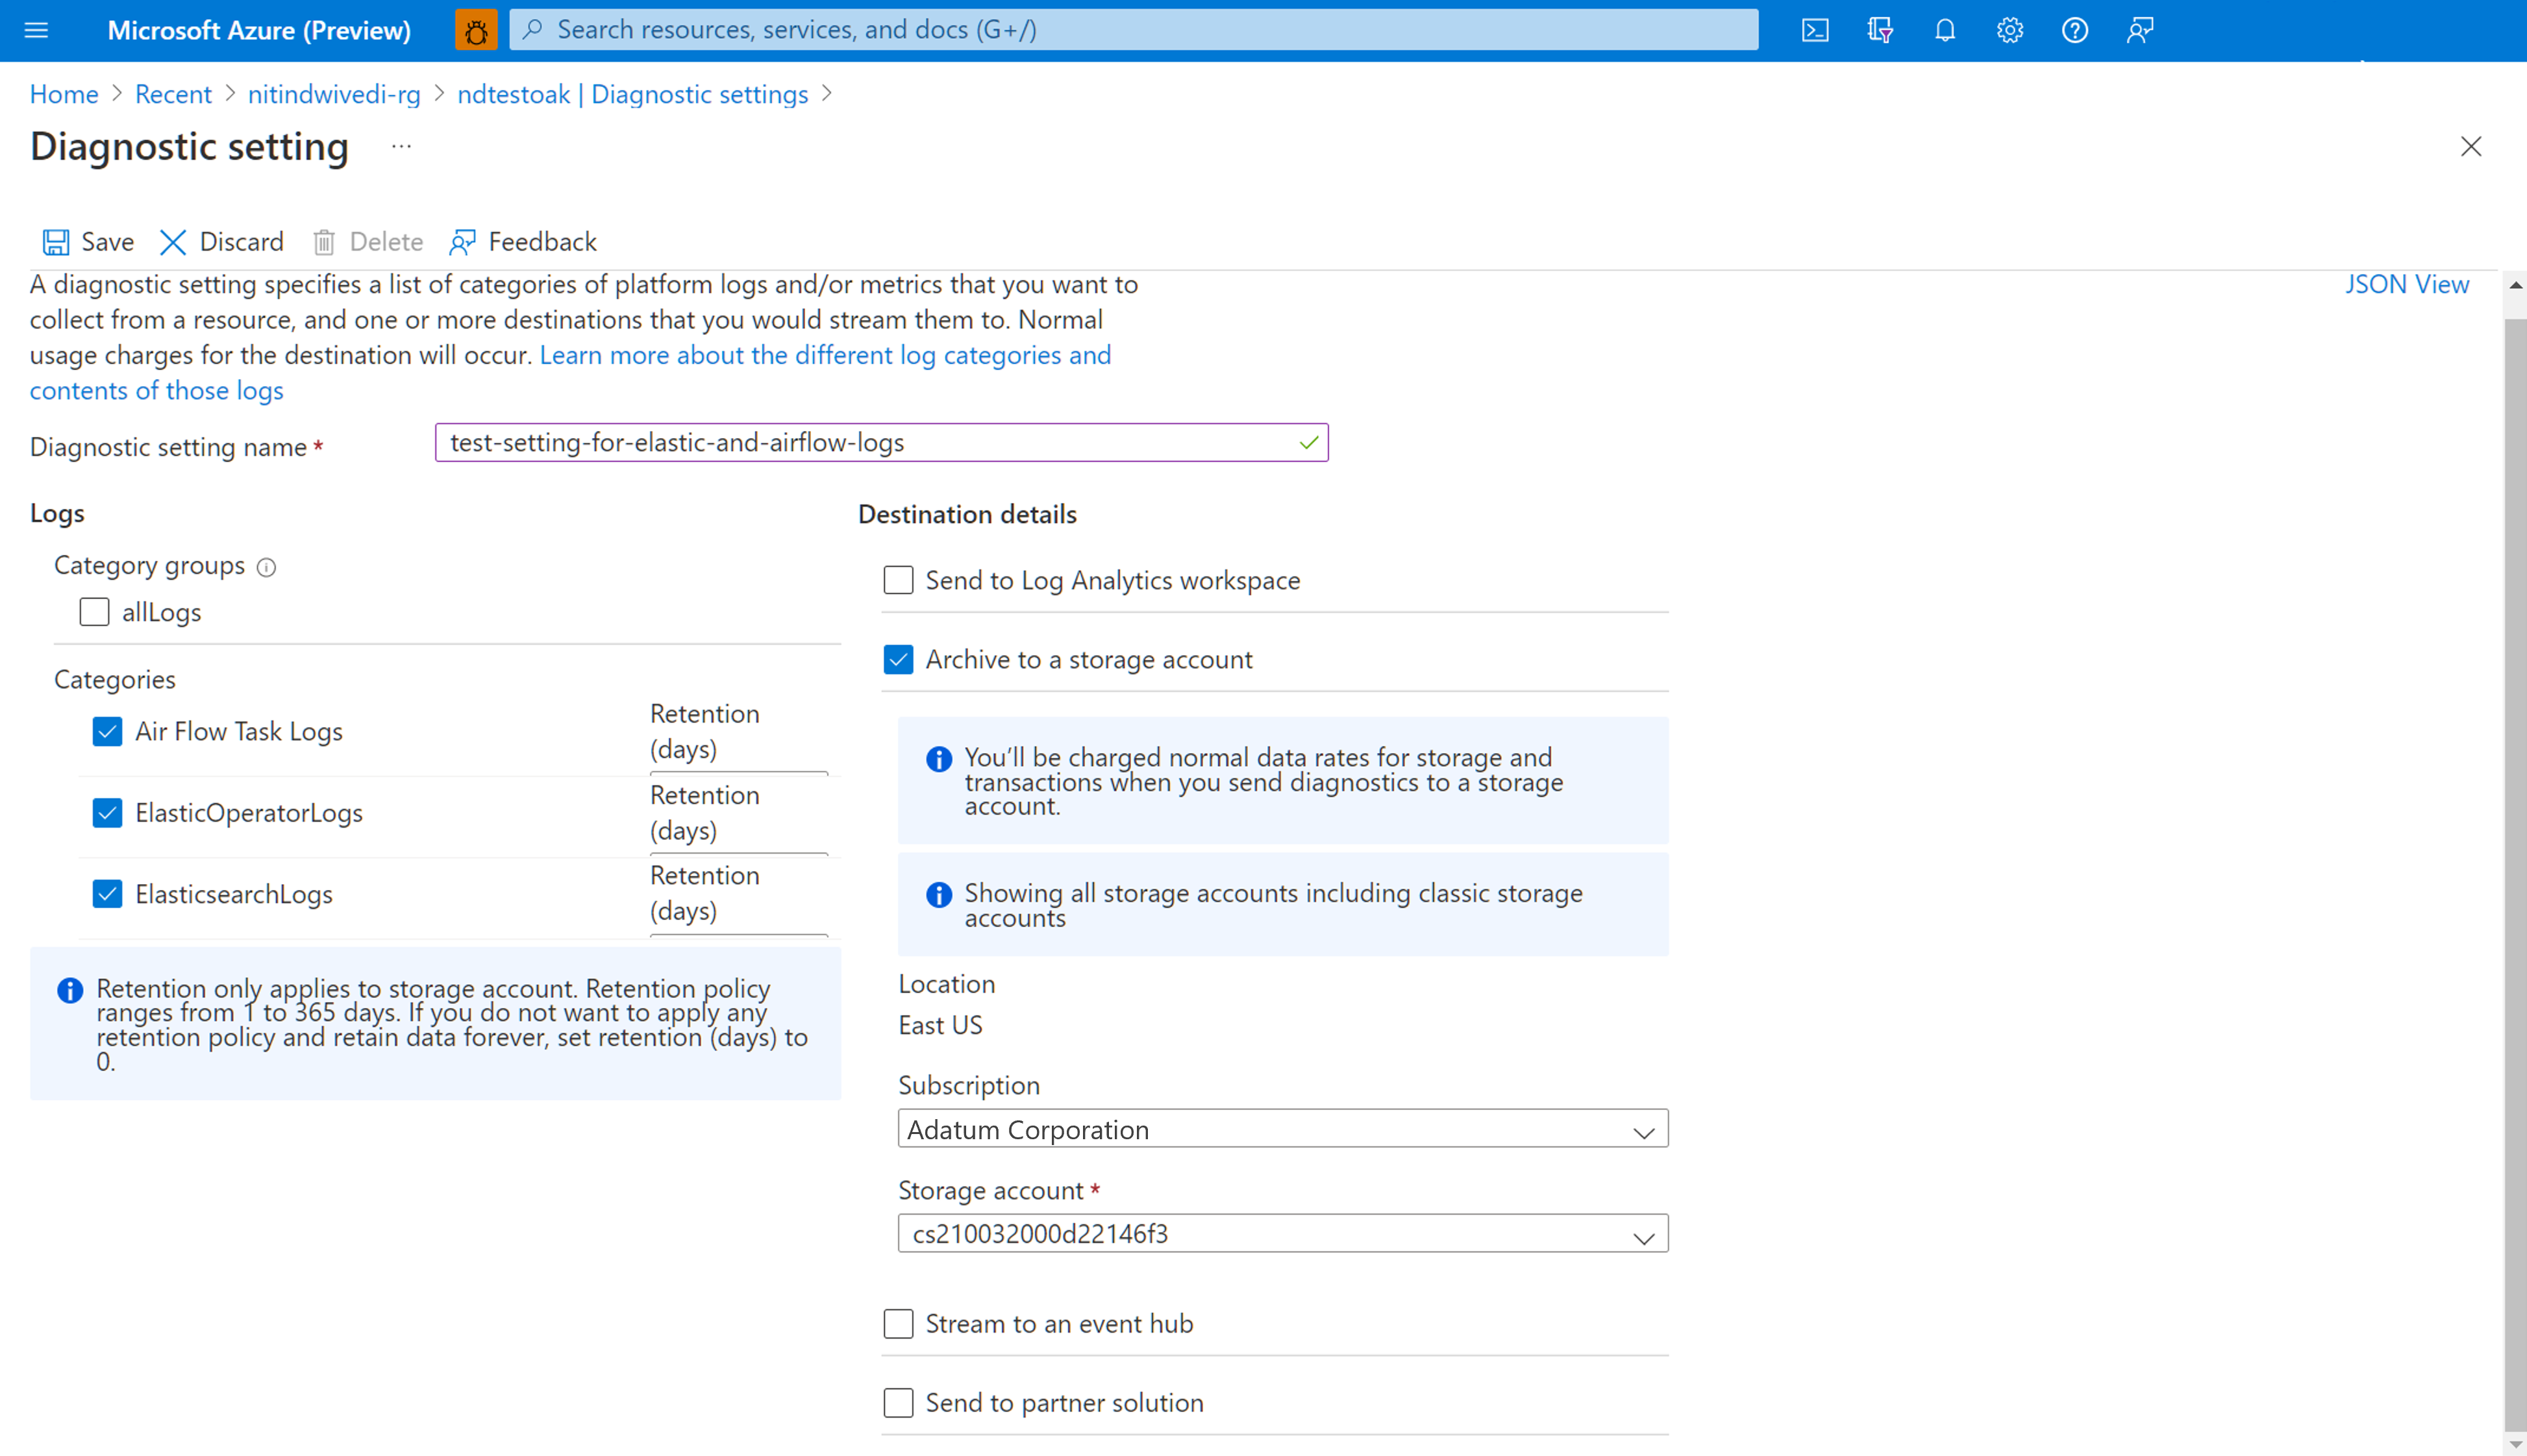
Verify the subscription and the storage account to which you want to archive the logs.


Navigate storage account to download Airflow logs
After a diagnostic setting is created for archiving Airflow task logs into a storage account, you can navigate to the storage account overview page. You can then use the "Storage Browser" on the left panel to find the right JSON file that you want to investigate. Browsing through different directories is intuitive as you move from a year to a month to a day.
Navigate through Containers, available on the left panel.
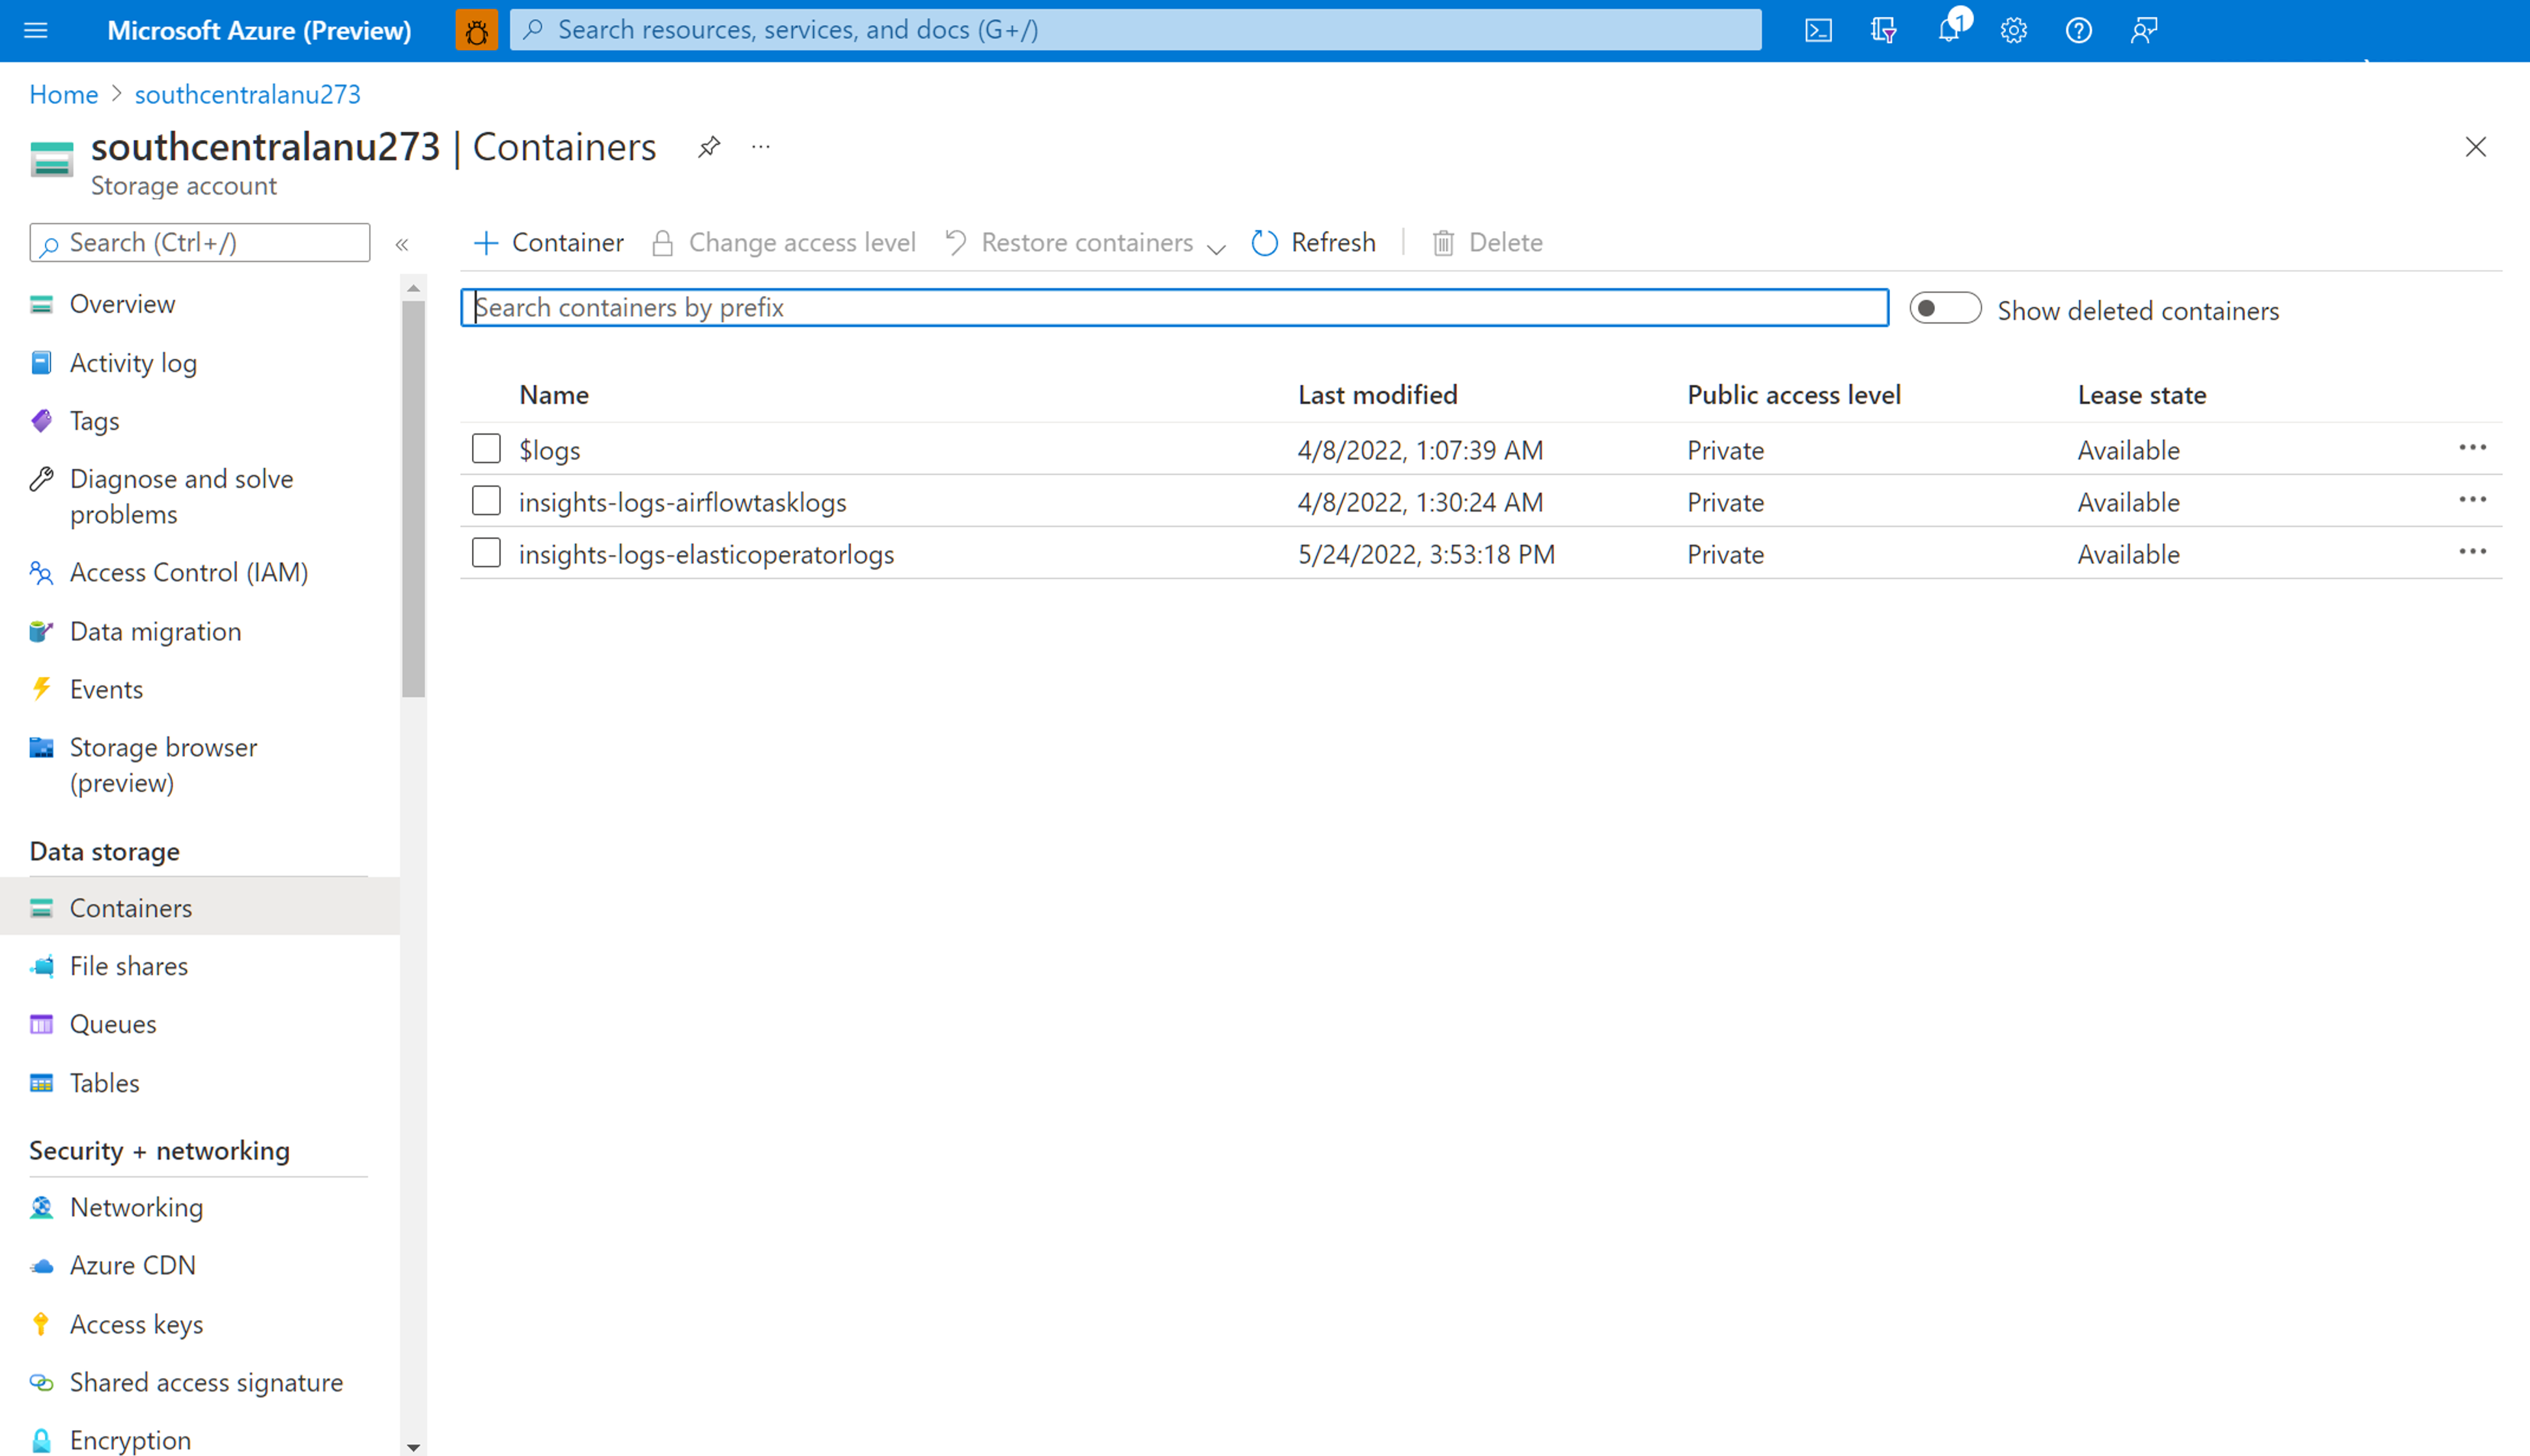
Open the information pane on the right. It contains a "download" button to save the log file locally.
Downloaded logs can be analyzed in any editor.

Enabling diagnostic settings to integrate logs with Log Analytics Workspace
You can integrate Airflow logs with Log Analytics Workspace by using Diagnostic Settings under the left panel of your Microsoft Azure Data Manager for Energy instance overview page.

Working with the integrated Airflow Logs in Log Analytics Workspace
Use Kusto Query Language (KQL) to retrieve desired data on collected Airflow logs from your Log Analytics Workspace. You can either load the prebuilt sample queries to your Log Analytics Workspace or create your own queries.

Loading Pre-built queries: Select Logs from your resource's menu. Log Analytics opens with the Queries window that includes prebuilt queries for your resource type. Browse through the available queries. Identify the one to run and select Run. The query is added to the query window and the results are returned.
Write queries in the Query editor: You can copy, paste and edit the following queries or write your own in KQL on the Query Editor of your Log Analytics Workspace.
Sample Queries
This query returns all the Airflow logs that are of level ERROR. You can filter the results by adding (uncommenting) where clause for the Azure Data Manager for Energy instance name and correlation ID for your DAG runs.
OEPAirFlowTask
| extend ResourceName = tostring(split(_ResourceId , '/')[-1])
// | where ResourceName == "<the name of ADME instance>"        // to filter on resourceName replace <...> and uncomment line
// | where CorrelationId == "<DAG run's runId>"                 // to filter on correlationID replace <...> with correlationId (same as runId) - we have created a duplicate for to maintain consistency of column name across all services
| where LogLevel  == "ERROR"
| project TimeGenerated, DagName, LogLevel, DagTaskName, CodePath, Content
This query lists all DAG runs and their corresponding correlation IDs in the mentioned Azure Data Manager for Energy resource.
OEPAirFlowTask
| extend ResourceName = tostring(split(_ResourceId , '/')[-1])
// | where ResourceName == "<the name of ADME instance>"        // to filter on resourceName replace <...> and uncomment line
| distinct DagName, CorrelationId                               // correlationId is same as runId - we have created a duplicate for consistency in search across logs of all services
| sort by DagName asc
We have added document to help you troubleshoot your manifest ingestion process using the Airflow logs collected in your Log Analytics Workspace.
Next steps
Now that you're collecting resource logs, create a log query alert to be proactively notified when interesting data is identified in your log data.
Feedback
Coming soon: Throughout 2024 we will be phasing out GitHub Issues as the feedback mechanism for content and replacing it with a new feedback system. For more information see: https://aka.ms/ContentUserFeedback.
Submit and view feedback for