Quickstart: Run your first Resource Graph query using Azure Resource Graph Explorer
The power of Azure Resource Graph is available directly in the Azure portal through Azure Resource Graph Explorer. Resource Graph Explorer allows you to query information about the Azure Resource Manager resource types and properties. Resource Graph Explorer also provides an interface for working with multiple queries, evaluating the results, and even converting the results of some queries into a chart that can be pinned to an Azure dashboard.
Prerequisites
If you don't have an Azure account, create a free account before you begin.
Run your first Resource Graph query
Run your first query from the Azure portal using Azure Resource Graph Explorer.
Sign in to the Azure portal.
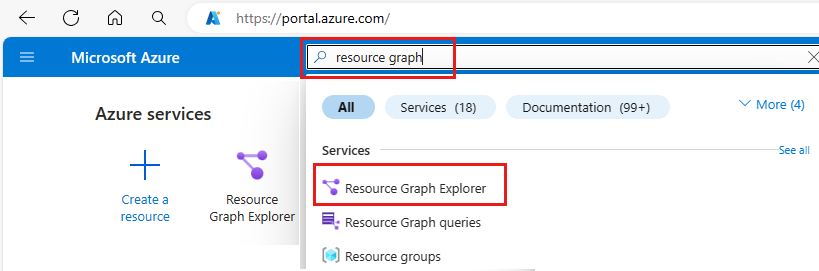
Search for resource graph and select Resource Graph Explorer.
In the Query 1 portion of the window, copy and paste the following query. Then select Run query.
resources
| project name, type
| limit 5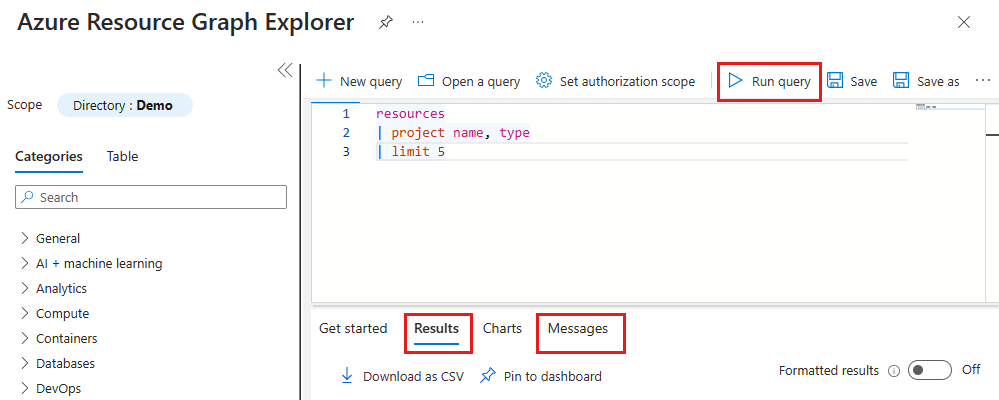
This query example doesn't provide a sort modifier like
order by. If you run this query multiple times, it's likely to yield a different set of resources per request.Review the query response in the Results tab and select the Messages tab to see details about the query, including the count of results and duration of the query. Errors, if any, are displayed in Messages.
Update the query to
order bythe name property. Then, select Run queryresources | project name, type | limit 5 | order by name ascLike the first query, running this query multiple times is likely to yield a different set of resources per request. The order of the query commands is important. In this example, the
order bycomes after thelimit. This command order first limits the query results and then orders them.Update the query to
order bythe name property and thenlimitto the top five results. Then, select Run query.resources | project name, type | order by name asc | limit 5When the final query is run several times, and with no changes in your environment, the results are consistent and ordered by the name property, but still limited to the top five results.
Schema browser
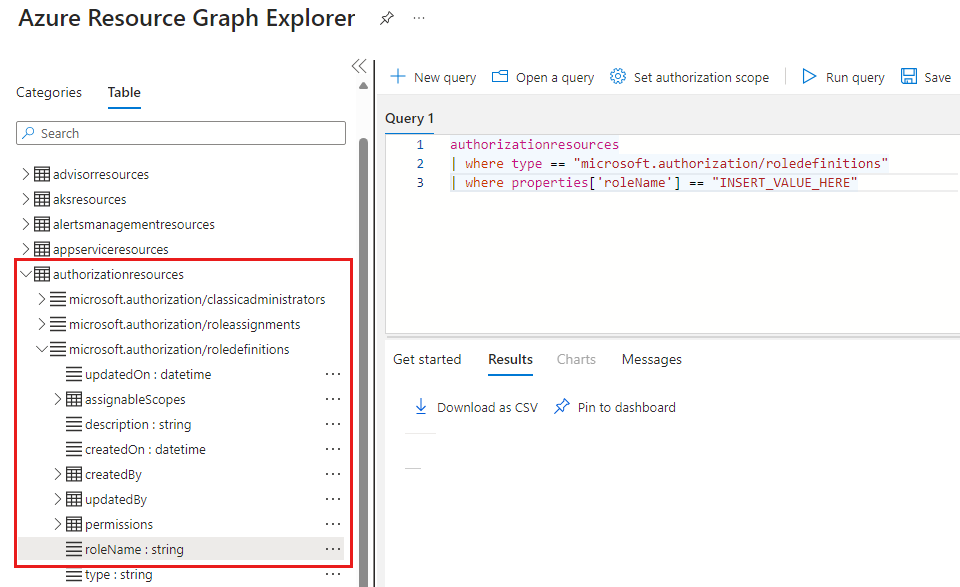
The schema browser is located in the left pane of Resource Graph Explorer. This list of resources shows all the resource types of Azure resources supported by Azure Resource Graph and that exist in your tenant. Select a resource type or property to show child properties that can be used to create a Resource Graph query.
Select a table name from the schema browser and it gets added to the query. When you select a resource type it gets added to the query, like where type =="<resource type>". If you select a property it gets added to the next line in the query, like where <propertyName> == "INSERT_VALUE_HERE". You can use the schema browser to find properties that you can use in queries. Be sure to replace INSERT_VALUE_HERE with your own value, and adjust the query with conditions, operators, and functions.
This example shows a query that was built from the schema browser by selecting the table authorizationresources with resource type microsoft.authorization/roledefinitions and the property roleName.
authorizationresources
| where type == "microsoft.authorization/roledefinitions"
| where properties['roleName'] == "INSERT_VALUE_HERE"
Download query results as a CSV file
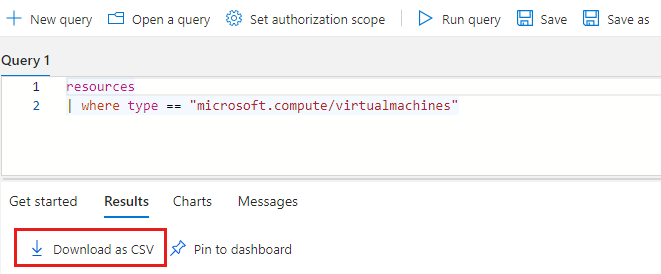
To download comma-separated values (CSV) results from the Azure portal, browse to the Azure Resource Graph Explorer and run a query. On the toolbar, select Download as CSV as shown in the following screenshot:
When you use the Download as CSV export functionality of Azure Resource Graph Explorer, the result set is limited to 55,000 records. This limitation is a platform limit that can't be overridden by filing an Azure support ticket.
Create a chart from the Resource Graph query
After running the previous query, if you select the Charts tab, you get a message that "the result set isn't compatible with a pie chart visualization." Queries that list results can't be made into a chart, but queries that provide counts of resources can.
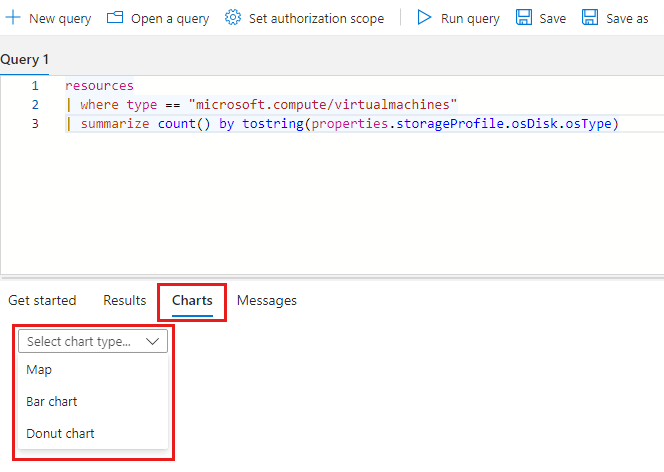
In the Query 1 portion of the window, enter the following query and select Run query.
resources
| where type == "microsoft.compute/virtualmachines"
| summarize count() by tostring(properties.storageProfile.osDisk.osType)
Select the Results tab and note that the response for this query provides counts.
Select the Charts tab. Change the type from Select chart type... to either Bar chart or Donut chart.
Pin the query visualization to a dashboard
When you have results from a query that can be visualized, that data visualization can be pinned to your Azure portal dashboard. After running the previous query, follow these steps:
- Select Save and provide the name VM by OS type. Then select Save at the bottom of the right pane.
- Select Run query to rerun the query you saved.
- On the Charts tab, select a data visualization. Then select Pin to dashboard.
- From Pin to Dashboard select the existing dashboard where you want the chart to appear.
The query is now available on your dashboard with the title VM by OS type. If the query wasn't saved before it was pinned, the name is Query 1 instead.
The query and resulting data visualization run and update each time the dashboard loads, providing real time and dynamic insights to your Azure environment directly in your workflow.
Queries that result in a list can also be pinned to the dashboard. The feature isn't limited to data visualizations of queries.
For more information about working with dashboards, see Create a dashboard in the Azure portal.
Clean up resources
If you want to remove the sample Resource Graph dashboards from your Azure portal environment, do the following steps:
- Select Dashboard from the hamburger menu (three horizontal lines) on the top, left side of any portal page.
- On your dashboard, find the VM by OS type chart and select the ellipsis (
...) to display the menu. - Select Remove from dashboard select Save to confirm.
Next steps
In this quickstart, you used Azure Resource Graph Explorer to run your first query and looked at dashboard examples powered by Resource Graph. To learn more about the Resource Graph language, continue to the query language details page.
Feedback
Coming soon: Throughout 2024 we will be phasing out GitHub Issues as the feedback mechanism for content and replacing it with a new feedback system. For more information see: https://aka.ms/ContentUserFeedback.
Submit and view feedback for