Troubleshoot Apache Hadoop YARN by using Azure HDInsight
Learn about the top issues and their resolutions when working with Apache Hadoop YARN payloads in Apache Ambari.
How do I create a new YARN queue on a cluster?
Resolution steps
Use the following steps in Ambari to create a new YARN queue, and then balance the capacity allocation among all the queues.
In this example, two existing queues (default and thriftsvr) both are changed from 50% capacity to 25% capacity, which gives the new queue (spark) 50% capacity.
| Queue | Capacity | Maximum capacity |
|---|---|---|
| default | 25% | 50% |
| thrftsvr | 25% | 50% |
| spark | 50% | 50% |
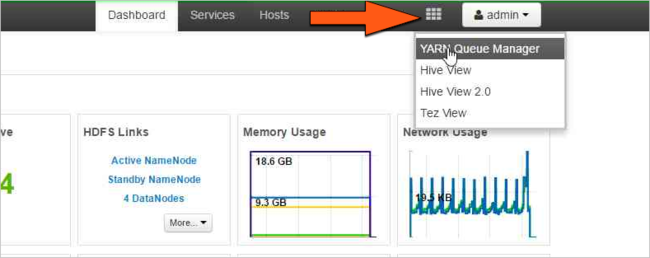
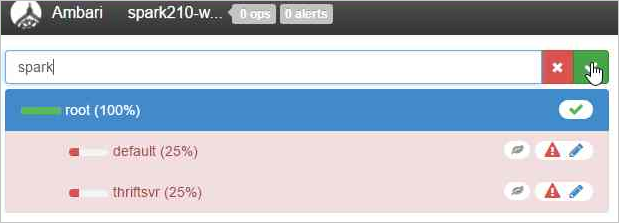
Select the Ambari Views icon, and then select the grid pattern. Next, select YARN Queue Manager.
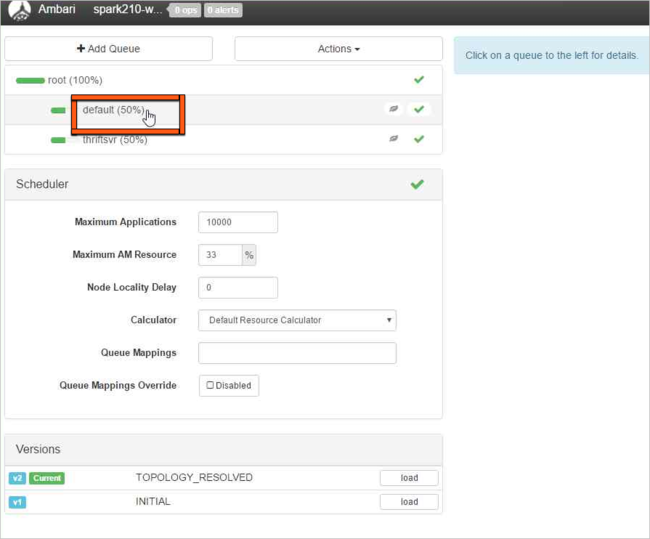
Select the default queue.
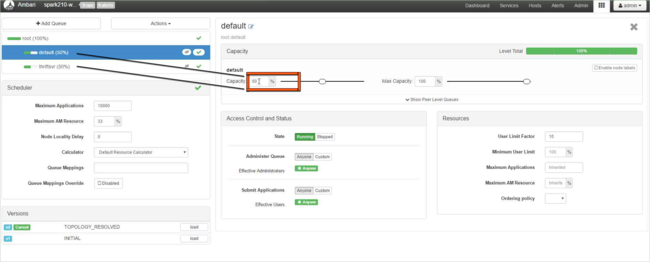
For the default queue, change the capacity from 50% to 25%. For the thriftsvr queue, change the capacity to 25%.
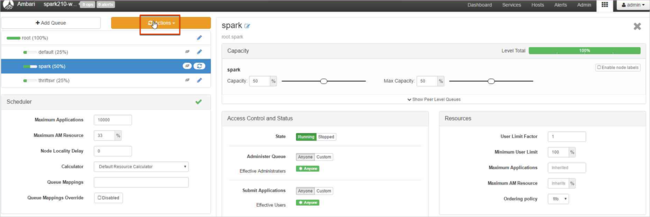
To create a new queue, select Add Queue.
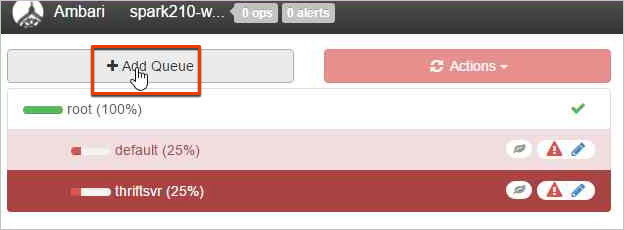
Name the new queue.
Leave the capacity values at 50%, and then select the Actions button.
Select Save and Refresh Queues.
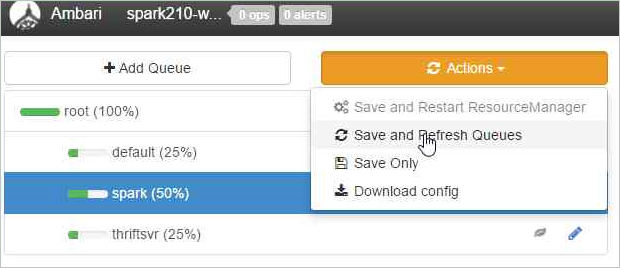
These changes are visible immediately on the YARN Scheduler UI.
Further reading
How do I download YARN logs from a cluster?
Resolution steps
Connect to the HDInsight cluster by using a Secure Shell (SSH) client. For more information, see Further reading.
To list all the application IDs of the YARN applications that are currently running, run the following command:
yarn topThe IDs are listed in the APPLICATIONID column. You can download logs from the APPLICATIONID column.
YARN top - 18:00:07, up 19d, 0:14, 0 active users, queue(s): root
NodeManager(s): 4 total, 4 active, 0 unhealthy, 0 decommissioned, 0 lost, 0 rebooted
Queue(s) Applications: 2 running, 10 submitted, 0 pending, 8 completed, 0 killed, 0 failed
Queue(s) Mem(GB): 97 available, 3 allocated, 0 pending, 0 reserved
Queue(s) VCores: 58 available, 2 allocated, 0 pending, 0 reserved
Queue(s) Containers: 2 allocated, 0 pending, 0 reserved

                  APPLICATIONID USER             TYPE      QUEUE   #CONT  #RCONT  VCORES RVCORES     MEM    RMEM  VCORESECS    MEMSECS %PROGR       TIME NAME
 application_1490377567345_0007 hive            spark  thriftsvr       1       0       1       0      1G      0G    1628407    2442611  10.00   18:20:20 Thrift JDBC/ODBC Server
 application_1490377567345_0006 hive            spark  thriftsvr       1       0       1       0      1G      0G    1628430    2442645  10.00   18:20:20 Thrift JDBC/ODBC Server
To download YARN container logs for all application masters, use the following command:
yarn logs -applicationIdn logs -applicationId <application_id> -am ALL > amlogs.txtThis command creates a log file named amlogs.txt.
To download YARN container logs for only the latest application master, use the following command:
yarn logs -applicationIdn logs -applicationId <application_id> -am -1 > latestamlogs.txtThis command creates a log file named latestamlogs.txt.
To download YARN container logs for the first two application masters, use the following command:
yarn logs -applicationIdn logs -applicationId <application_id> -am 1,2 > first2amlogs.txtThis command creates a log file named first2amlogs.txt.
To download all YARN container logs, use the following command:
yarn logs -applicationIdn logs -applicationId <application_id> > logs.txtThis command creates a log file named logs.txt.
To download the YARN container log for a specific container, use the following command:
yarn logs -applicationIdn logs -applicationId <application_id> -containerId <container_id> > containerlogs.txtThis command creates a log file named containerlogs.txt.
Additional reading
How do I check Yarn Application Diagnostics Information?
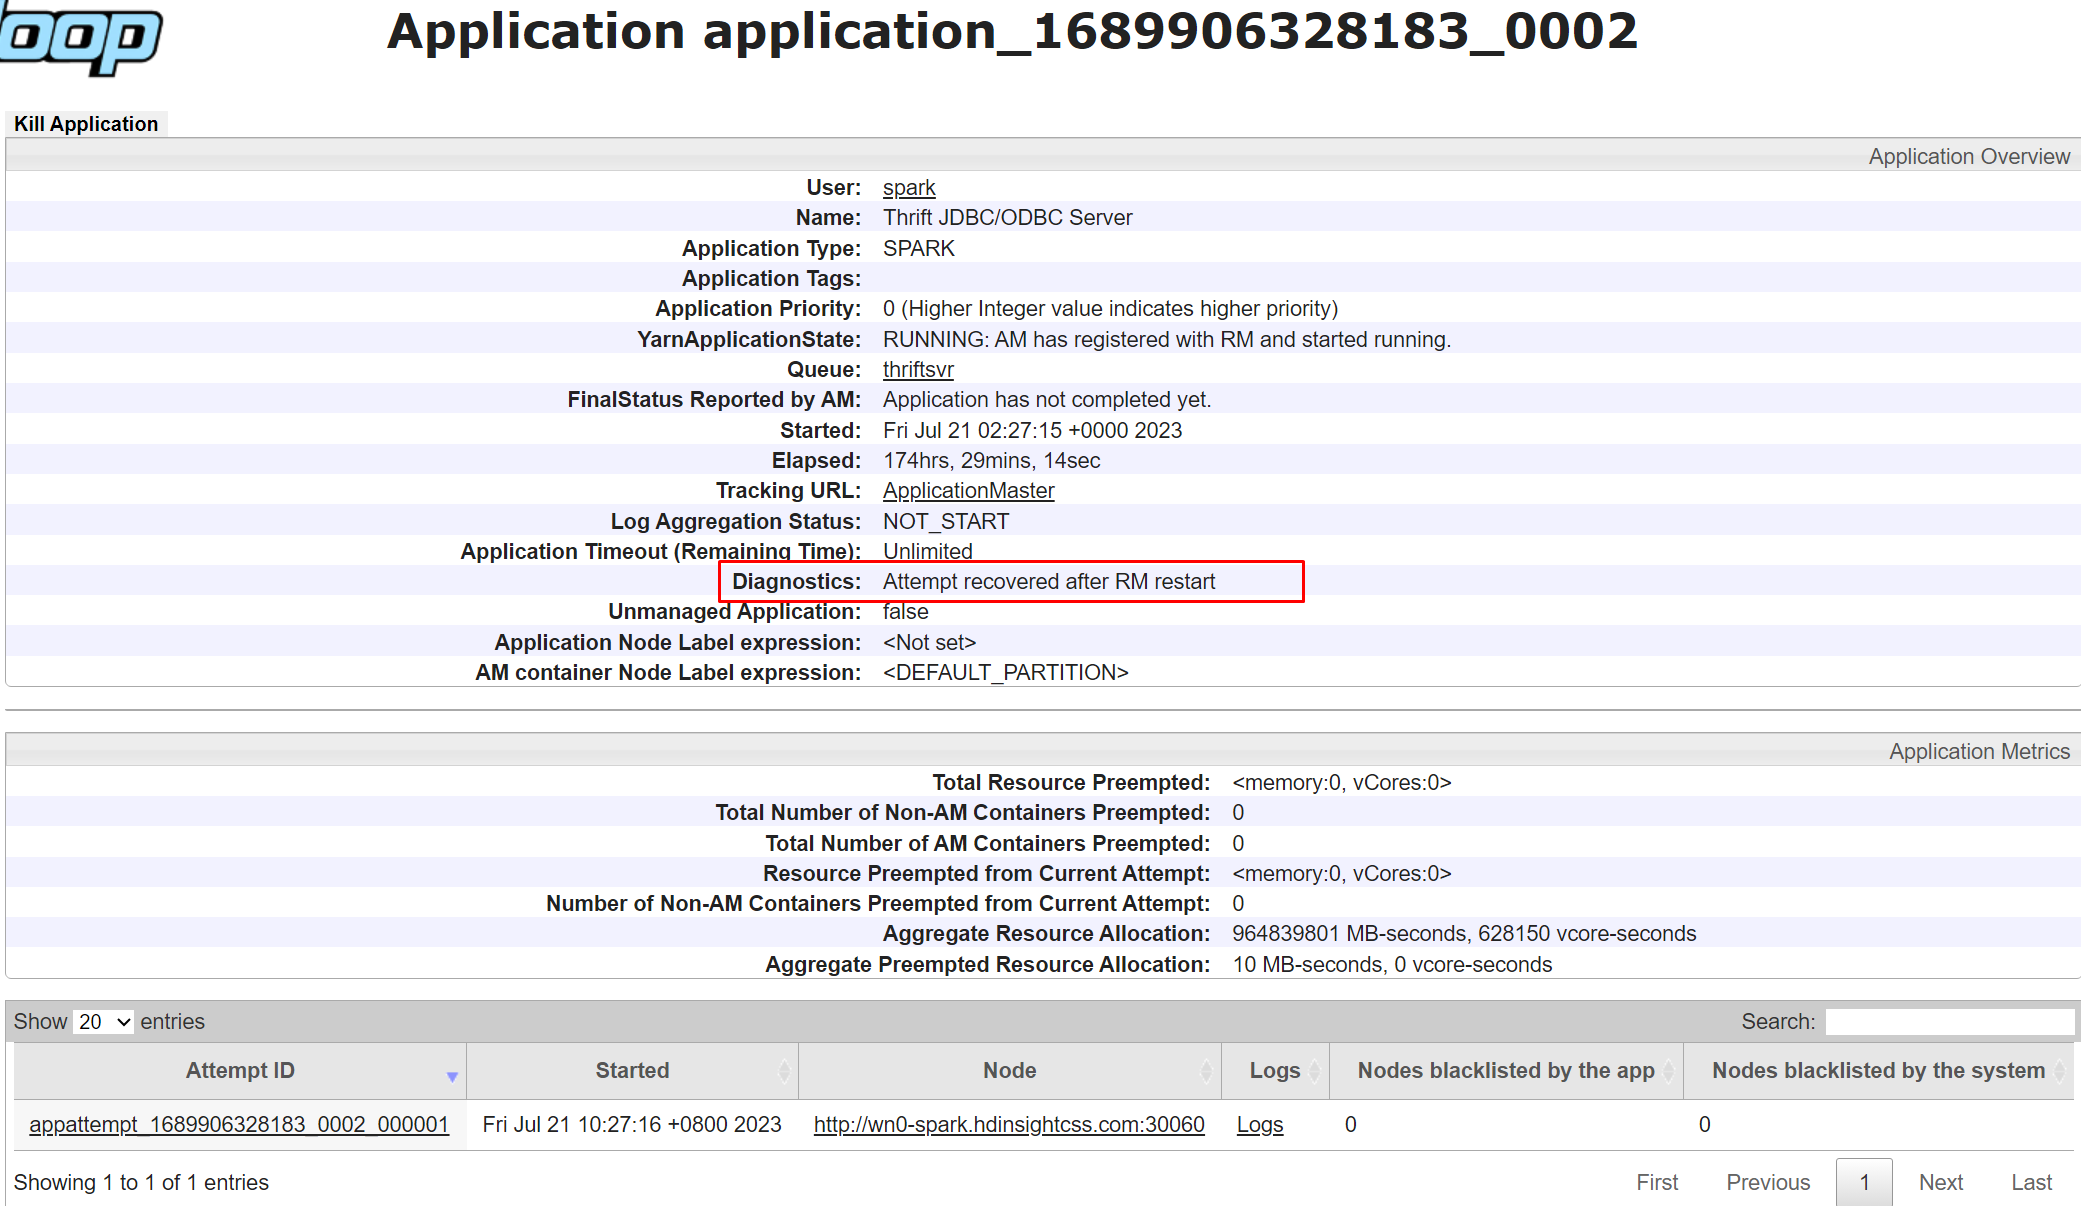
Diagnostics in Yarn UI is a feature that allows you to view the status and logs of your applications running on Yarn. Diagnostics can help you troubleshoot and debug your applications, as well as monitor their performance and resource usage.
To view the diagnostics of a specific application, you can click on the application ID in the applications list. On the application details page, you can also see a list of all the attempts that have been made to run the application. You can click on any attempt to see more details, such as the attempt ID, container ID, node ID, start time, finish time, and diagnostics
How do I troubleshoot YARN common issues?
Yarn UI isn't loading
If your YARN UI isn't loading or is unreachable, and it returns "HTTP Error 502.3 - Bad Gateway," it highly indicates your Resource Manager service is unhealthy. To mitigate the issue, follow these steps:
- Go to Ambari UI > YARN > SUMMARY and check to see if only the active Resource Manager is in the Started state. If not, try to mitigate by restarting the unhealthy or stopped Resource Manager.
- If step 1 doesn't resolve the issue, SSH the active Resource Manager head node and check the garbage collection status using
jstat -gcutil <Resource Manager pid> 1000 100. If you see the FGCT increase significantly in just a few seconds, it indicates Resource Manager is busy in Full GC, and is unable to process the other requests. - Go to Ambari UI > YARN > CONFIGS > Advanced and increase
Resource Manager java heap size. - Restart required services in Ambari UI.
Both resource managers are in standby
- Check Resource Manager log to see if similar error exists.
Service RMActiveServices failed in state STARTED; cause: org.apache.hadoop.service.ServiceStateException: com.google.protobuf.InvalidProtocolBufferException: Could not obtain block: BP-452067264-10.0.0.16-1608006815288:blk_1074235266_494491 file=/yarn/node-labels/nodelabel.mirror
If the error exists, check to see if some files are under replication or if there are missing blocks in the HDFS. You can run
hdfs fsck hdfs://mycluster/Run
hdfs fsck hdfs://mycluster/ -deletetoo forcefully cleanup the HDFS and to get rid of the standby RM issue. Alternatively, run PatchYarnNodeLabel on one of headnodes to patch the cluster.
Next steps
If you didn't see your problem or are unable to solve your issue, visit one of the following channels for more support:
Get answers from Azure experts through Azure Community Support.
Connect with @AzureSupport - the official Microsoft Azure account for improving customer experience. Connecting the Azure community to the right resources: answers, support, and experts.
If you need more help, you can submit a support request from the Azure portal. Select Support from the menu bar or open the Help + support hub. For more detailed information, review How to create an Azure support request. Access to Subscription Management and billing support is included with your Microsoft Azure subscription, and Technical Support is provided through one of the Azure Support Plans.
Feedback
Coming soon: Throughout 2024 we will be phasing out GitHub Issues as the feedback mechanism for content and replacing it with a new feedback system. For more information see: https://aka.ms/ContentUserFeedback.
Submit and view feedback for