Use the extended features of the Apache Spark History Server to debug and diagnose Spark applications
This article shows you how to use the extended features of the Apache Spark History Server to debug and diagnose completed or running Spark applications. The extension includes a Data tab, a Graph tab, and a Diagnosis tab. On the Data tab, you can check the input and output data of the Spark job. On the Graph tab, you can check the data flow and replay the job graph. On the Diagnosis tab, you can refer to the Data Skew, Time Skew, and Executor Usage Analysis features.
Get access to the Spark History Server
The Spark History Server is the web UI for completed and running Spark applications. You can open it either from the Azure portal or from a URL.
Open the Spark History Server web UI from the Azure portal
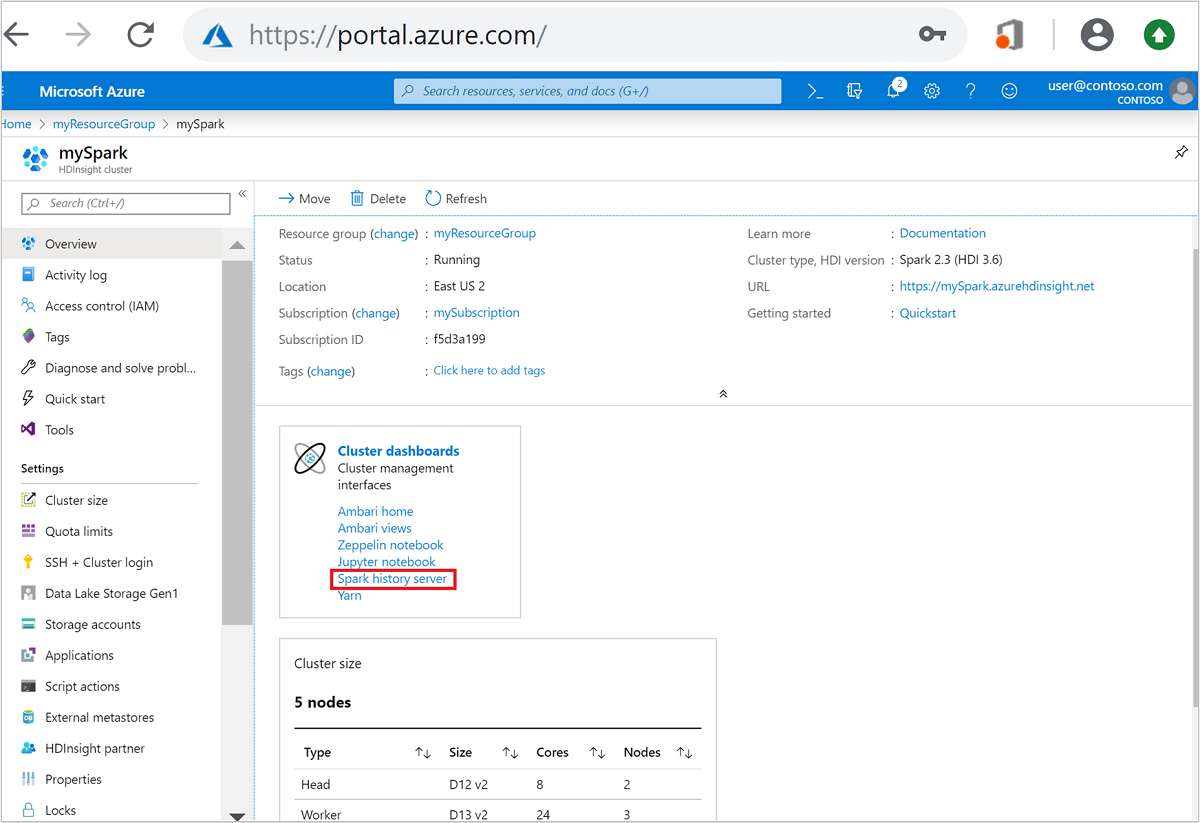
From the Azure portal, open the Spark cluster. For more information, see List and show clusters.
From Cluster dashboards, select Spark history server. When prompted, enter the admin credentials for the Spark cluster.
 the Azure portal." border="true":::
Open the Spark History Server web UI by URL
Open the Spark History Server by browsing to https://CLUSTERNAME.azurehdinsight.net/sparkhistory, where CLUSTERNAME is the name of your Spark cluster.
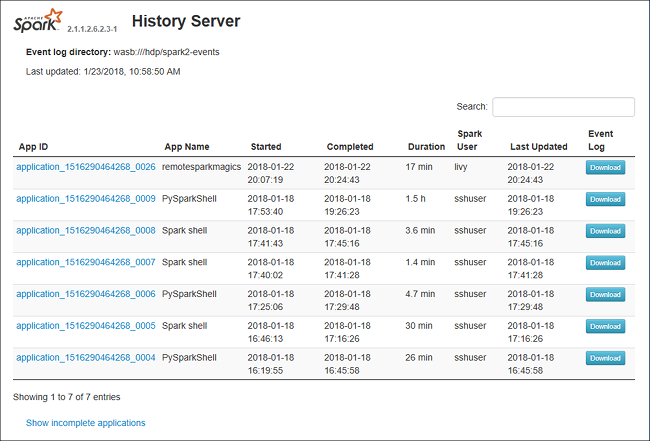
The Spark History Server web UI may look similar to this image:
Use the Data tab in the Spark History Server
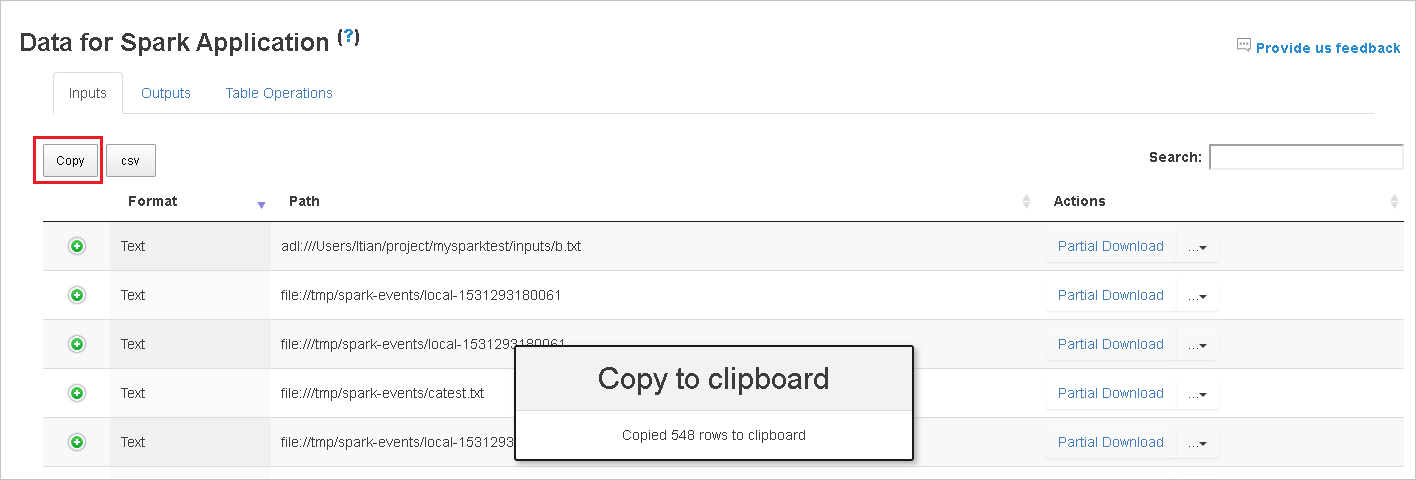
Select the job ID, and then select Data on the tool menu to see the data view.
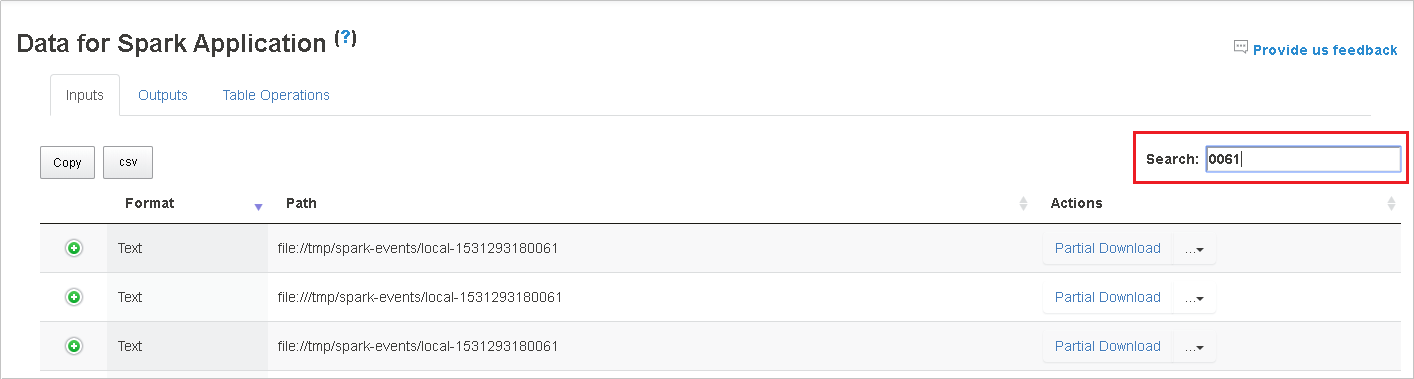
Review Inputs, Outputs, and Table Operations by selecting the individual tabs.

Copy all rows by selecting the Copy button.
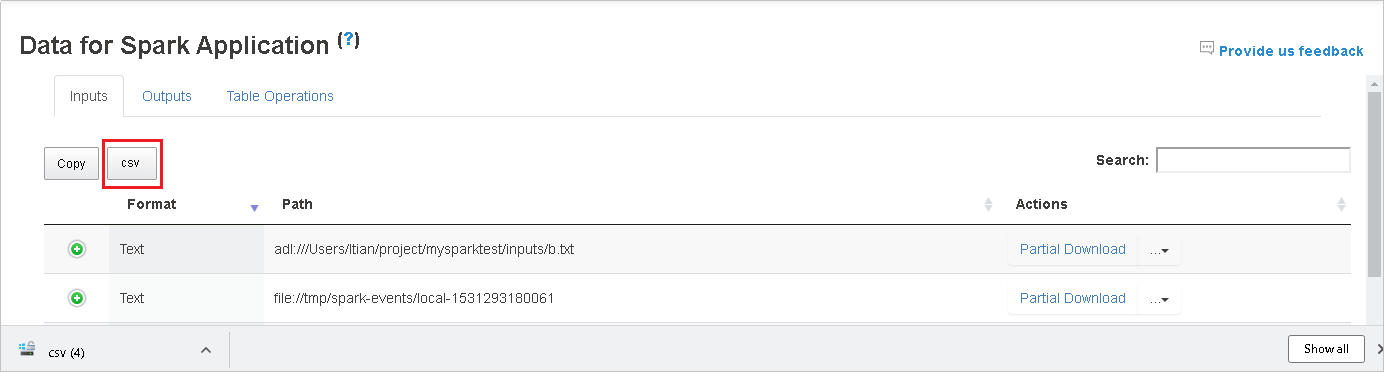
Save all the data as a .CSV file by selecting the csv button.
Search the data by entering keywords in the Search field. The search results will display immediately.
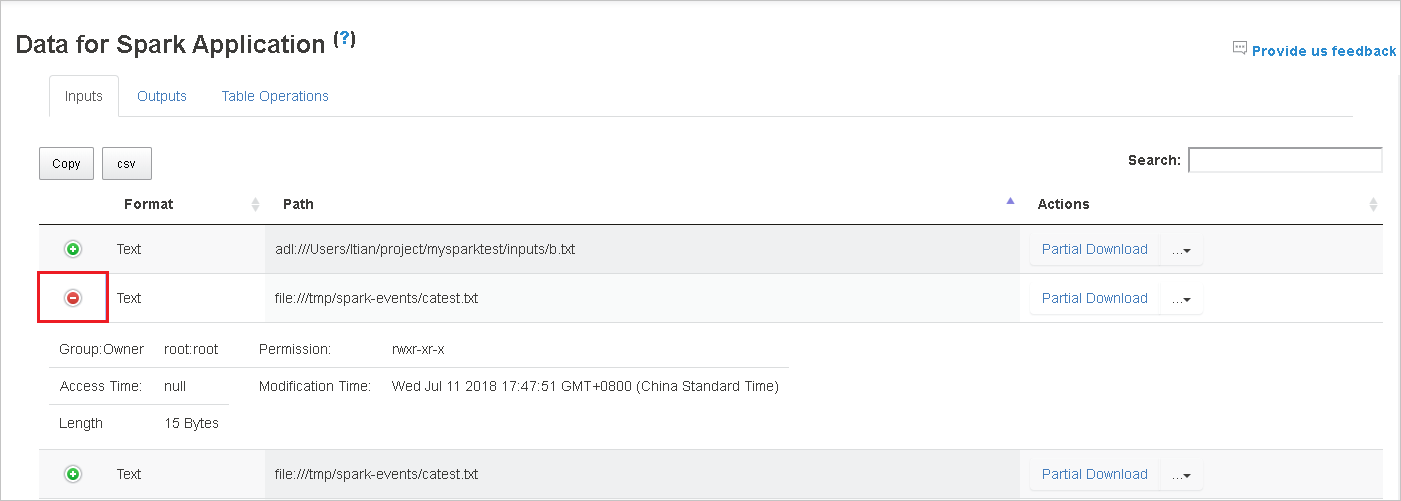
Select the column header to sort the table. Select the plus sign to expand a row to show more details. Select the minus sign to collapse a row.
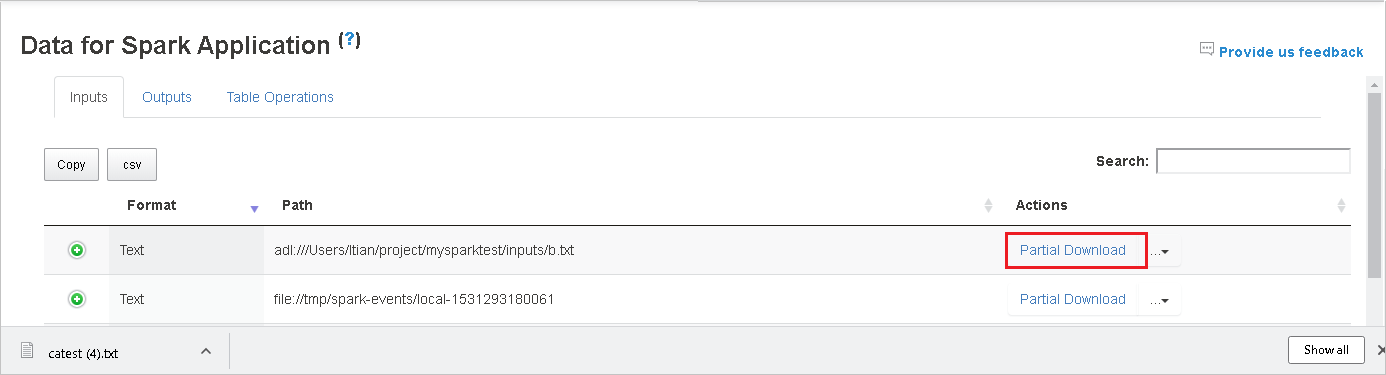
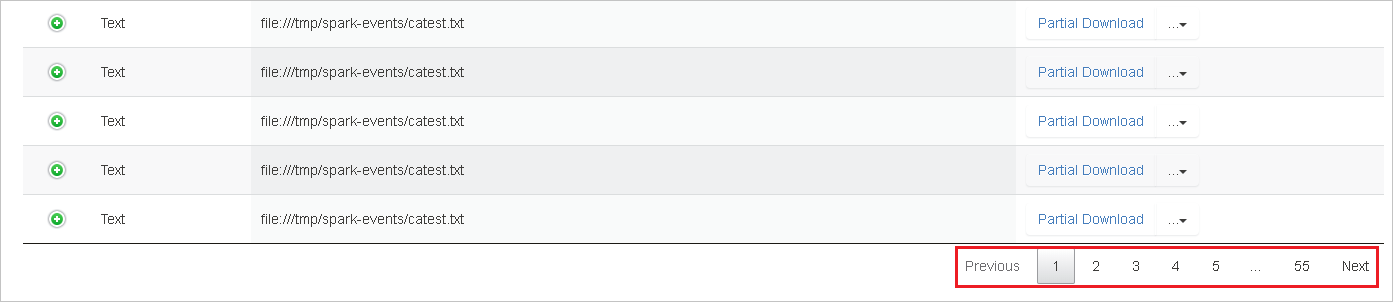
Download a single file by selecting the Partial Download button on the right. The selected file will download locally. If the file doesn't exist anymore, this will open a new tab to show the error messages.
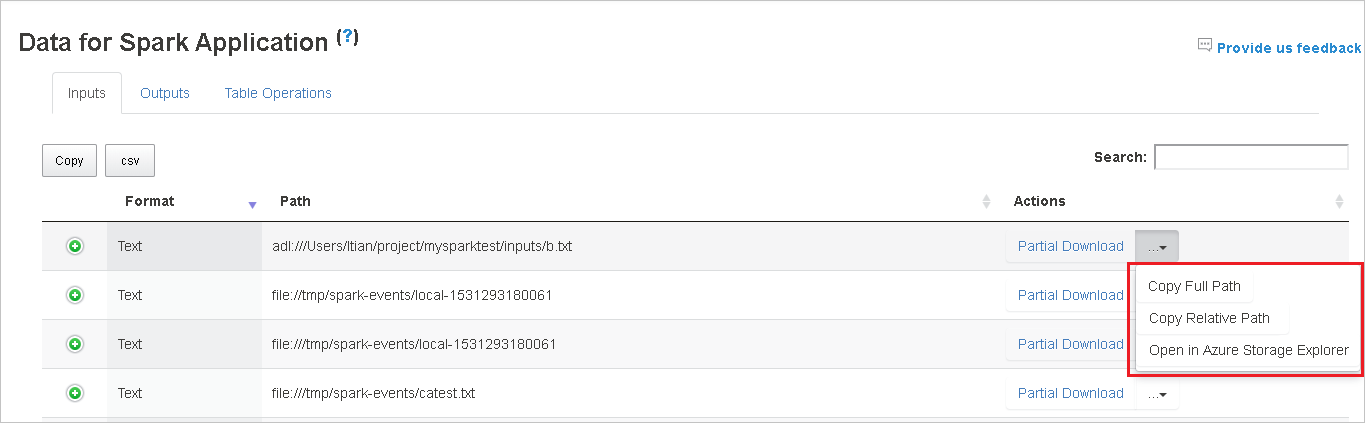
Copy a full path or a relative path by selecting either the Copy Full Path or Copy Relative Path option, which expand from the download menu. For Azure Data Lake Storage files, select Open in Azure Storage Explorer to launch Azure Storage Explorer and locate the folder after sign-in.
If there are too many rows to display on a single page, select the page numbers at the bottom of the table to navigate.
For more information, hover over or select the question mark next to Data for Spark Application to show the tooltip.
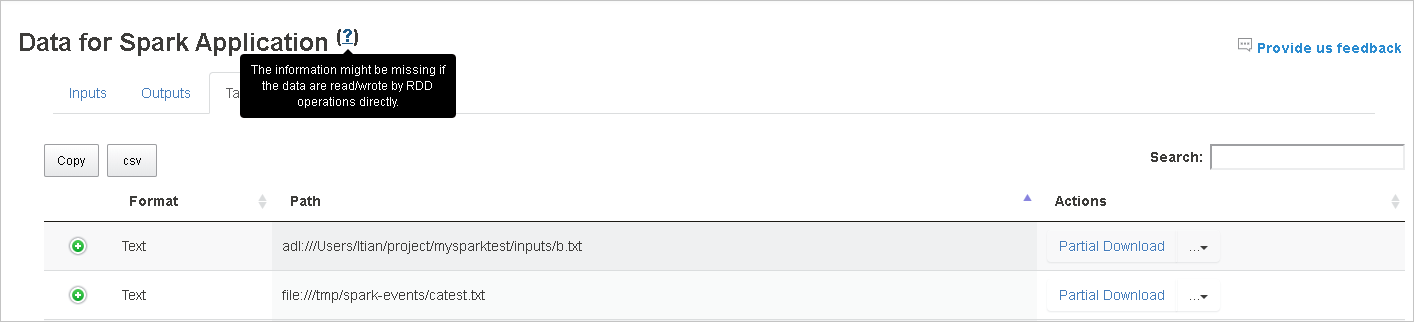
To send feedback on issues, select Provide us feedback.
Use the Graph tab in the Spark History Server
Select the job ID, and then select Graph on the tool menu to see the job graph. By default, the graph will show all of the jobs. Filter the results by using the Job ID drop-down menu.
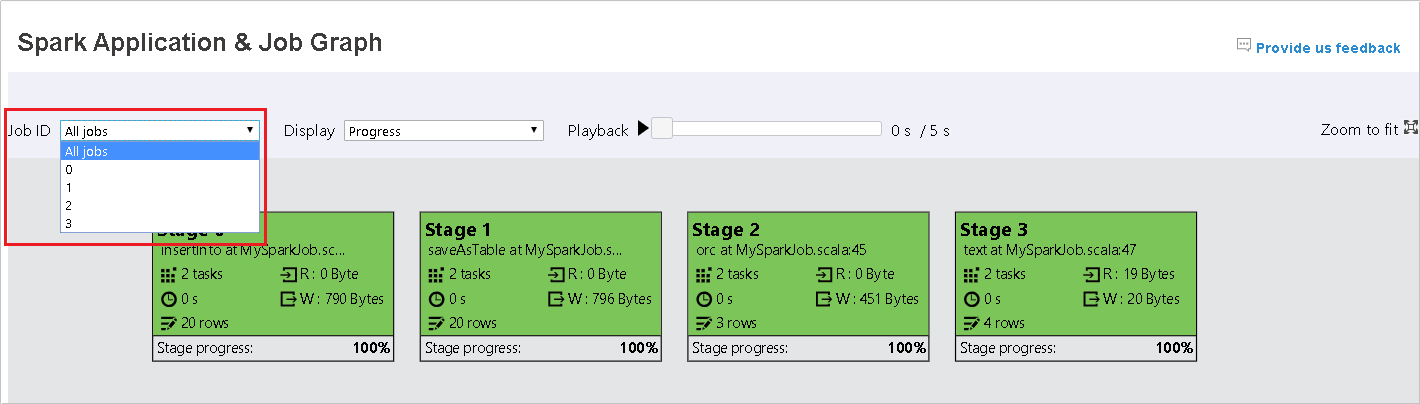
Progress is selected by default. Check the data flow by selecting Read or Written in the Display drop-down menu.
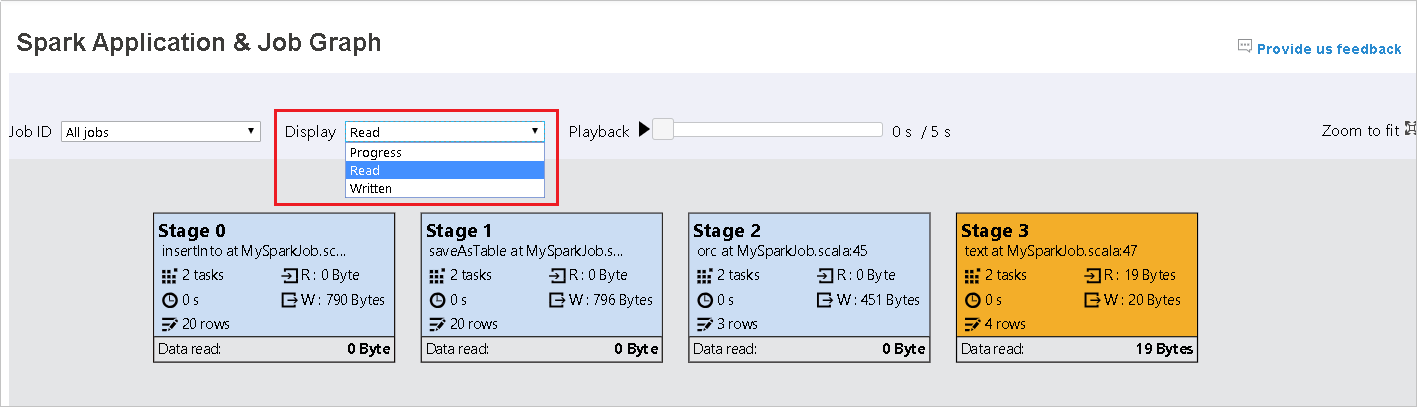
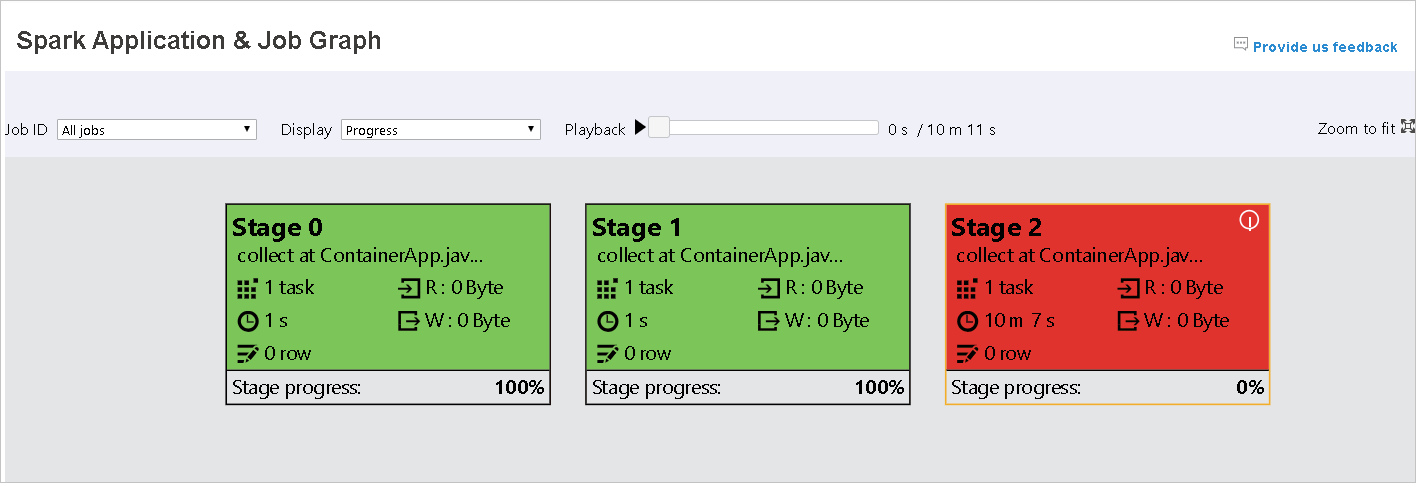
The background color of each task corresponds to a heat map.
Color Description Green The job has completed successfully. Orange The task failed, but this doesn't affect the final result of the job. These tasks have duplicate or retry instances that may succeed later. Blue The task is running. White The task is waiting to run, or the stage has skipped. Red The task has failed. 
The skipped stages display in white.
Note
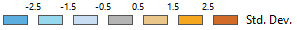
Playback is available for completed jobs. Select the Playback button to play the job back. Stop the job at any time by selecting the stop button. When a job is played back, each task will display its status by color. Playback is not supported for incomplete jobs.
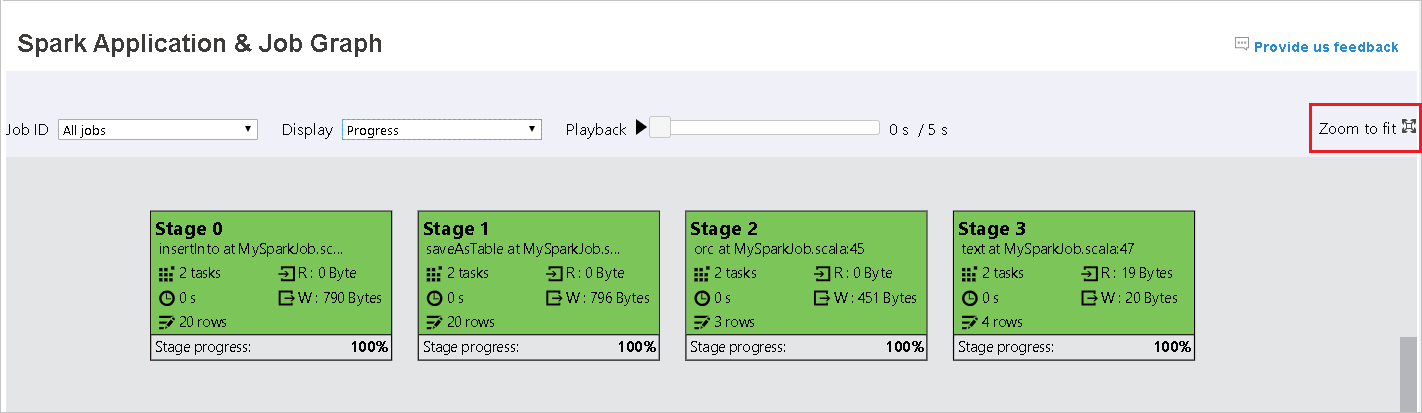
Scroll to zoom in or out on the job graph, or select Zoom to fit to make it fit to the screen.
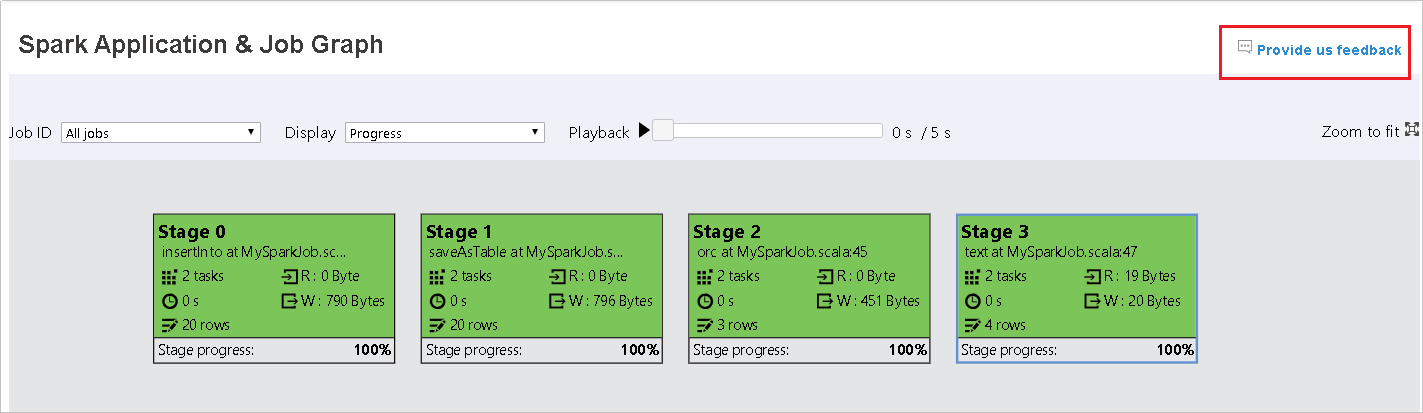
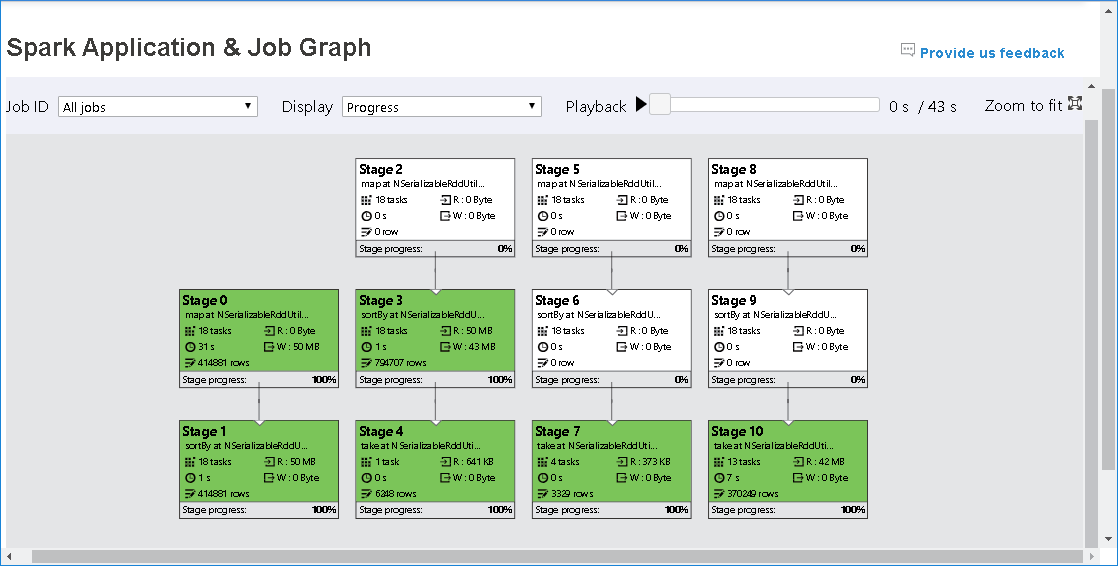
When tasks fail, hover over the graph node to see the tooltip, and then select the stage to open it in a new page.
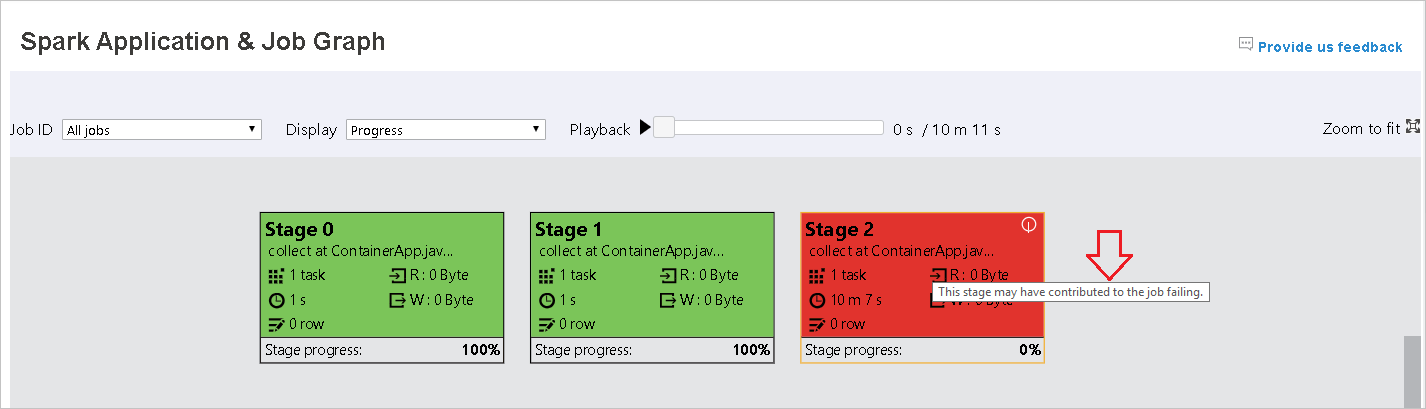
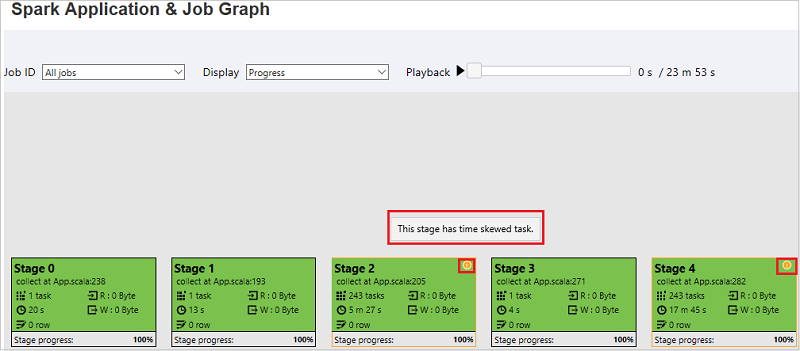
On the Spark Application & Job Graph page, the stages will display tooltips and small icons if the tasks meet these conditions:
Data skew: Data read size > average data read size of all tasks inside this stage * 2 and data read size > 10 MB.
Time skew: Execution time > average execution time of all tasks inside this stage * 2 and execution time > 2 mins.
The job graph node will display the following information about each stage:
ID
Name or description
Total task number
Data read: the sum of input size and shuffle read size
Data write: the sum of output size and shuffle write size
Execution time: the time between start time of the first attempt and completion time of the last attempt
Row count: the sum of input records, output records, shuffle read records, and shuffle write records
Progress
Note
By default, the job graph node will display information from last attempt of each stage (except for stage execution time). But during playback, the job graph node will show information about each attempt.
Note
For data read and data write sizes, we use 1MB = 1000 KB = 1000 * 1000 bytes.
Send feedback about issues by selecting Provide us feedback.
Use the Diagnosis tab in the Spark History Server
Select the job ID, and then select Diagnosis on the tool menu to see the job diagnosis view. The Diagnosis tab includes Data Skew, Time Skew, and Executor Usage Analysis.
Review Data Skew, Time Skew, and Executor Usage Analysis by selecting the tabs respectively.
Data Skew
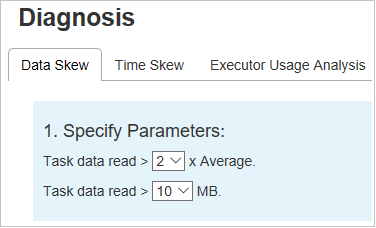
Select the Data Skew tab. The corresponding skewed tasks display based on the specified parameters.
Specify Parameters
The Specify Parameters section displays the parameters, which are used to detect Data Skew. The default rule is: The task data read is greater than three times of the average task data read, and the task data read is more than 10 MB. If you want to define your own rule for skewed tasks, you can choose your parameters. The Skewed Stage and Skew Chart sections will update accordingly.
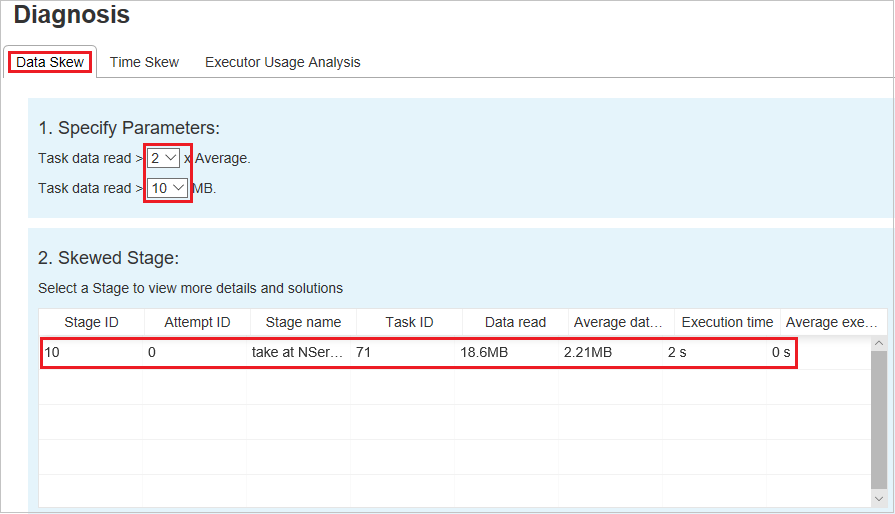
Skewed Stage
The Skewed Stage section displays stages that have skewed tasks meeting the specified criteria. If there's more than one skewed task in a stage, the Skewed Stage section displays only the most skewed task (that is, the largest data for data skew).
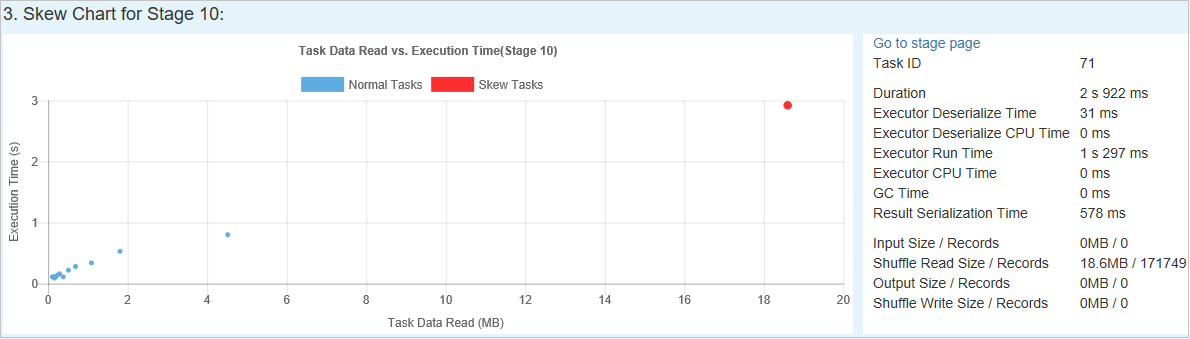
Skew Chart
When you select a row in the Skew Stage table, the Skew Chart displays more task distribution details based on data read and execution time. The skewed tasks are marked in red, and the normal tasks are marked in blue. For performance consideration, the chart displays up to 100 sample tasks. The task details are displayed in the lower-right panel.
Time Skew
The Time Skew tab displays skewed tasks based on task execution time.
Specify Parameters
The Specify Parameters section displays the parameters, which are used to detect time skew. The default rule is: Task execution time is greater than three times of average execution time, and task execution time is greater than 30 seconds. You can change the parameters based on your needs. The Skewed Stage and Skew Chart display the corresponding stages and tasks information, just like in the Data Skew tab.
When you select Time Skew, the filtered result displays in the Skewed Stage section, according to the parameters set in the Specify Parameters section. When you select one item in the Skewed Stage section, the corresponding chart is drafted in the third section, and the task details display in the lower-right panel.

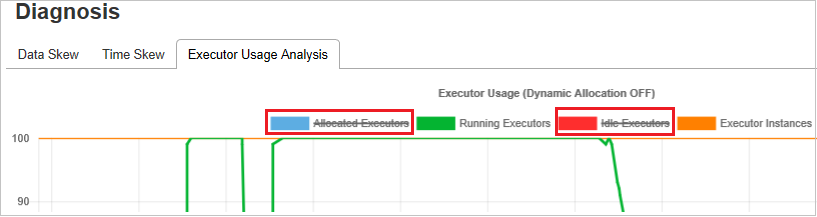
Executor Usage Analysis graphs
The Executor Usage Graph displays the job's actual executor allocation and running status.
When you select Executor Usage Analysis, four different curves about executor usage are drafted: Allocated Executors, Running Executors, idle Executors, and Max Executor Instances. Each Executor added or Executor removed event will increase or decrease the allocated executors. You can check Event Timeline in the Jobs tab for more comparisons.
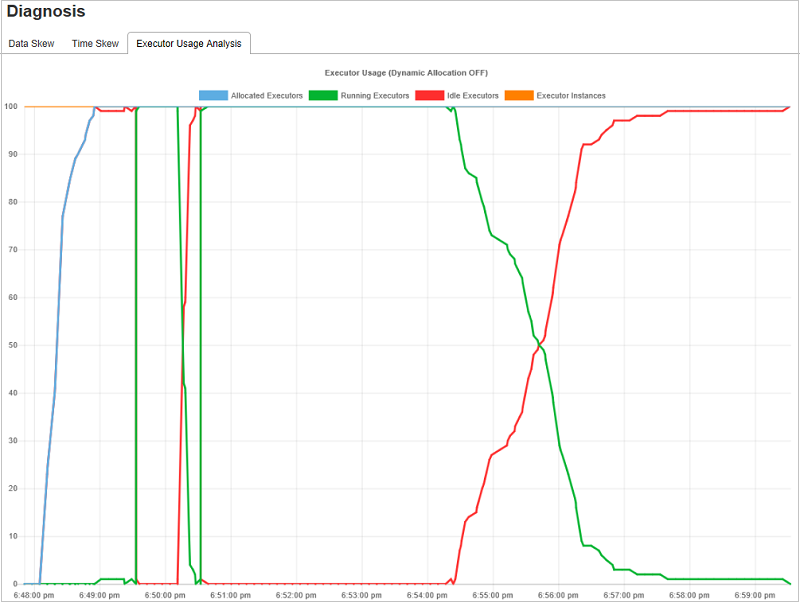
Select the color icon to select or unselect the corresponding content in all drafts.
FAQ
How do I revert to the community version?
To revert to the community version, do the following steps.
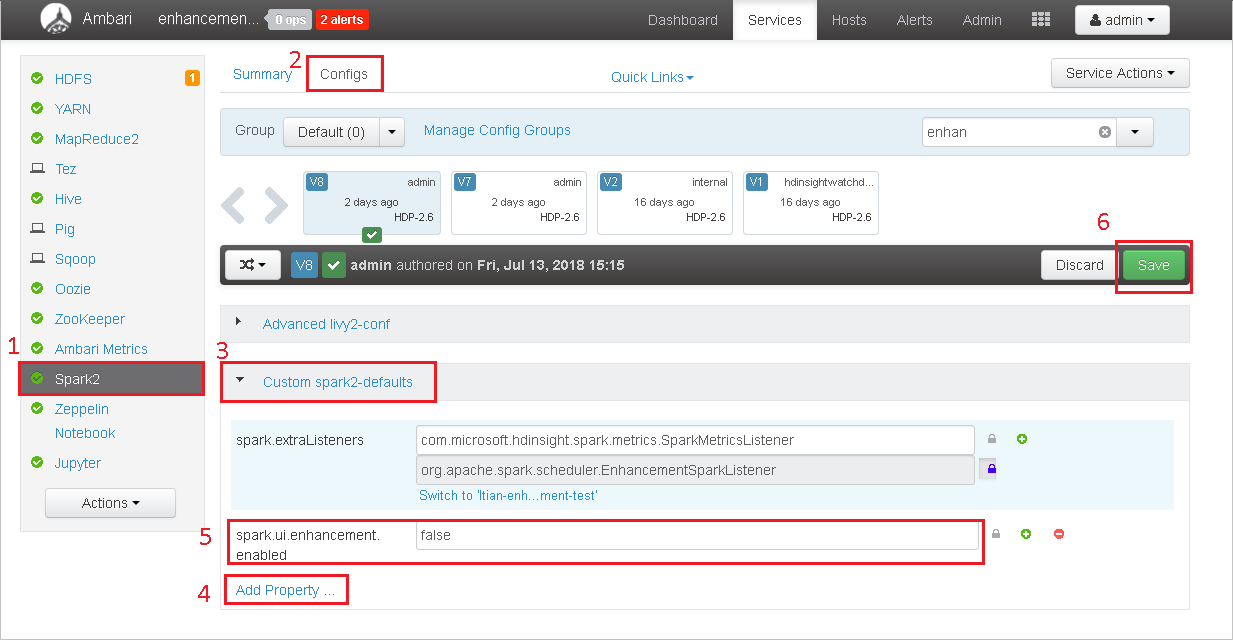
Open the cluster in Ambari.
Navigate to Spark2 > Configs.
Select Custom spark2-defaults.
Select Add Property ....
Add spark.ui.enhancement.enabled=false, and then save it.
The property sets to false now.
Select Save to save the configuration.
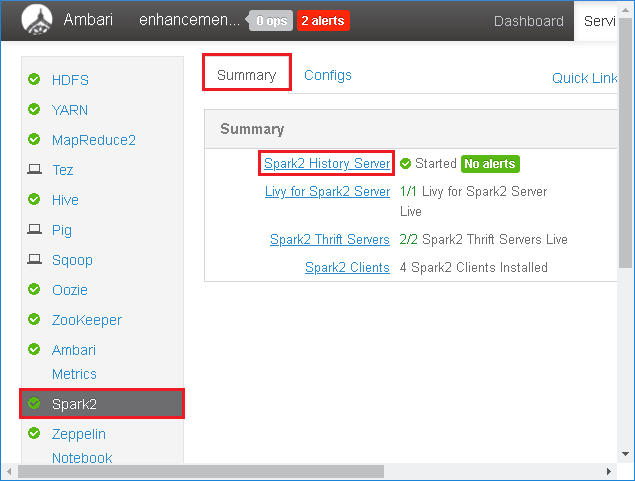
Select Spark2 in the left panel. Then, on the Summary tab, select Spark2 History Server.
To restart the Spark History Server, select the Started button to the right of Spark2 History Server, and then select Restart from the drop-down menu.

Refresh the Spark History Server web UI. It will revert to the community version.
How do I upload a Spark History Server event to report it as an issue?
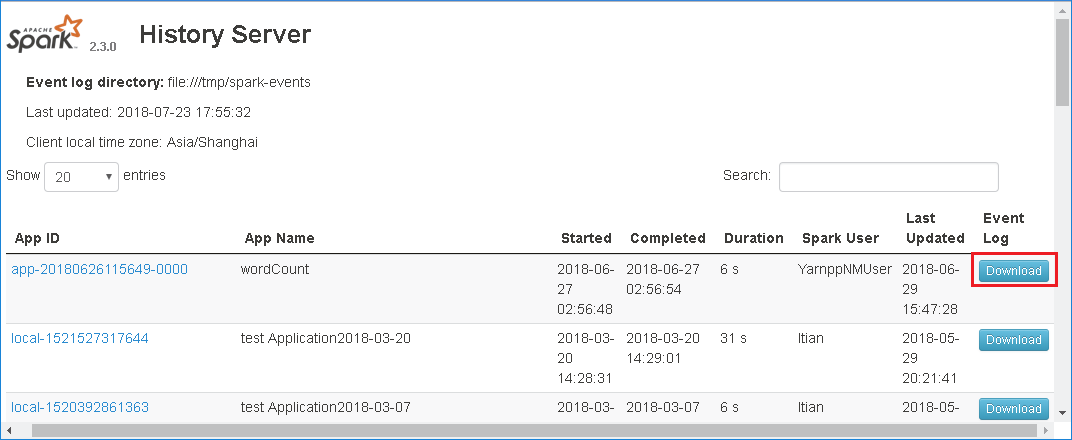
If you run into an error in Spark History Server, do the following steps to report the event.
Download the event by selecting Download in the Spark History Server web UI.
Select Provide us feedback from the Spark Application & Job Graph page.
Provide the title and a description of the error. Then, drag the .zip file to the edit field and select Submit new issue.

How do I upgrade a .jar file in a hotfix scenario?
If you want to upgrade with a hotfix, use the following script, which will upgrade spark-enhancement.jar*.
upgrade_spark_enhancement.sh:
 #!/usr/bin/env bash

 # Copyright (C) Microsoft Corporation. All rights reserved.

 # Arguments:
 # $1 Enhancement jar path

 if [ "$#" -ne 1 ]; then
     >&2 echo "Please provide the upgrade jar path."
     exit 1
 fi

 install_jar() {
     tmp_jar_path="/tmp/spark-enhancement-hotfix-$( date +%s )"

     if wget -O "$tmp_jar_path" "$2"; then
         for FILE in "$1"/spark-enhancement*.jar
         do
             back_up_path="$FILE.original.$( date +%s )"
             echo "Back up $FILE to $back_up_path"
             mv "$FILE" "$back_up_path"
             echo "Copy the hotfix jar file from $tmp_jar_path   to $FILE"
             cp "$tmp_jar_path" "$FILE"

             "Hotfix done."
             break
         done
     else
         >&2 echo "Download jar file failed."
         exit 1
     fi
 }

 jars_folder="/usr/hdp/current/spark2-client/jars"
 jar_path=$1

 if ls ${jars_folder}/spark-enhancement*.jar 1>/dev/null 2>&1;   then
     install_jar "$jars_folder" "$jar_path"
 else
     >&2 echo "There is no target jar on this node. Exit with no action."
     exit 0
 fi
Usage
upgrade_spark_enhancement.sh https://${jar_path}
Example
upgrade_spark_enhancement.sh https://${account_name}.blob.core.windows.net/packages/jars/spark-enhancement-${version}.jar
Use the bash file from the Azure portal
Launch the Azure portal, and then select your cluster.
Complete a script action with the following parameters.
Property Value Script type - Custom Name UpgradeJar Bash script URI https://hdinsighttoolingstorage.blob.core.windows.net/shsscriptactions/upgrade_spark_enhancement.shNode type(s) Head, Worker Parameters https://${account_name}.blob.core.windows.net/packages/jars/spark-enhancement-${version}.jar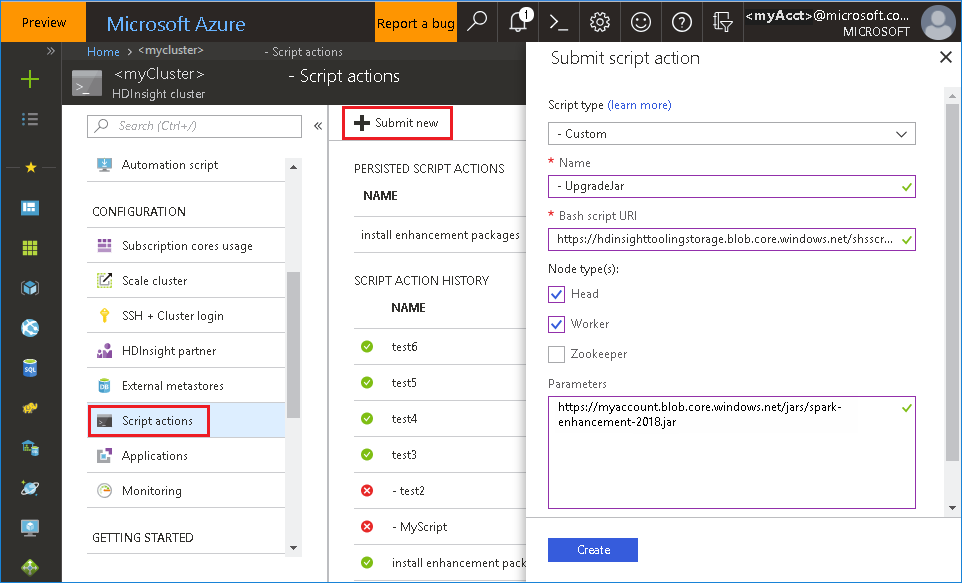
Known issues
Currently, the Spark History Server only works for Spark 2.3 and 2.4.
Input and output data that use RDD won't display in the Data tab.
Next steps
Suggestions
If you have any feedback or come across any issues when using this tool, send an email to (hdivstool@microsoft.com).
Feedback
Coming soon: Throughout 2024 we will be phasing out GitHub Issues as the feedback mechanism for content and replacing it with a new feedback system. For more information see: https://aka.ms/ContentUserFeedback.
Submit and view feedback for