Tutorial: Export data from Azure IoT Central and visualize insights in Power BI
In the two previous tutorials, you created and customized an IoT Central application using the In-store analytics - checkout application template. In this tutorial, you configure your IoT Central application to export telemetry collected from the devices. You then use Power BI to create a custom dashboard for the store manager to visualize the insights derived from the telemetry.
In this tutorial, you learn how to:
- Configure an IoT Central application to export telemetry to an event hub.
- Use Logic Apps to send data from an event hub to a Power BI streaming dataset.
- Create a Power BI dashboard to visualize data in the streaming dataset.
Prerequisites
To complete this tutorial, you need:
- To complete the previous two tutorials, Create an in-store analytics application in Azure IoT Central and Customize the dashboard and manage devices in Azure IoT Central.
- A Power BI account. If you don't have a Power BI account, sign up for a free Power BI Pro trial before you begin.
Create a resource group
Before you create your event hub and logic app, you need to create a resource group to manage them. The resource group should be in the same location as your In-store analytics - checkout IoT Central application. To create a resource group:
- Sign in to the Azure portal.
- In the left navigation, select Resource groups. Then select Add.
- For Subscription, select the name of the Azure subscription you used to create your IoT Central application.
- For the Resource group name, enter retail-store-analysis.
- For the Region, select the same region you chose for the IoT Central application.
- Select Review + Create.
- On the Review + Create page, select Create.
You now have a resource group called retail-store-analysis in your subscription.
Create an event hub
Before you can configure the retail monitoring application to export telemetry, you need to create an event hub to receive the exported data. The following steps show you how to create your event hub:
- In the Azure portal, select Create a resource at the top left of the screen.
- In Search the Marketplace, enter Event Hubs, and then press Enter.
- On the Event Hubs page, select Create.
- On the Create Namespace page, take the following steps:
- Enter a unique name for the namespace such as yourname-retail-store-analysis. The system checks to see if this name is available.
- Choose the Basic pricing tier.
- Select the same Subscription you used to create your IoT Central application.
- Select the retail-store-analysis resource group.
- Select the same location you used for your IoT Central application.
- Select Create. You may have to wait a few minutes for the system to provision the resources.
- In the portal, navigate to the retail-store-analysis resource group. Wait for the deployment to complete. You may need to select Refresh to update the deployment status. You can also check the status of the event hub namespace creation in the Notifications.
- In the retail-store-analysis resource group, select the Event Hubs Namespace. You see the home page for your Event Hubs Namespace in the portal.
You need a connection string with send permissions to connect from IoT Central. To create a connection string:
- In your Event Hubs namespace in the Azure portal, select Shared access policies. The list of policies includes the default RootManageSharedAccessKey policy.
- Select + Add.
- Enter SendPolicy as the policy name, select Send, and then select Create.
- Select SendPolicy in the list of policies.
- Make a note of the Connection string-primary key value. You use it when you configure the export destination in IoT Central.
You need a connection string with manage and listen permissions to connect to the event hub from your logic app. To retrieve a connection string:
- In your Event Hubs namespace in the Azure portal, select Shared access policies. The list of policies includes the default RootManageSharedAccessKey policy.
- Select RootManageSharedAccessKey in the list of policies.
- Make a note of the Connection string-primary key value. You use it when you configure the logic app to fetch telemetry from your event hub.
Now you have an Event Hubs Namespace, you can create an event hub to use with your IoT Central application:
- On the home page for your Event Hubs Namespace in the portal, select + Event Hub.
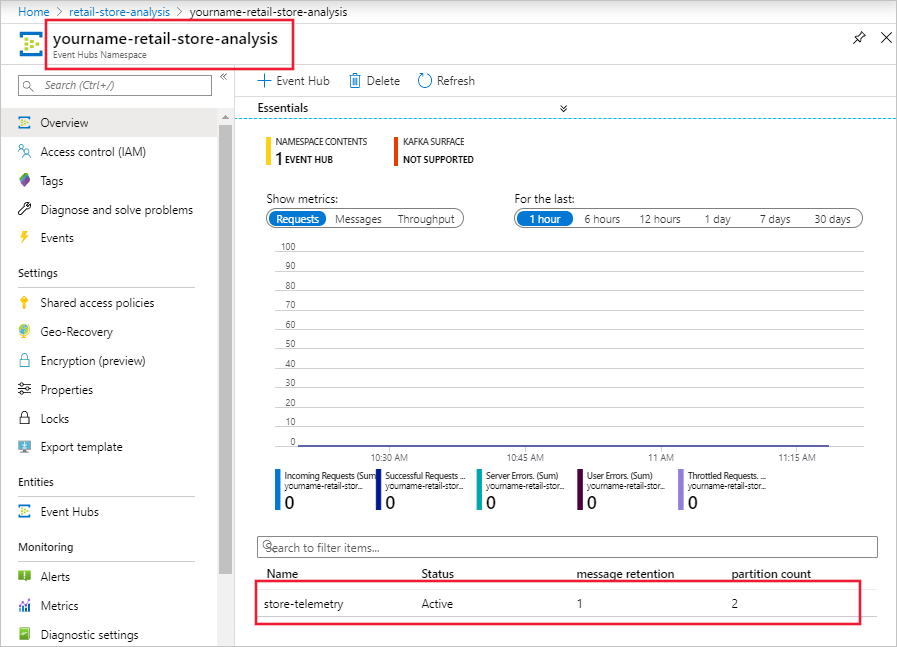
- On the Create Event Hub page, enter store-telemetry as the name, and then select Create.
You now have an event hub you can use when you configure data export from your IoT Central application:
Configure data export
Now you have an event hub, you can configure your In-store analytics - checkout application to export telemetry from the connected devices. The following steps show you how to configure the export:
- Sign in to your In-store analytics - checkout IoT Central application.
- Select Data export in the left pane.
- Select + New export.
- Enter Telemetry export as the export name.
- Select Telemetry as type of data to export.
- In the Destinations section, select create a new one.
- Enter Store data event hub as the Destination name.
- Select Azure Event Hubs as the destination type.
- Select Connection string as the authorization type.
- Paste in the connection string for the SendPolicy you saved when you create the event hub.
- Enter store-telemetry as the Event Hub.
- Select Create and then Save.
- On the Telemetry export page, wait for the export status to change to Healthy.
The data export may take a few minutes to start sending telemetry to your event hub. You can see the status of the export on the Data exports page.
Create the Power BI datasets
Your Power BI dashboard displays data from your retail monitoring application. In this solution, you use Power BI streaming datasets as the data source for the Power BI dashboard. In this section, you define the schema of the streaming datasets so that the logic app can forward data from the event hub. The following steps show you how to create two streaming datasets for the environmental sensors and one streaming dataset for the occupancy sensor:
Sign in to your Power BI account.
Select Workspaces, and then select Create a workspace.
On the Create a workspace page, enter In-store analytics - checkout as the Workspace name. Select Save.
On the workspace page, select + New > Streaming dataset.
On the New streaming dataset page, choose API, and then select Next.
Enter Zone 1 sensor as the Dataset name.
Enter the three Values from stream in following table:
Value name Value type Timestamp DateTime Humidity Number Temperature Number Switch Historic data analysis on.
Select Create and then Done.
Create another streaming dataset called Zone 2 sensor with the same schema and settings as the Zone 1 sensor streaming dataset.
You now have two streaming datasets. The logic app routes telemetry from the two environmental sensors connected to your In-store analytics - checkout application to these two datasets:
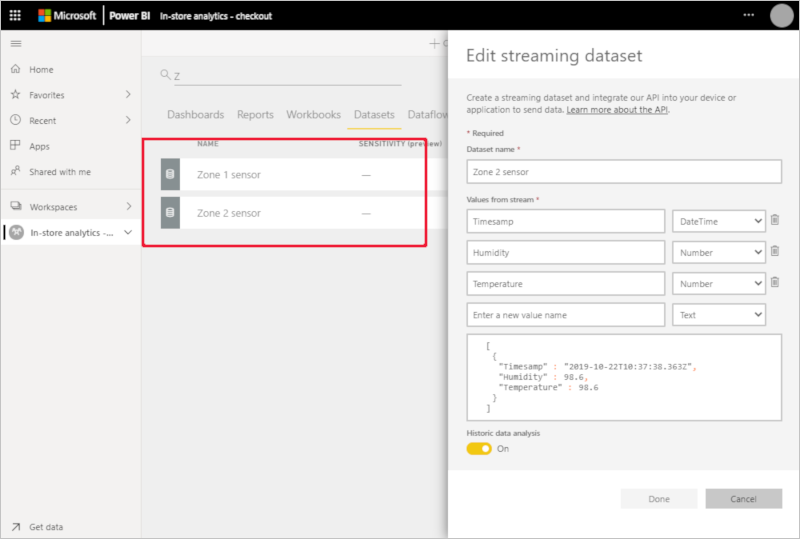
This solution uses one streaming dataset for each sensor because it's not possible to apply filters to streaming data in Power BI.
You also need a streaming dataset for the occupancy telemetry:
On the workspace page, select Create > Streaming dataset.
On the New streaming dataset page, choose API, and then select Next.
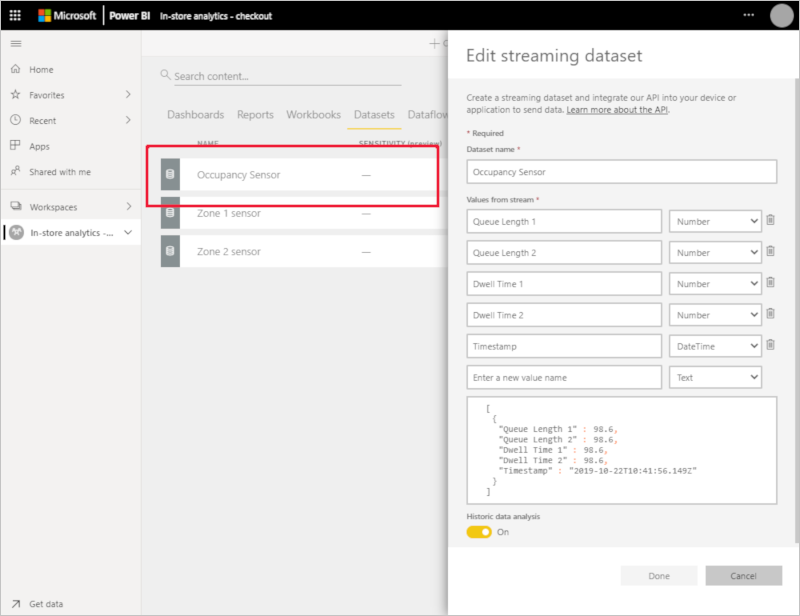
Enter Occupancy sensor as the Dataset name.
Enter the five Values from stream in following table:
Value name Value type Timestamp DateTime Queue Length 1 Number Queue Length 2 Number Dwell Time 1 Number Dwell Time 2 Number Switch Historic data analysis on.
Select Create and then Done.
You now have a third streaming dataset that stores values from the simulated occupancy sensor. This sensor reports the queue length at the two checkouts in the store, and how long customers are waiting in these queues:
Create a logic app
In this solution, the logic app reads telemetry from the event hub, parses the data, and then sends it to the Power BI streaming datasets you created.
Before you create the logic app, you need the device IDs of the two RuuviTag sensors you connected to your IoT Central application in the Create an in-store analytics application in Azure IoT Central tutorial:
- Sign in to your In-store analytics - checkout IoT Central application.
- Select Devices in the left pane. Then select RuuviTag.
- Make a note of the Device IDs. In the following screenshot, the IDs are 8r6vfyiv1x and 1rvfk4ymk6z:

The following steps show you how to create the logic app in the Azure portal:
- Sign in to the Azure portal and select Create a resource at the top left of the screen.
- In Search the Marketplace, enter Logic App, and then press Enter.
- On the Logic App page, select Create.
- On the Create page:
- Enter a unique name for your logic app such as yourname-retail-store-analysis.
- Select the same Subscription you used to create your IoT Central application.
- Select the retail-store-analysis resource group.
- Select the Type as Consumption.
- Select the same location you used for your IoT Central application.
- Select Create. You may have to wait a few minutes for the system to provision the resources.
- In the Azure portal, navigate to your new logic app.
- On the Logic Apps Designer page, scroll down and select Blank Logic App.
- In Search connectors and triggers, enter Event Hubs.
- In Triggers, select When events are available in Event Hub.
- Enter Store telemetry as the Connection name.
- Select Access key as the authentication type.
- Paste in the event hub connection string for the RootManageSharedAccessKey policy you made a note of previously, and select Create.
- In the When events are available in Event Hub action:
- In Event Hub name, select store-telemetry.
- In Content type, select application/json.
- Set the Interval to three and the Frequency to seconds
- Select Save to save your logic app.
To add the logic to your logic app design, select Code view:
Replace
"actions": {},with the following JSON. Then replace the two placeholders[YOUR RUUVITAG DEVICE ID 1]and[YOUR RUUVITAG DEVICE ID 2]with the IDs of your two RuuviTag devices. You made a note of these IDs previously:"actions": { "Initialize_Device_ID_variable": { "inputs": { "variables": [ { "name": "DeviceID", "type": "String" } ] }, "runAfter": {}, "type": "InitializeVariable" }, "Parse_Telemetry": { "inputs": { "content": "@triggerBody()?['ContentData']", "schema": { "properties": { "deviceId": { "type": "string" }, "enqueuedTime": { "type": "string" }, "telemetry": { "properties": { "DwellTime1": { "type": "number" }, "DwellTime2": { "type": "number" }, "count1": { "type": "integer" }, "count2": { "type": "integer" }, "humidity": { "type": "number" }, "temperature": { "type": "number" } }, "type": "object" }, "templateId": { "type": "string" } }, "type": "object" } }, "runAfter": { "Initialize_Device_ID_variable": [ "Succeeded" ] }, "type": "ParseJson" }, "Set_Device_ID_variable": { "inputs": { "name": "DeviceID", "value": "@body('Parse_Telemetry')?['deviceId']" }, "runAfter": { "Parse_Telemetry": [ "Succeeded" ] }, "type": "SetVariable" }, "Switch_by_DeviceID": { "cases": { "Occupancy": { "actions": {}, "case": "Occupancy" }, "Zone 2 environment": { "actions": {}, "case": "[YOUR RUUVITAG DEVICE ID 2]" }, "Zone_1_environment": { "actions": {}, "case": "[YOUR RUUVITAG DEVICE ID 1]" } }, "default": { "actions": {} }, "expression": "@variables('DeviceID')", "runAfter": { "Set_Device_ID_variable": [ "Succeeded" ] }, "type": "Switch" } },Select Save and then select Designer to see the visual version of the logic you added:
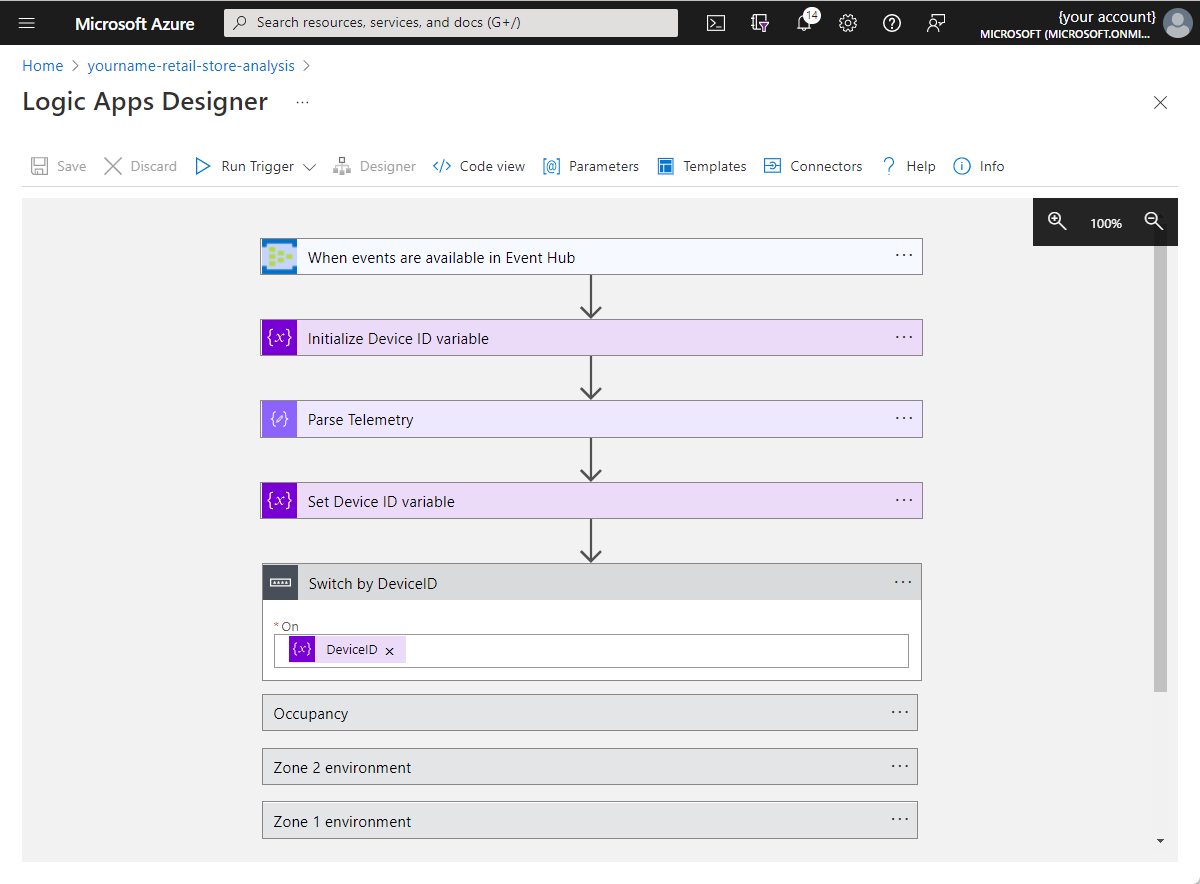
Select Switch by DeviceID to expand the action. Then select Zone 1 environment, and select Add an action.
In Search connectors and actions, enter Add rows to a dataset.
Select the Power BI Add rows to a dataset action.
Select Sign in and follow the prompts to sign in to your Power BI account.
After the sign-in process is complete, in the Add rows to a dataset action:
- Select In-store analytics - checkout as the workspace.
- Select Zone 1 sensor as the dataset.
- Select RealTimeData as the table.
- Select Add new parameter and then select the Timestamp, Humidity, and Temperature fields.
- Select the Timestamp field, and then select enqueuedTime from the Dynamic content list.
- Select the Humidity field, and then select See more next to Parse Telemetry. Then select humidity.
- Select the Temperature field, and then select See more next to Parse Telemetry. Then select temperature.
Select Save to save your changes. The Zone 1 environment action looks like the following screenshot:

Select the Zone 2 environment action, and select Add an action.
In Search connectors and actions, enter Add rows to a dataset.
Select the Power BI Add rows to a dataset action.
In the Add rows to a dataset 2 action:
- Select In-store analytics - checkout as the workspace.
- Select Zone 2 sensor as the dataset.
- Select RealTimeData as the table.
- Select Add new parameter and then select the Timestamp, Humidity, and Temperature fields.
- Select the Timestamp field, and then select enqueuedTime from the Dynamic content list.
- Select the Humidity field, and then select See more next to Parse Telemetry. Then select humidity.
- Select the Temperature field, and then select See more next to Parse Telemetry. Then select temperature.
Select Save to save your changes.
Select the Occupancy action, and select Add an action.
In Search connectors and actions, enter Add rows to a dataset.
Select the Power BI Add rows to a dataset action.
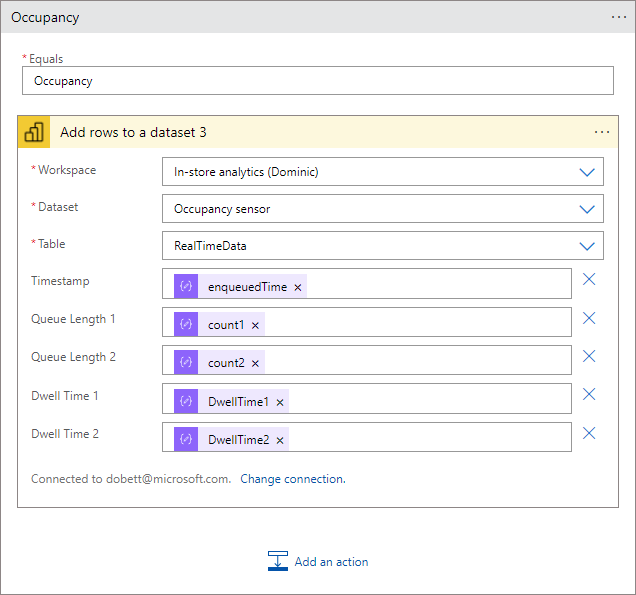
In the Add rows to a dataset 3 action:
- Select In-store analytics - checkout as the workspace.
- Select Occupancy sensor as the dataset.
- Select RealTimeData as the table.
- Select Add new parameter and then select the Timestamp, Queue Length 1, Queue Length 2, Dwell Time 1, and Dwell Time 2 fields.
- Select the Timestamp field, and then select enqueuedTime from the Dynamic content list.
- Select the Queue Length 1 field, and then select See more next to Parse Telemetry. Then select count1.
- Select the Queue Length 2 field, and then select See more next to Parse Telemetry. Then select count2.
- Select the Dwell Time 1 field, and then select See more next to Parse Telemetry. Then select DwellTime1.
- Select the Dwell Time 2 field, and then select See more next to Parse Telemetry. Then select DwellTime2.
Select Save to save your changes. The Occupancy action looks like the following screenshot:
The logic app runs automatically. To see the status of each run, navigate to the Overview page for the logic app in the Azure portal and select Runs history. Select Refresh to update the list of runs.
Create a Power BI dashboard
Now you have telemetry flowing from your IoT Central application through your event hub. Then your logic app parses the event hub messages and adds them to a Power BI streaming dataset. Now, you can create a Power BI dashboard to visualize the telemetry:
- Sign in to your Power BI account.
- Select Workspaces > In-store analytics - checkout.
- Select + New > Dashboard.
- Enter Store analytics as the dashboard name, and select Create.
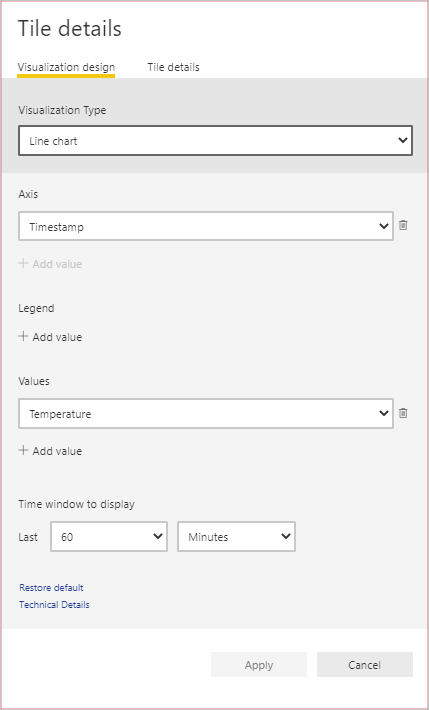
Add line charts
Add four line chart tiles to show the temperature and humidity from the two environmental sensors. Use the information in the following table to create the tiles. To add each tile, start by selecting Edit > Add a tile. Select Custom Streaming Data, and then select Next:
| Setting | Chart #1 | Chart #2 | Chart #3 | Chart #4 |
|---|---|---|---|---|
| Dataset | Zone 1 sensor | Zone 1 sensor | Zone 2 sensor | Zone 2 sensor |
| Visualization type | Line chart | Line chart | Line chart | Line chart |
| Axis | Timestamp | Timestamp | Timestamp | Timestamp |
| Values | Temperature | Humidity | Temperature | Humidity |
| Time window | 60 minutes | 60 minutes | 60 minutes | 60 minutes |
| Title | Temperature (1 hour) | Humidity (1 hour) | Temperature (1 hour) | Humidity (1 hour) |
| Subtitle | Zone 1 | Zone 1 | Zone 2 | Zone 2 |
The following screenshot shows the settings for the first chart:
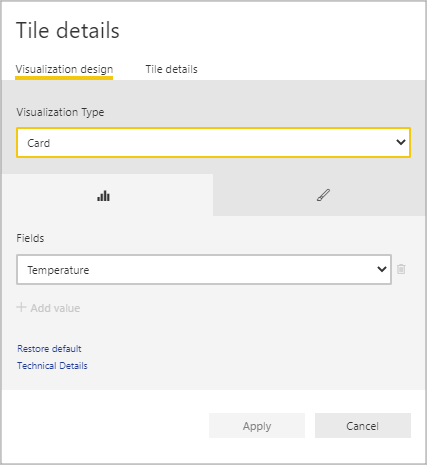
Add cards to show environmental data
Add four card tiles to show the most recent temperature and humidity values from the two environmental sensors. Use the information in the following table to create the tiles. To add each tile, start by selecting Edit > Add a tile. Select Custom Streaming Data, and then select Next:
| Setting | Card #1 | Card #2 | Card #3 | Card #4 |
|---|---|---|---|---|
| Dataset | Zone 1 sensor | Zone 1 sensor | Zone 2 sensor | Zone 2 sensor |
| Visualization type | Card | Card | Card | Card |
| Fields | Temperature | Humidity | Temperature | Humidity |
| Title | Temperature (F) | Humidity (%) | Temperature (F) | Humidity (%) |
| Subtitle | Zone 1 | Zone 1 | Zone 2 | Zone 2 |
The following screenshot shows the settings for the first card:
Add tiles to show checkout occupancy data
Add four card tiles to show the queue length and dwell time for the two checkouts in the store. Use the information in the following table to create the tiles. To add each tile, start by selecting Edit > Add a tile. Select Custom Streaming Data, and then select Next:
| Setting | Card #1 | Card #2 | Card #3 | Card #4 |
|---|---|---|---|---|
| Dataset | Occupancy sensor | Occupancy sensor | Occupancy sensor | Occupancy sensor |
| Visualization type | Clustered column chart | Clustered column chart | Gauge | Gauge |
| Axis | Timestamp | Timestamp | N/A | N/A |
| Value | Dwell Time 1 | Dwell Time 2 | Queue Length 1 | Queue Length 2 |
| Time window | 60 minutes | 60 minutes | N/A | N/A |
| Title | Dwell Time | Dwell Time | Queue Length | Queue Length |
| Subtitle | Checkout 1 | Checkout 2 | Checkout 1 | Checkout 2 |
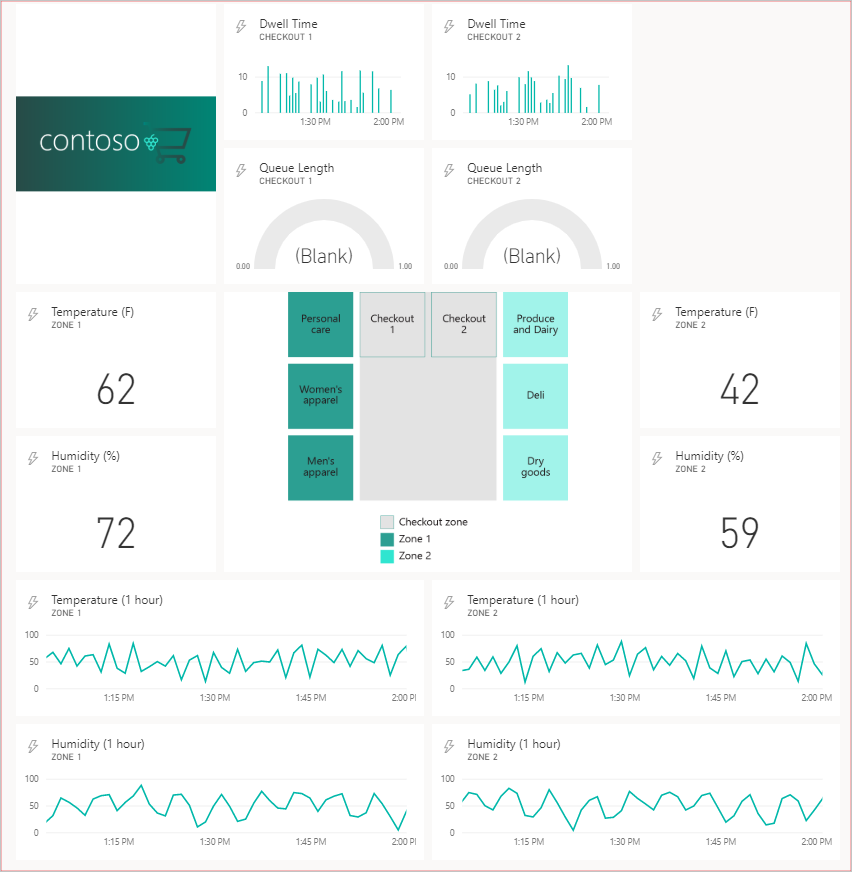
Resize and rearrange the tiles on your dashboard to look like the following screenshot:
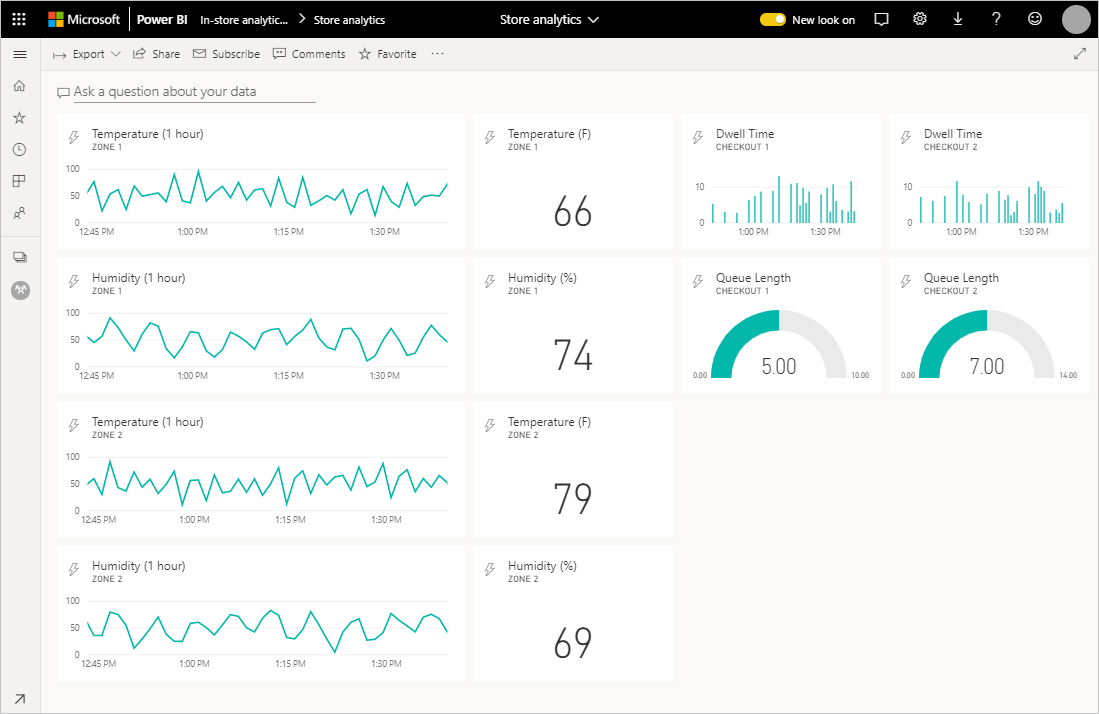
You could add some graphics resources to further customize the dashboard:
Clean up resources
If you've finished with your IoT Central application, you can delete it by signing in to the application and navigating to the Management page in the Application section.
If you want to keep the application but reduce the costs associated with it, disable the data export that's sending telemetry to your event hub.
You can delete the event hub and logic app in the Azure portal by deleting the resource group called retail-store-analysis.
You can delete your Power BI datasets and dashboard by deleting the workspace from the Power BI settings page for the workspace.
Feedback
Coming soon: Throughout 2024 we will be phasing out GitHub Issues as the feedback mechanism for content and replacing it with a new feedback system. For more information see: https://aka.ms/ContentUserFeedback.
Submit and view feedback for