Troubleshoot issues for Azure Managed Grafana
This article guides you to troubleshoot errors with Azure Managed Grafana, and suggests solutions to resolve them.
Access right alerts are displayed when creating the workspace
When creating a Managed Grafana instance from the Azure portal, the user gets an alert in the Basics tab: You might not have enough access right at below subscription or resource group to enable all features, please see next 'Permission' tab for details.
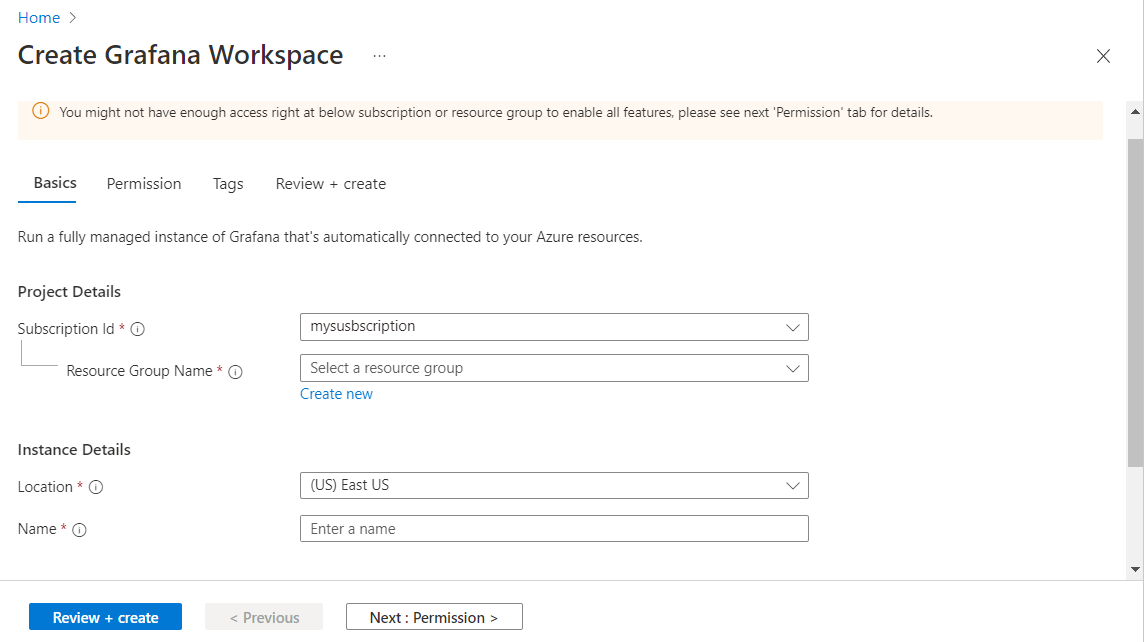
In the Permissions tab, another alert is displayed: You must be a subscription 'Owner' or 'User Access Administrator' to use this feature. Role assignment controls are disabled.
These alerts are triggered because the user isn't a subscription Administrator or Owner and the following consequences will occur when the user creates the workspace:
- The user won't get the "Grafana Admin" role for the new Grafana instance
- The system-assigned managed identity of this Grafana instance won't get the Monitoring Reader role.
Solution 1: proceed and get admin help
Proceed with the creation of the Managed Grafana workspace. You should know that you won't be able to use the Managed Grafana instance until your subscription admin assigns you a Grafana Admin, Grafana Editor or Grafana Viewer role.
Solution 2: select another subscription
The user can select another subscription in the Basics tab. They must be an admin or an owner. The banner will disappear.
Azure Managed Grafana instance creation fails
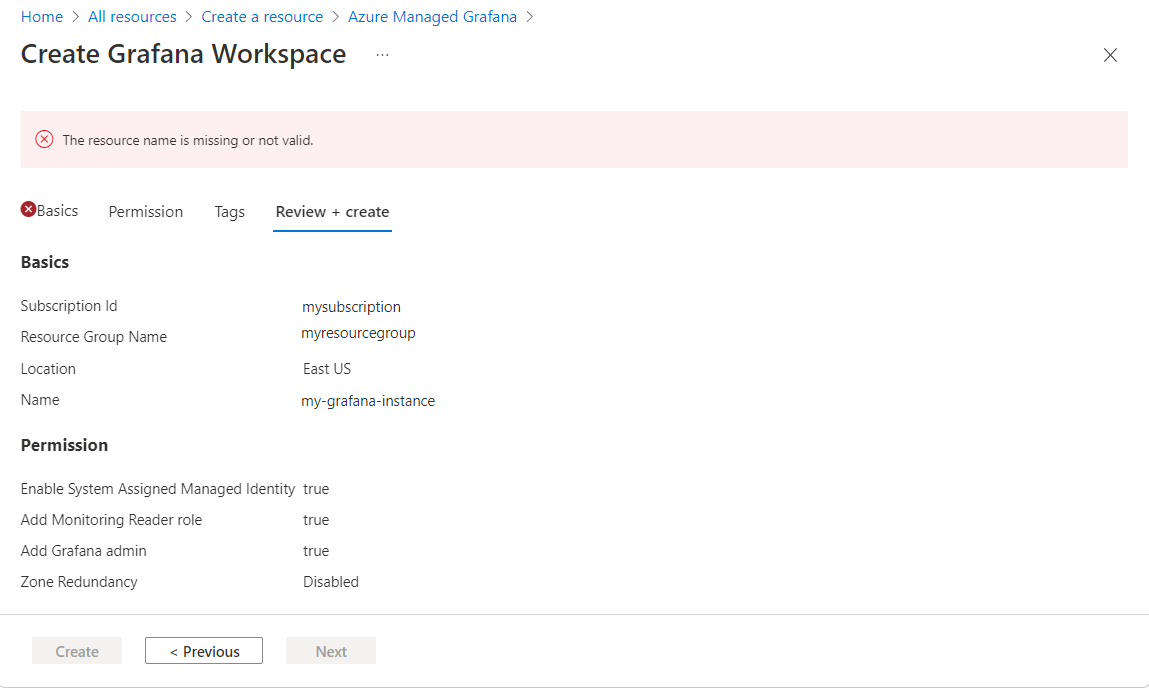
An error is displayed when the user creates a Managed Grafana instance from the Azure portal.
Solution 1: edit the instance name
If you get an error while filling out the form to create the Managed Grafana instance, you may have given an invalid name to your Grafana instance.
Enter a name that:
- Is unique in the entire Azure region. It can't already be used by another user.
- Is 23 characters long or smaller
- Begins with a letter. The rest can only be alphanumeric characters or hyphens, and the name must end with an alphanumeric character.
Solution 2: review deployment error
Review the Managed Grafana deployment details and read the status message.
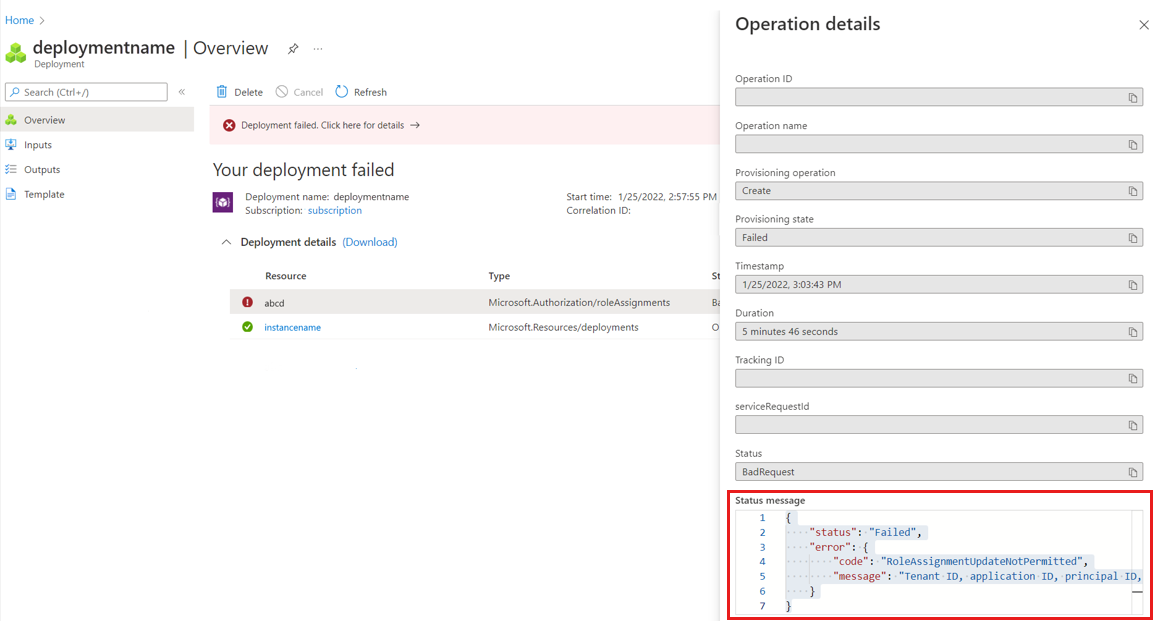
Do the following action, depending on the error message:

The status message states that the region isn't supported and provides a list of supported Azure regions. Try deploying a new Managed Grafana instance again. When trying to create a Managed Grafana instance for the first time, the Azure portal suggests Azure regions that aren't available. These regions won't be displayed on your second try.
The status message states that the role assignment update isn't permitted. The user isn't a subscription owner. If the resource deployment succeeded and the role assignment failed, ask someone with Owner or Administrator access control over your subscription to:
- Assign the Monitoring reader role at the subscription level to the managed identity of the Managed Grafana instance
- Assign you a Grafana Admin role for this new Managed Grafana instance
If status message mentions a conflict, then someone may have created another an instance with the same name at the same time, or the name check failed earlier, leading to a conflict later on. Delete this instance and create another one with a different name.
User can't access their Managed Grafana instance
The user has successfully created an Azure Managed Grafana instance but can't access their Managed Grafana instance, when going to the endpoint URL.
Solution 1: check the provisioning state
If you get a page with an error message such as "can't reach this page", stating that the page took too long to respond, follow the process below:
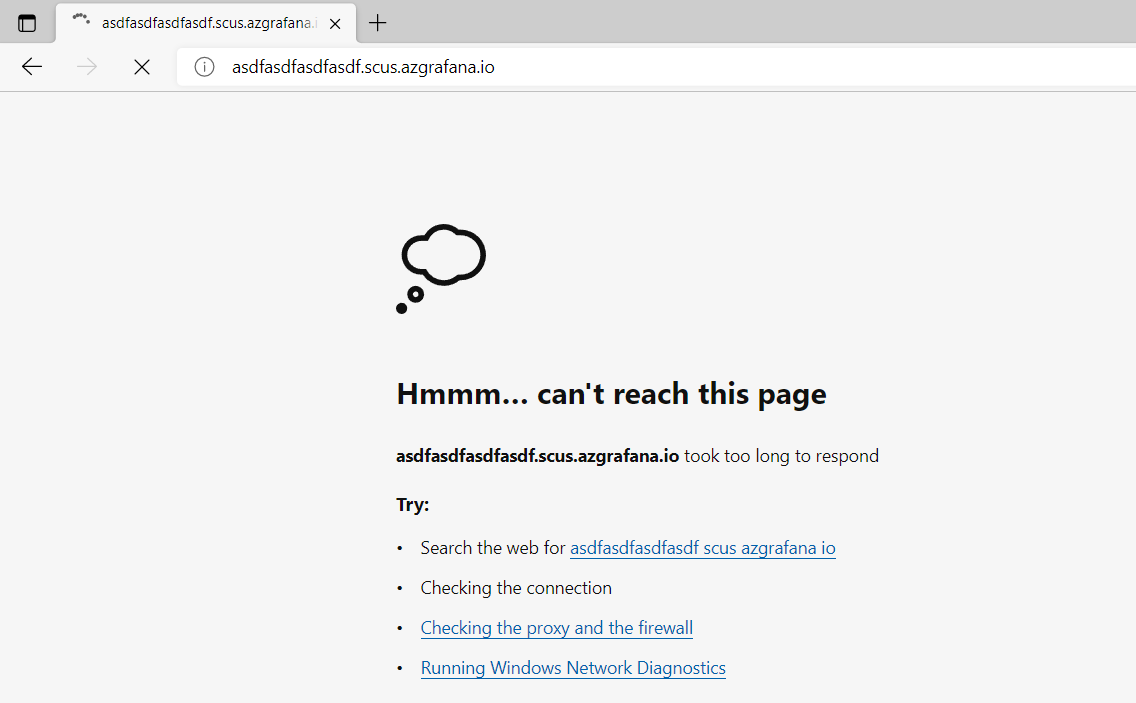
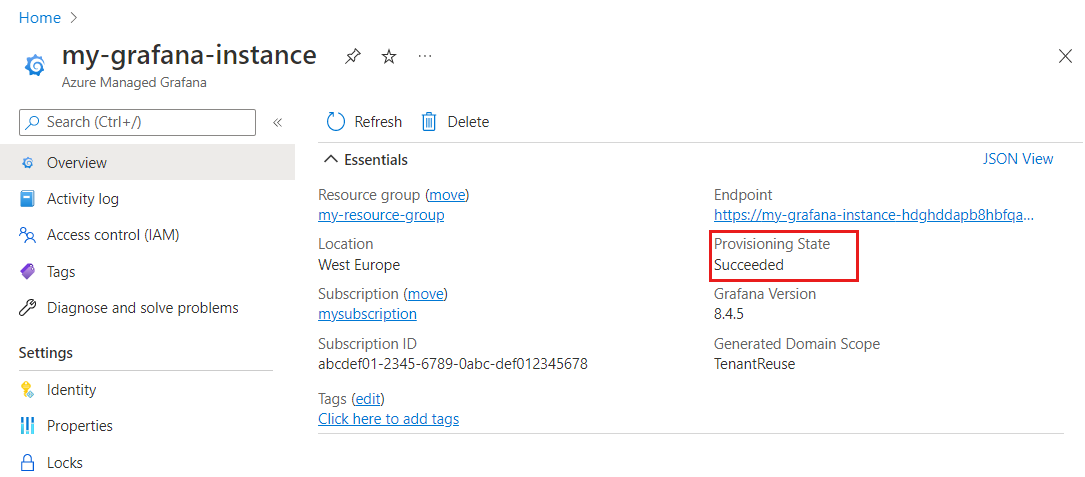
In the Azure platform, open your instance and go to the Overview page. Make sure that the Provisioning State is Succeeded and that all other fields in the Essentials section are populated. If everything seems good, continue to follow the process below. Otherwise, delete and recreate an instance.
If you saw several browser redirects and then landed on a generic browser error page as shown above, then it means there's a failure in the backend.
If you have a firewall blocking outbound traffic, allow access to your instance, to your URL ending in grafana.azure.com, and Microsoft Entra ID.
Solution 2: fix access role issues
If you get an error page stating "No Roles Assigned":
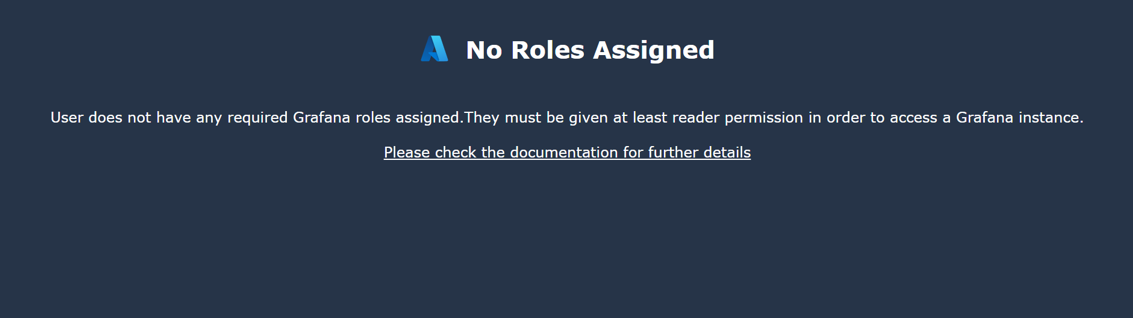
This issue can happen if:
You didn't have permission to add a Grafana Admin role for yourself. Refer to Access right alerts are displayed when creating the workspace for more information.
You used the CLI, an ARM template or other another means to create the workspace that isn't the Azure portal. Only the Azure portal will automatically add you as a Grafana Admin. In all other cases, you must manually give yourself the Grafana Admin role.
- In your Grafana workspace, select Access control (IAM) > Add role assignment to add this role assignment. You must have the Administrator or Owner access role for the subscription or Managed Grafana resource to make this role assignment. Ask your administrator to assist you if you don't have sufficient access.
- Your account is a foreign account: the Grafana instance isn't registered in your home tenant.
- If you recently addressed this problem and have been assigned a sufficient Grafana role, you may need to wait for some time before the cookie expires and get refreshed. This process normally takes 5 min. If in doubts, delete all cookies or start a private browser session to force a fresh new cookie with new role information.
Authorized users don't show up in Grafana Users configuration
After you add a user to a Managed Grafana's built-in RBAC role, such as Grafana Viewer, you don't see that user listed in the Grafana's Configuration UI page right away. This behavior is by design. Managed Grafana's RBAC roles are stored in Microsoft Entra ID. For performance reasons, Managed Grafana doesn't automatically synchronize users assigned to the built-in roles to every instance. There is no notification for changes in RBAC assignments. Querying Microsoft Entra ID periodically to get current assignments adds much extra load to the Microsoft Entra service.
There's no "fix" for this in itself. After a user signs into your Grafana instance, the user shows up in the Users tab under Grafana Configuration. You can see the corresponding role that user has been assigned to.
Azure Managed Grafana dashboard panel doesn't display any data
One or several Managed Grafana dashboard panels show no data.
Solution: review your dashboard settings
Context: Grafana dashboards are set up to fetch new data periodically. If the dashboard is refreshed too often for the underlying query to load, the panel will be stuck without ever being able to load and display data.
- Check how frequently the dashboard is configured to refresh data.
- In your dashboard, go to Dashboard settings.
- In the general settings, lower the Auto refresh rate of the dashboard to be no faster than the time the query takes to load.
- When a query takes too long to retrieve data. Grafana will automatically time out certain dependency calls that take longer than, for example, 30 seconds. Check that there are no unusual slow-downs on the query's end.
General issues with data sources
The user can't connect to a data source, or a data source cannot fetch data.
Solution: review network settings and IP address
To troubleshoot this issue:
- Check the network setting of the data source server. There should be no firewall blocking Grafana from accessing it.
- Check that the data source isn't trying to connect to a private IP address. Azure Managed Grafana doesn't currently support connections to private networks.
Azure Monitor can't fetch data
Every Grafana instance comes pre-configured with an Azure Monitor data source. When trying to use a pre-provisioned dashboard, the user finds that the Azure Monitor data source can't fetch data.
Solution: review your Azure Monitor Data settings
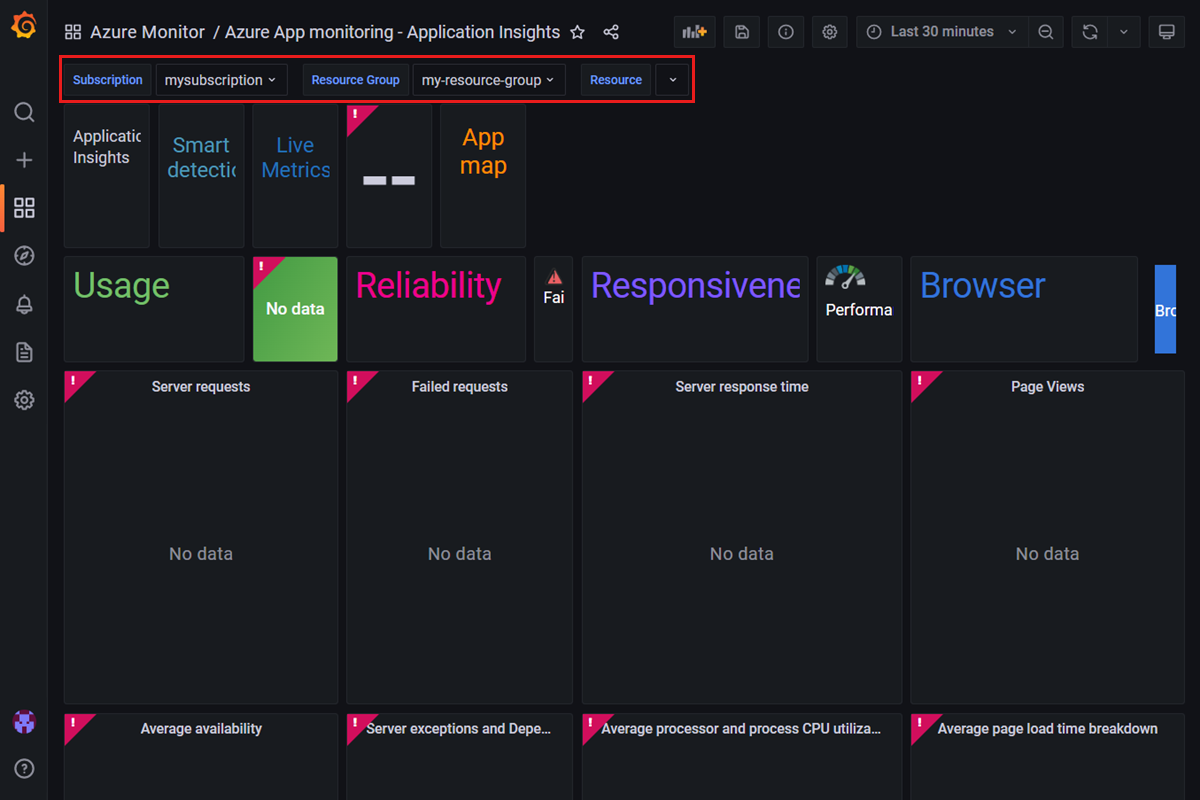
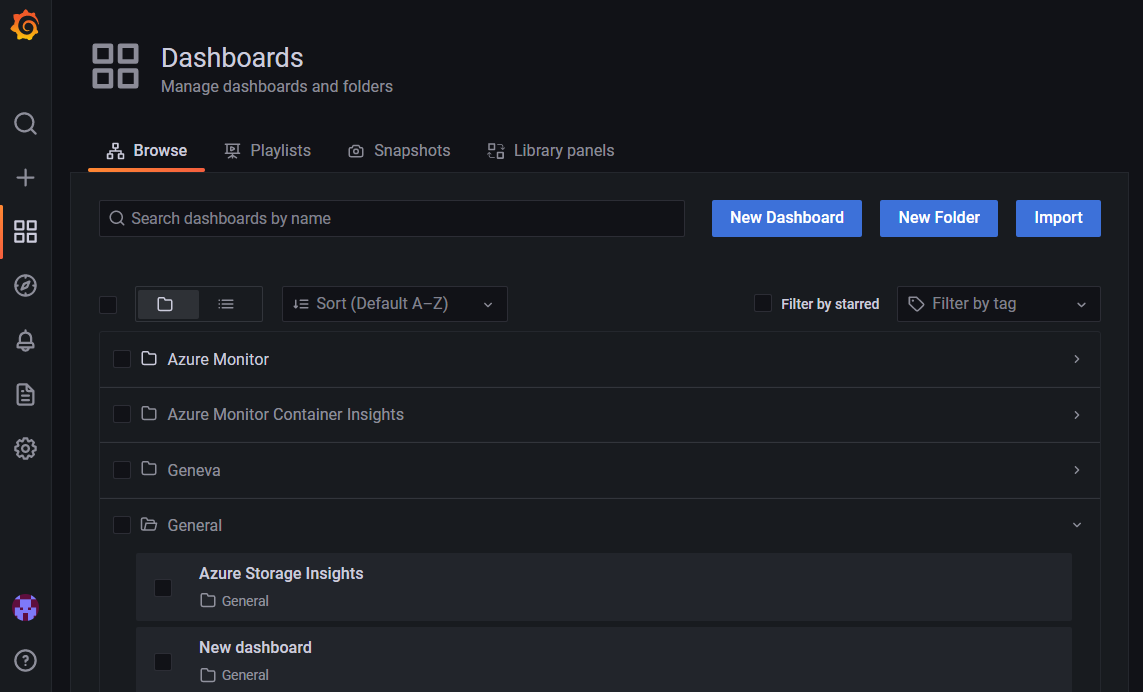
Find a pre-provisioned dashboard by opening your Managed Grafana endpoint and selecting Dashboards > Browse. Then select a dashboard, for example Azure Monitor > Azure App monitoring - Application Insights.
Make sure the dropdowns near the top are populated with a subscription, resource group and resource name. In the screenshot example below, the Resource dropdown is set to null. In this case, select a resource name. You may need to select another resource group that contains a type of resource the dashboard was designed for. In this example, you need to pick a resource group that has an Application Insights resource.
Open the Azure Monitor data source set-up page
- In your Managed Grafana endpoint, select Configurations in the left menu and select Data Sources.
- Select Azure Monitor
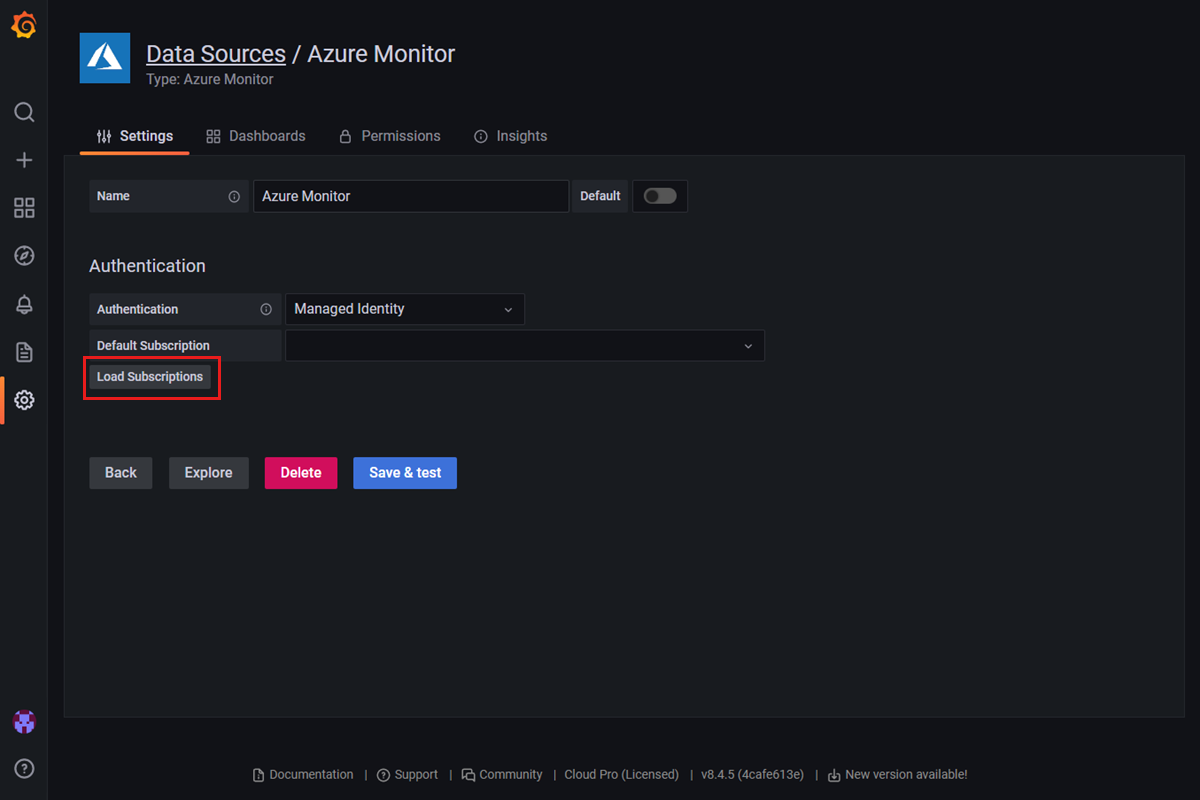
If the data source uses Managed Identity, then:
Select the Load Subscriptions button to make a quick test. If Default Subscription is populated with your subscription, Managed Grafana can access Azure Monitor within this subscription. If not, then there are permission issues.
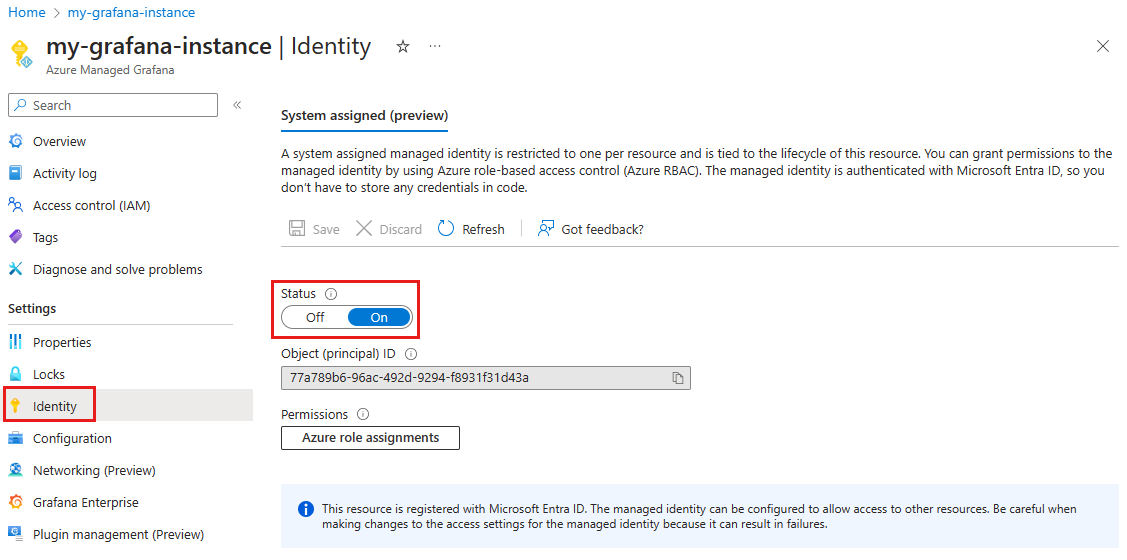
Check if the system assigned managed identity option is turned on in the Azure portal. If not, turn it on manually:
- Open your Managed Grafana instance in the Azure portal.
- In the left menu, under Settings, select Identity.
- Select Status: On and select Save
Check if the managed identity has the Monitoring Reader role assigned to the Managed Grafana instance. If not, add it manually from the Azure portal:
- Open your Managed Grafana instance in the Azure portal.
- In the left-menu, under Settings, select Identity.
- Select Azure role assignments.
- There should be a Monitoring Reader role displayed, assigned to your Managed Grafana instance. If not, select Add role assignment and add the Monitoring Reader role.

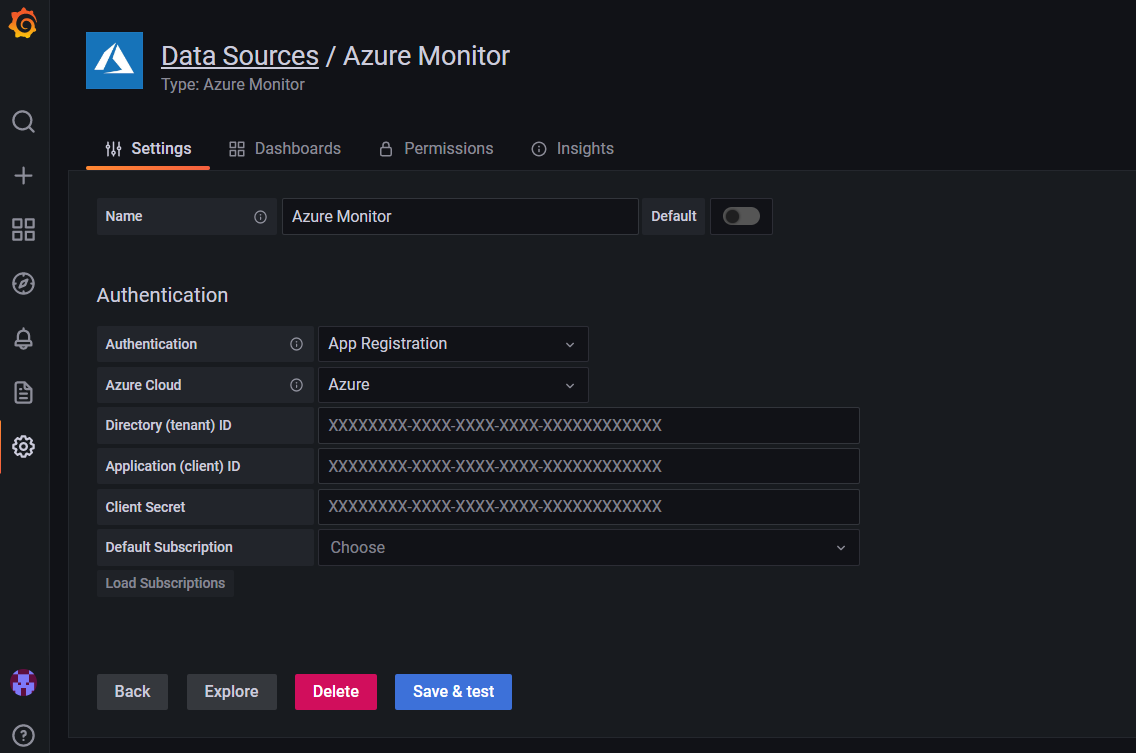
If the data source uses an App Registration authentication:
In your Grafana endpoint, go to Configurations > Data Sources > Azure Monitor and check if the information for Directory (tenant) ID and Application (client) ID is correct.
Check if the service principal has the Monitoring Reader role assigned to the Managed Grafana instance. If not, add it manually from the Azure portal.
If needed, reapply the Client Secret
Azure Data Explorer can't fetch data
The Azure Data Explorer data source can't fetch data.
Solution: review your Azure Data Explorer settings
Find a pre-provisioned dashboard by opening your Managed Grafana endpoint and selecting Dashboards > Browse. Then select a dashboard, for example Azure Monitor > Azure Data Explorer Cluster Resource Insights.
Make sure the dropdowns near the top are populated with a data source, subscription, resource group, name space, resource, and workspace name. In the screenshot example below, we chose a resource group that doesn't contain any Data Explorer cluster. In this case, select another resource group that contains a Data Explorer cluster.

Check the Azure Data Explorer data source and see how authentication is set up. You can currently only set up authentication for Azure Data Explorer through Microsoft Entra ID.
In your Grafana endpoint, go to Configurations > Data Sources > Azure Data Explorer
Check if the information listed for Azure cloud, Cluster URL, Directory (tenant) ID, Application (client) ID, and Client secret is correct. If needed, create a new key to add as a client secret.
At the top of the page, you can find instructions guiding you through the process to grant necessary permissions to this Microsoft Entra app to read the Azure Data Explorer database.
Make sure that your Azure Data Explorer instance doesn't have a firewall that blocks access to Managed Grafana. The Azure Data Explorer database needs to be exposed to the public internet.
Dashboard import fails
The user gets an error when importing a dashboard from the gallery or a JSON file. An error message appears: The dashboard has been changed by someone else.
Solution: edit dashboard name or UID
Most of the time this error occurs because the user is trying to import a dashboard that has the same name or unique identifier (UID) as another dashboard.
To check if your Managed Grafana instance already has a dashboard with the same name:
In your Grafana endpoint, select Dashboards from the navigation menu on the left and then Browse.
Review dashboard names.
Rename the old or the new dashboard.
You can also edit the UID of a JSON dashboard before importing it by editing the field named uid in the JSON file.
Nothing changes after updating the managed identity role assignment
After disabling System-Assigned Managed Identity, the data source that has been configured with Managed Identity can still access the data from Azure services.
Solution: wait for the change to take effect
Data sources configured with a managed identity may still be able to access data from Azure services for up to 24 hours. When a role assignment is updated in a managed identity for Azure Managed Grafana, this change can take up to 24 hours to be effective, due to limitations of managed identities.
Next steps
Feedback
Coming soon: Throughout 2024 we will be phasing out GitHub Issues as the feedback mechanism for content and replacing it with a new feedback system. For more information see: https://aka.ms/ContentUserFeedback.
Submit and view feedback for