Tutorial: Monitor network communication with a virtual machine scale set using the Azure portal
Caution
This article references CentOS, a Linux distribution that is nearing End Of Life (EOL) status. Please consider your use and planning accordingly. For more information, see the CentOS End Of Life guidance.
Successful communication between a virtual machine scale set and another endpoint, such as virtual machine (VM), can be critical for your organization. Sometimes, the introduction of configuration changes can break communication.
In this tutorial, you learn how to:
- Create a virtual machine scale set and a VM.
- Monitor communication between a scale set and a VM by using Connection monitor.
- Generate alerts on Connection monitor metrics.
- Diagnose a communication problem between two VMs, and learn how to resolve it.
Note
This tutorial uses Connection monitor (classic). To experience enhanced connectivity monitoring, try the updated version of Connection monitor.
Important
As of July 1, 2021, you can't add new connection monitors in Connection monitor (classic) but you can continue to use earlier versions that were created prior to that date. To minimize service disruption to your current workloads, migrate from Connection monitor (classic) to the latest Connection monitor in Azure Network Watcher before February 29, 2024.
If you don't have an Azure subscription, create a free account before you begin.
Prerequisites
- An Azure subscription
Sign in to Azure
Sign in to the Azure portal.
Create a virtual machine scale set
In the following sections, you create a virtual machine scale set.
Create a load balancer
Azure Load Balancer distributes incoming traffic among healthy virtual machine instances.
First, create a public standard load balancer using the Azure portal. The name and public IP address you create are automatically configured as the load balancer's front end.
In the search box, enter load balancer and then, under Marketplace in the search results, select Load balancer.
On the Basics pane of the Create load balancer page, do the following:
Setting Value Subscription Select your subscription. Resource group Select Create new and then, in the box, type myVMSSResourceGroup. Name Enter myLoadBalancer. Region Select East US. Type Select Public. SKU Select Standard. Public IP address Select Create new. Public IP address name Enter myPip. Assignment Select Static. Availability zone Select Zone-redundant. Select Review + create.
After it passes validation, select Create.
Create a virtual machine scale set
You can deploy a scale set with a Windows Server image or Linux images such as RHEL, CentOS, Ubuntu, or SLES.
Type Scale set in the search box. In the results, under Marketplace, select Virtual machine scale sets.
On the Virtual machine scale sets pane, select Create. The Create a virtual machine scale set page opens.
On the Basics pane, under Project details, ensure that the correct subscription is selected, and then select myVMSSResourceGroup in the resource group list.
For Name, type myScaleSet.
For Region, select a region that's close to your area.
Under Orchestration, for Orchestration mode, ensure that the Uniform option is selected.
For Image, select a marketplace image. In this example, we've chosen Ubuntu Server 18.04 LTS.
Enter your username, and then select the authentication type you prefer.
- A Password must be at least 12 characters long and contain three of the following: a lowercase character, an uppercase character, a number, and a special character. For more information, see username and password requirements.
- If you select a Linux OS disk image, you can instead choose SSH public key. Provide only your public key, such as ~/.ssh/id_rsa.pub. You can use the Azure Cloud Shell from the portal to create and use SSH keys.
Select Next.
Leave the defaults for the Instance and Disks pages.
On the Networking page, under Load balancing, select Yes to put the scale set instances behind a load balancer.
For Load balancing options, select Azure load balancer.
For Select a load balancer, select myLoadBalancer, which you created earlier.
For Select a backend pool, select Create new, type myBackendPool, and then select Create.
When you're done, select Review + create.
After it passes validation, select Create to deploy the scale set.
After the scale set has been created, enable the Network Watcher extension in the scale set by doing the following:
Under Settings, select Extensions.
Select Add extension, and then select Network Watcher Agent for Windows.
Under Network Watcher Agent for Windows, select Create.
Under Install extension, select OK.
Under Extensions, select OK.
Create the VM
Complete the steps in the "Create the first virtual machine" section of Tutorial: Monitor network communication between two virtual machines by using the Azure portal, but with the following changes:
| Step | Setting | Value |
|---|---|---|
| 1 | Select a version of Ubuntu Server. | |
| 3 | Name | Enter myVm2. |
| 3 | Authentication type | Paste your SSH public key or select Password, and then enter a password. |
| 3 | Resource group | Select Use existing, and then select myResourceGroup. |
| 6 | Extensions | Select Network Watcher Agent for Linux. |
The VM takes a few minutes to deploy. Wait for it to finish deploying before you continue with the remaining steps.
Create a connection monitor
To create a monitor in Connection monitor by using the Azure portal:
On the Azure portal home page, go to Network Watcher.
On the left pane, in the Monitoring section, select Connection monitor.
You'll see a list of the connection monitors that were created in Connection monitor. To see the connection monitors that were created in the classic Connection monitor, select the Connection monitor tab.

On the Connection monitor dashboard, at the upper left, select Create.
On the Basics pane, enter information for your connection monitor:
a. Connection Monitor Name: Enter a name for your connection monitor. Use the standard naming rules for Azure resources.
b. Subscription: Select a subscription for your connection monitor.
c. Region: Select a region for your connection monitor. You can select only the source VMs that are created in this region.
d. Workspace configuration: Your workspace holds your monitoring data. Do either of the following:- To use the default workspace, select the checkbox.
- To choose a custom workspace, clear the checkbox, and then select the subscription and region for your custom workspace.
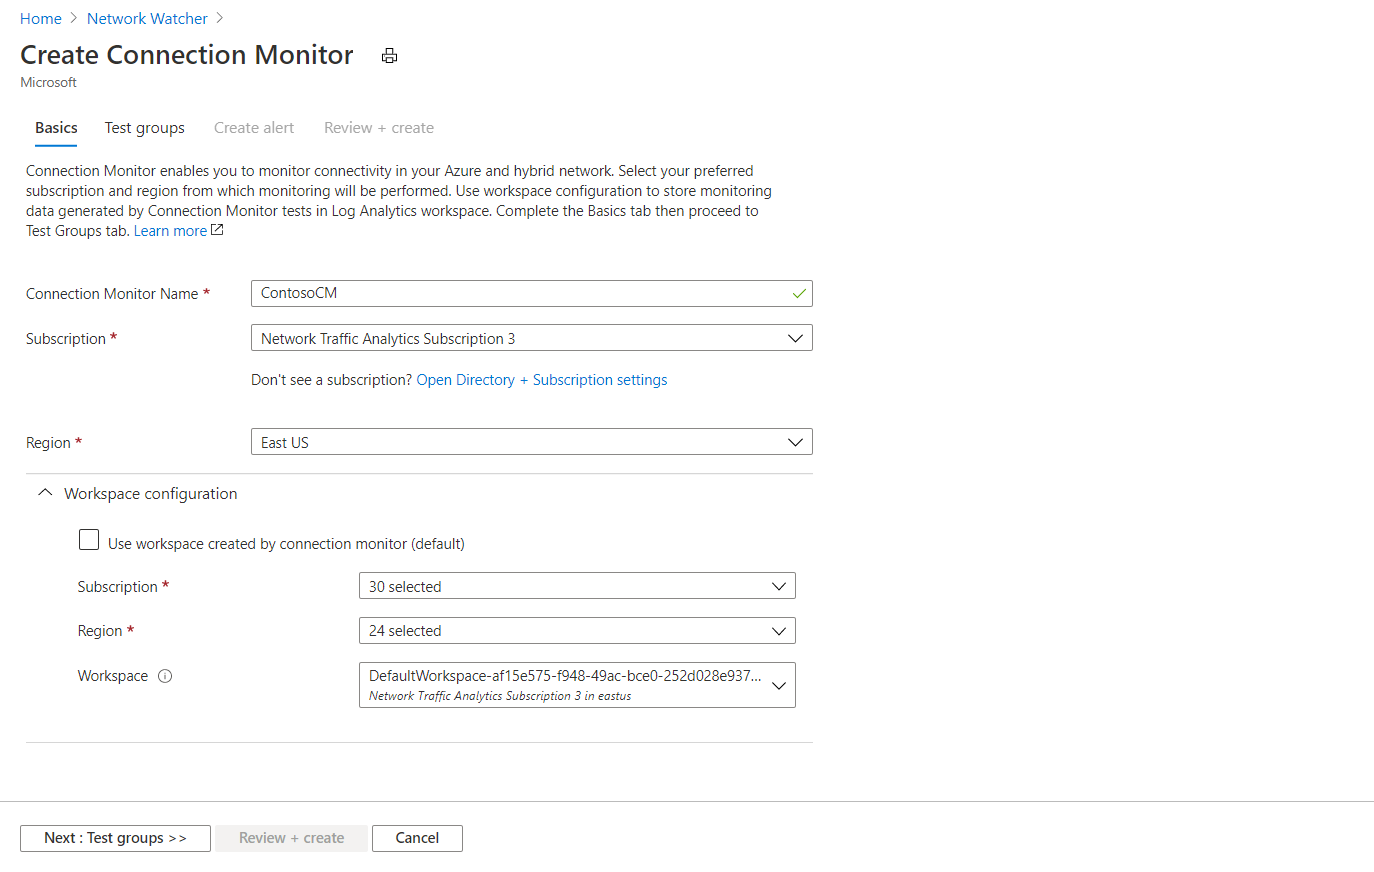
Select Next: Test groups.
Add sources, destinations, and test configurations in your test groups. To learn about setting up test groups, see Create test groups in Connection monitor.
At the bottom of the pane, select Next: Create Alerts. To learn about creating alerts, see Create alerts in Connection monitor.
At the bottom of the pane, select Next: Review + create.
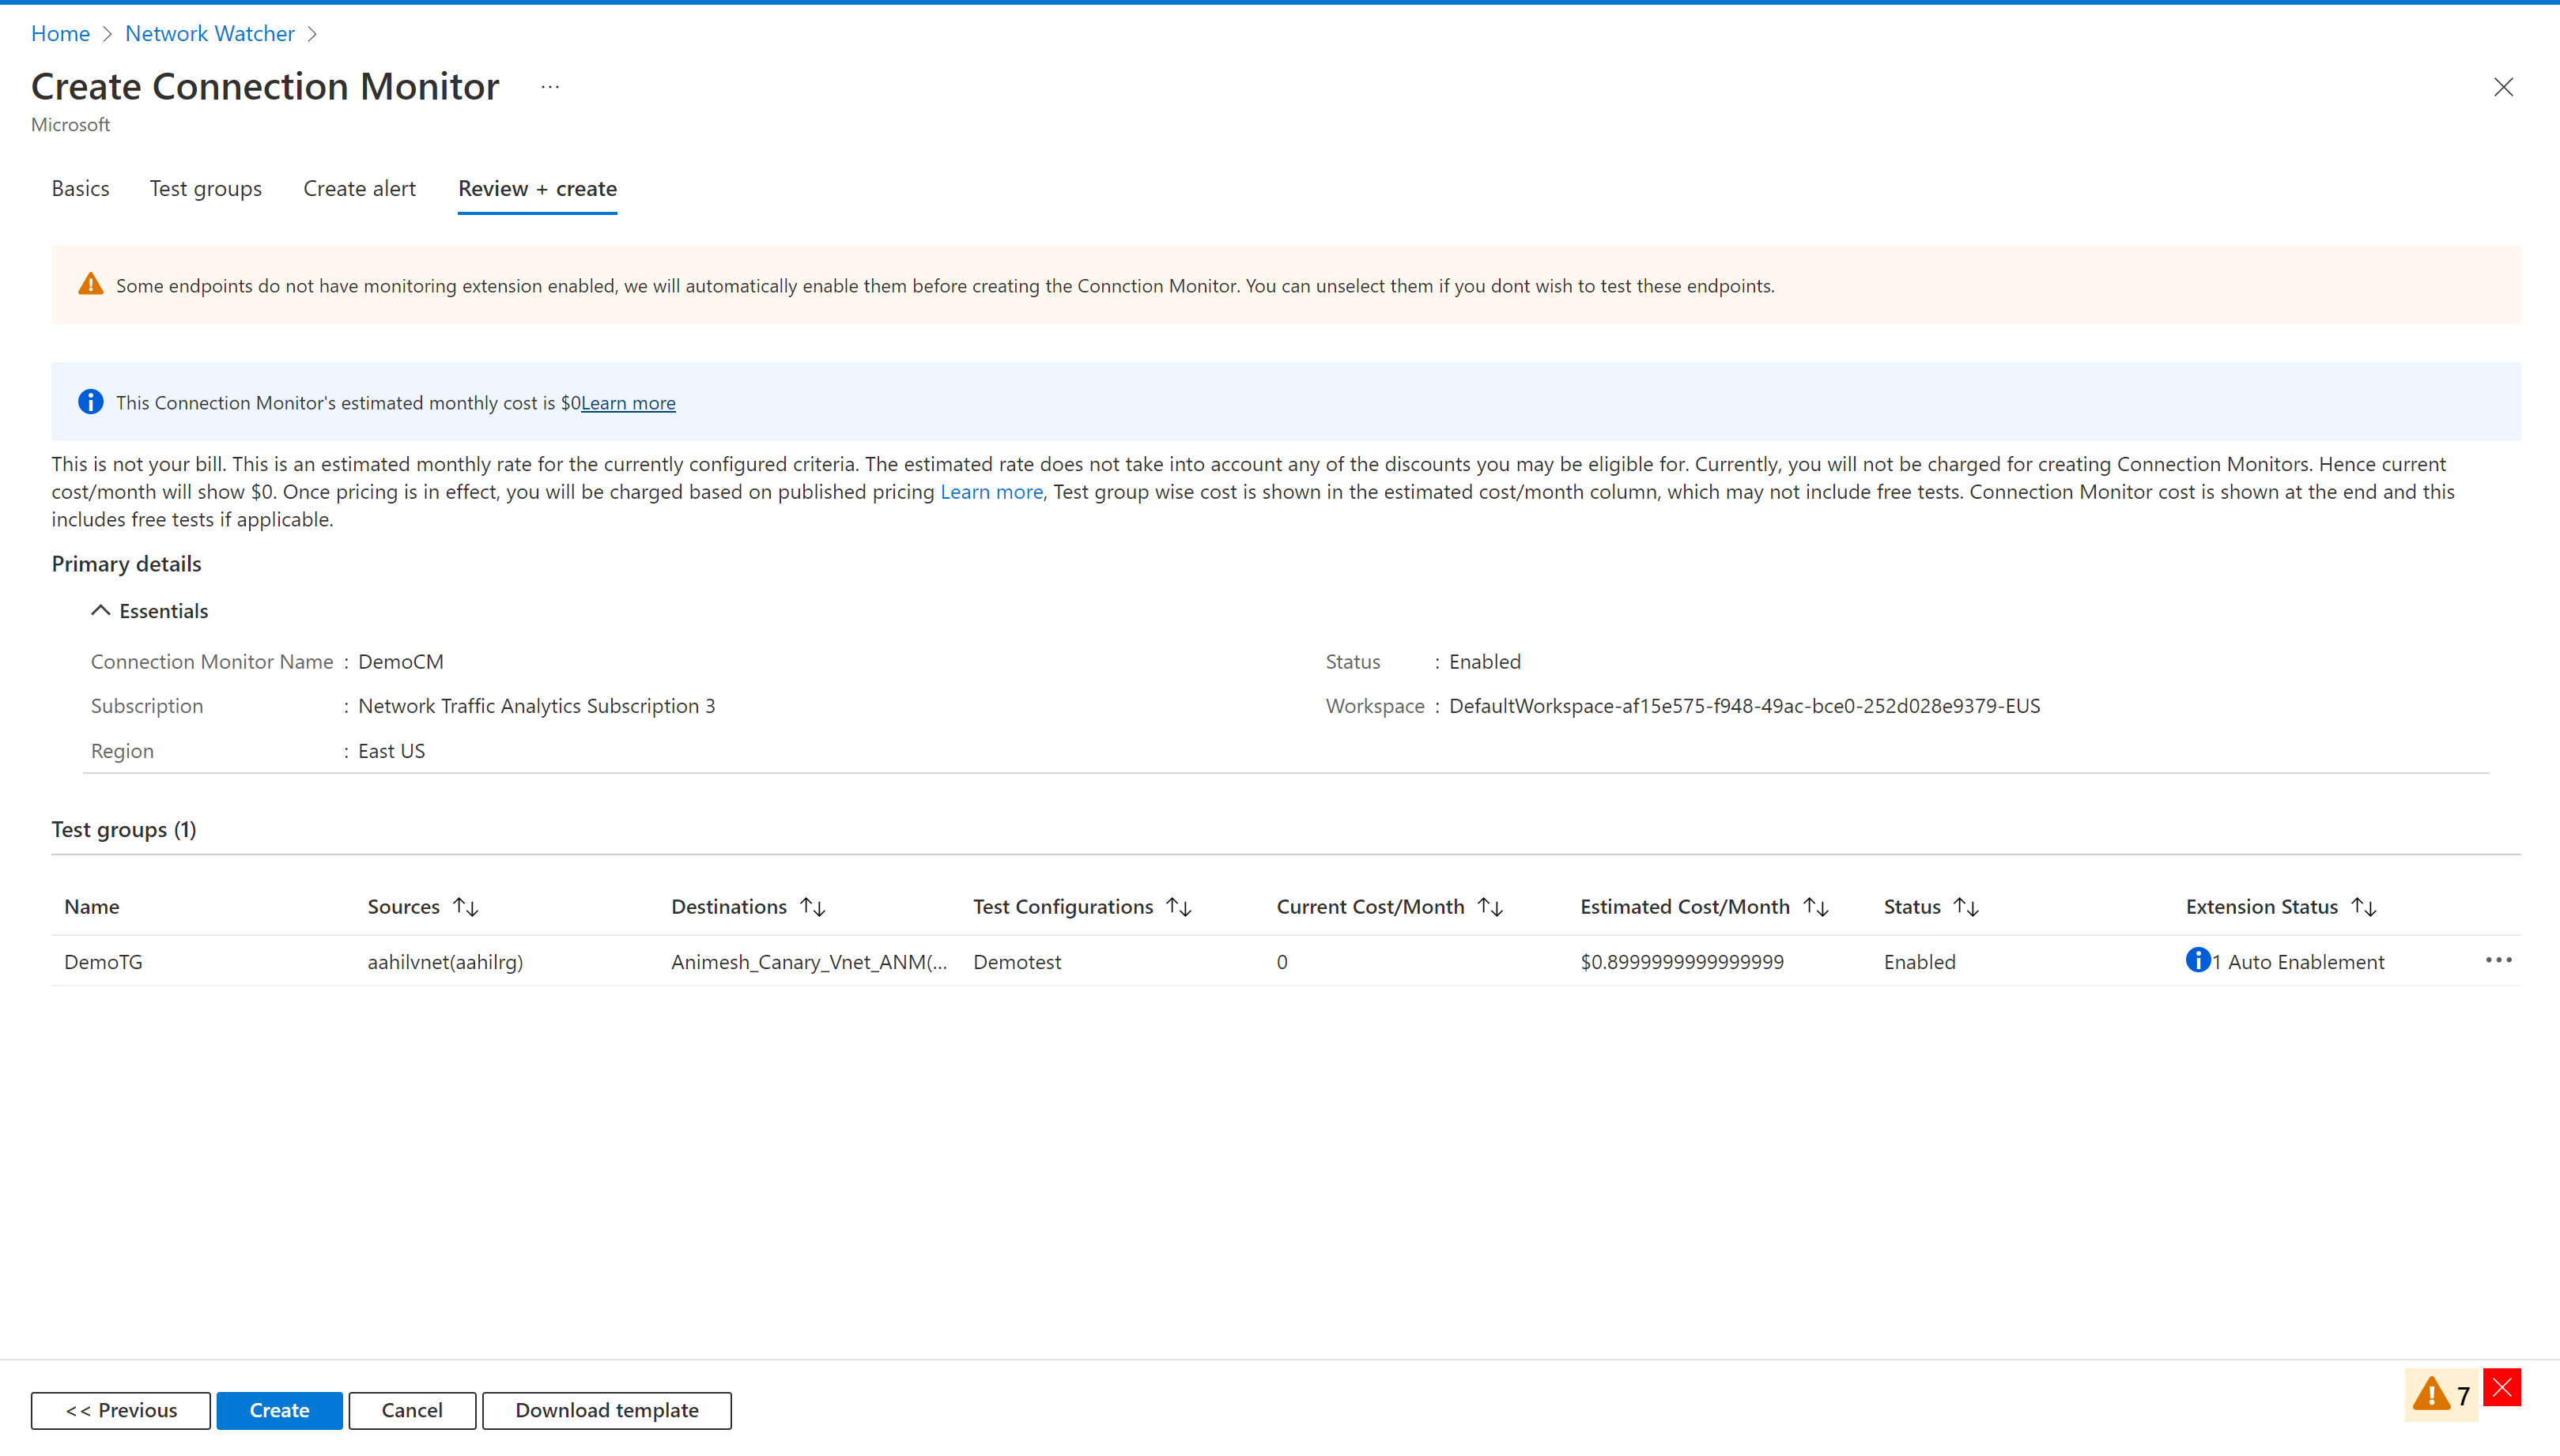
On the Review + create pane, review the basic information and test groups before you create the connection monitor. If you need to edit the connection monitor, you can do so by going back to the respective panes.

Note
The Review + create pane shows the cost per month during the Connection monitor stage. Currently, the Current Cost/Month column shows no charge. When Connection monitor becomes generally available, this column will show a monthly charge.
Even during the Connection monitor stage, Log Analytics ingestion charges apply.
When you're ready to create the connection monitor, at the bottom of the Review + create pane, select Create.
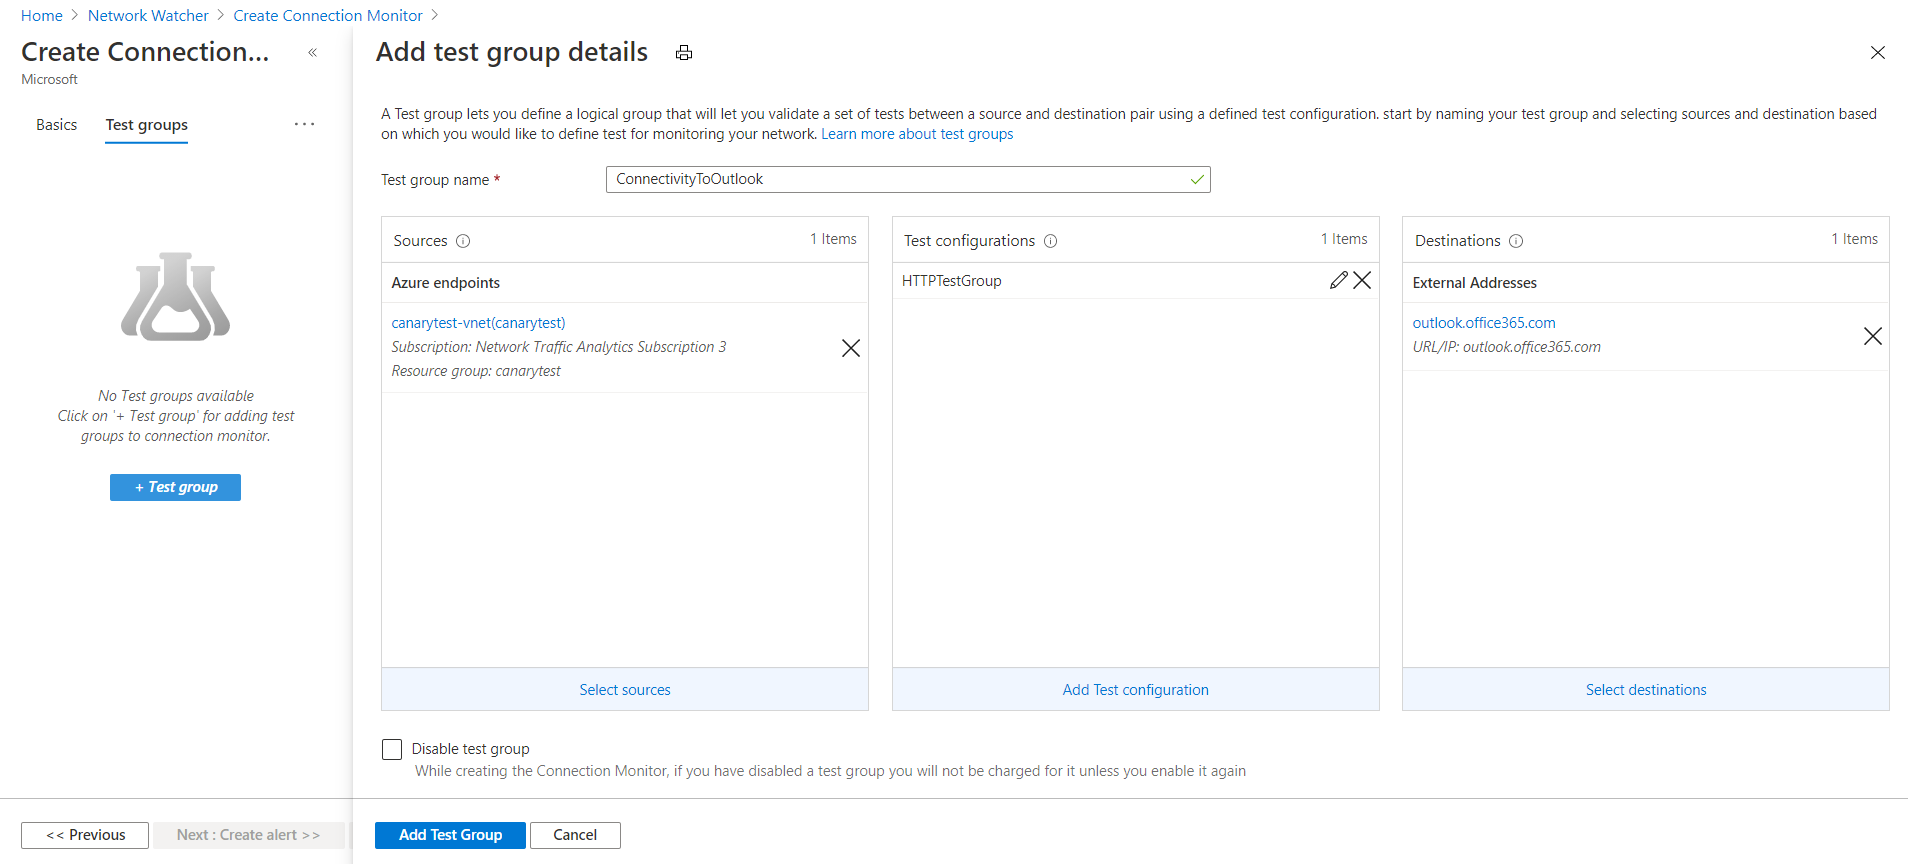
Create test groups in a connection monitor
Note
Connection monitor now supports the auto-enabling of monitoring extensions for Azure and non-Azure endpoints, thus eliminating the need for manual installation of monitoring solutions during the creation of Connection monitor.
Each test group in a connection monitor includes sources and destinations that get tested on network parameters. They're tested for the percentage of checks that fail and the RTT over test configurations.
In the Azure portal, to create a test group in a connection monitor, do the following:
Disable test group: You can select this checkbox to disable monitoring for all sources and destinations that the test group specifies. This selection is cleared by default.
Name: Name your test group.
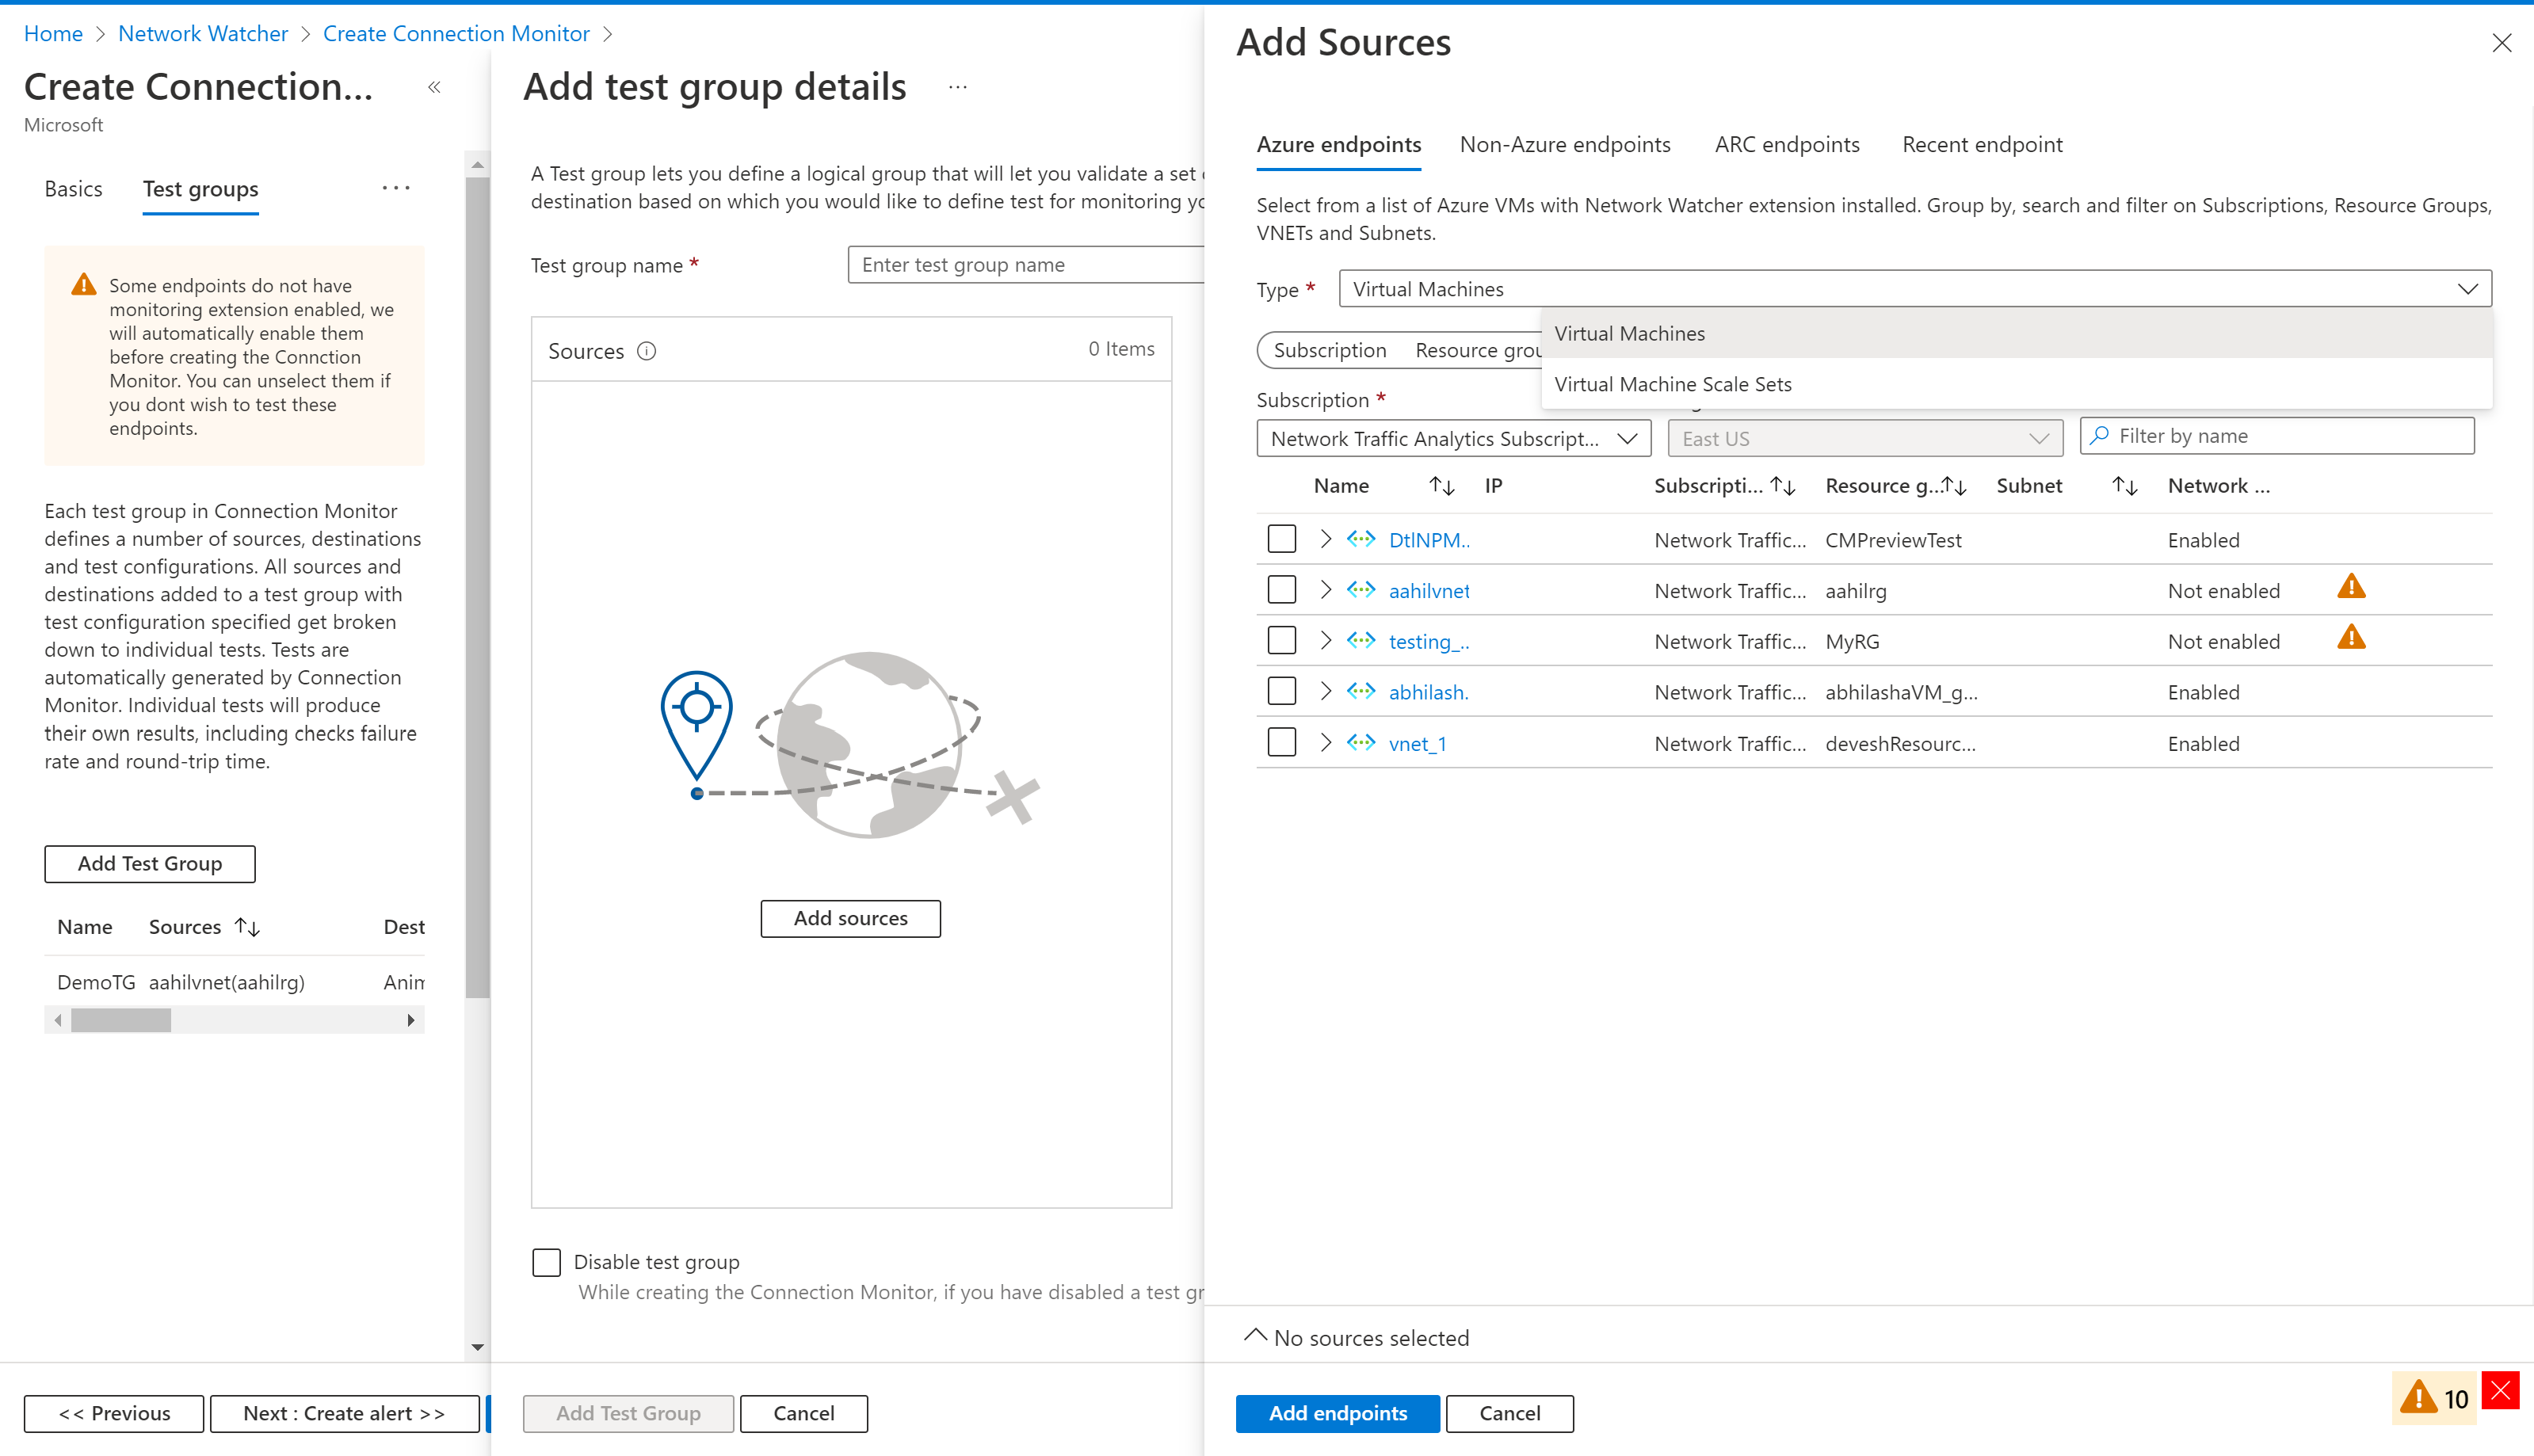
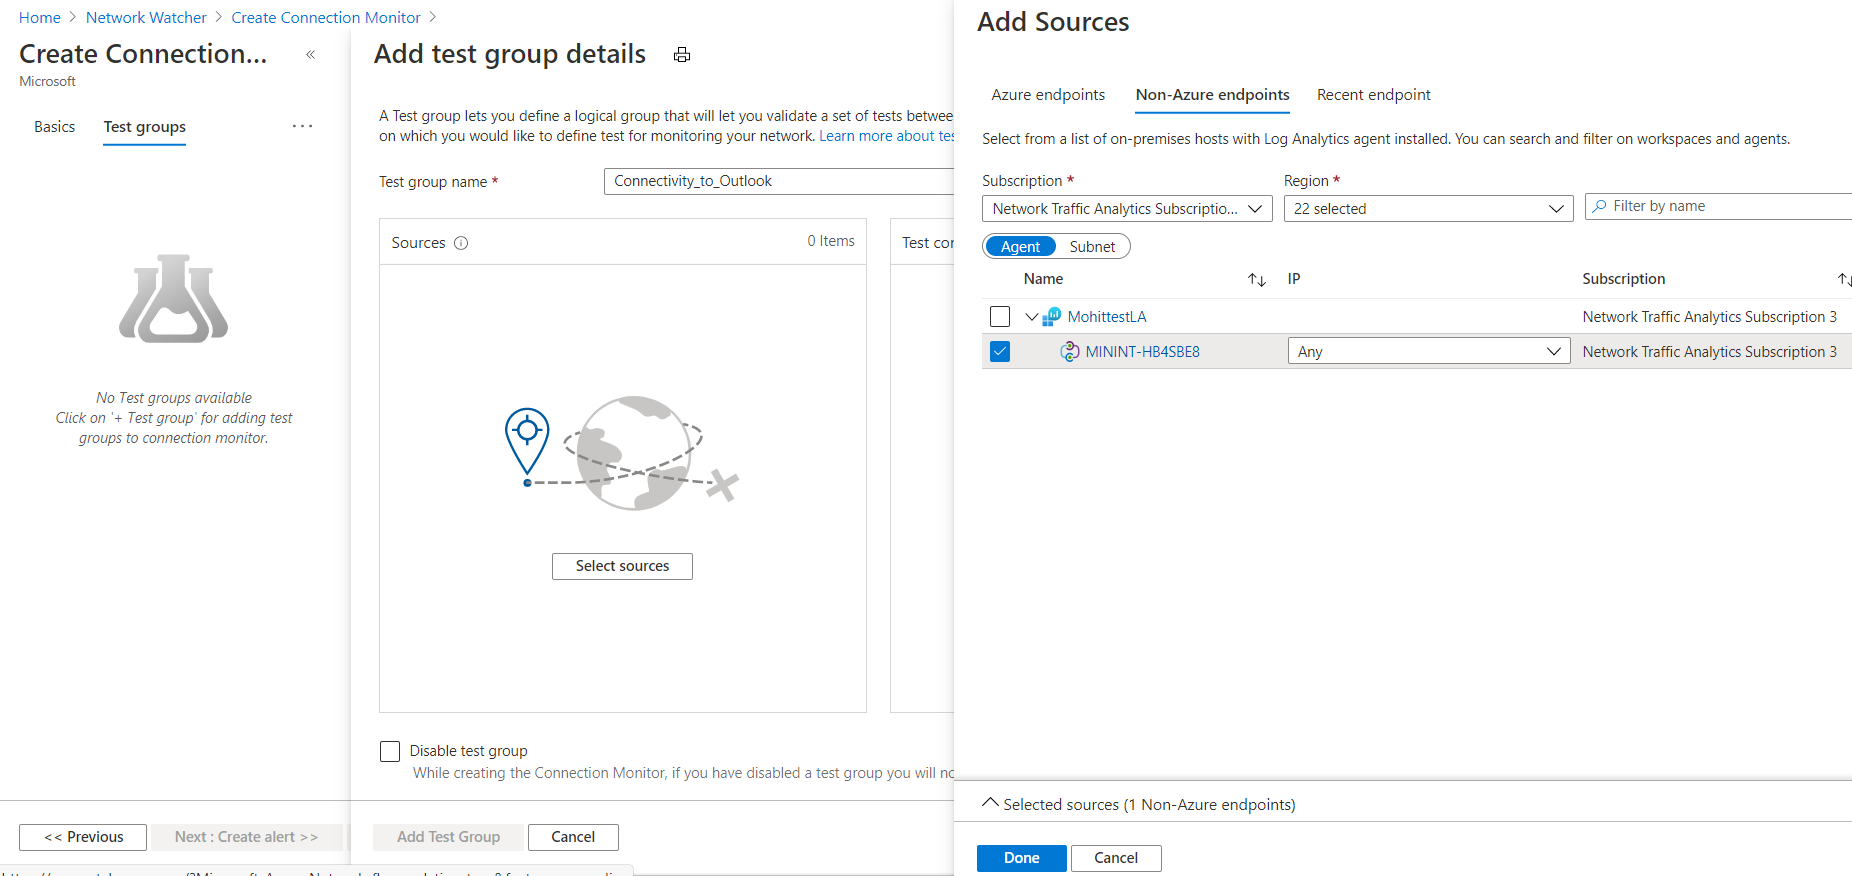
Sources: You can specify both Azure VMs and on-premises machines as sources if agents are installed on them. To learn about installing an agent for your source, see Install monitoring agents.
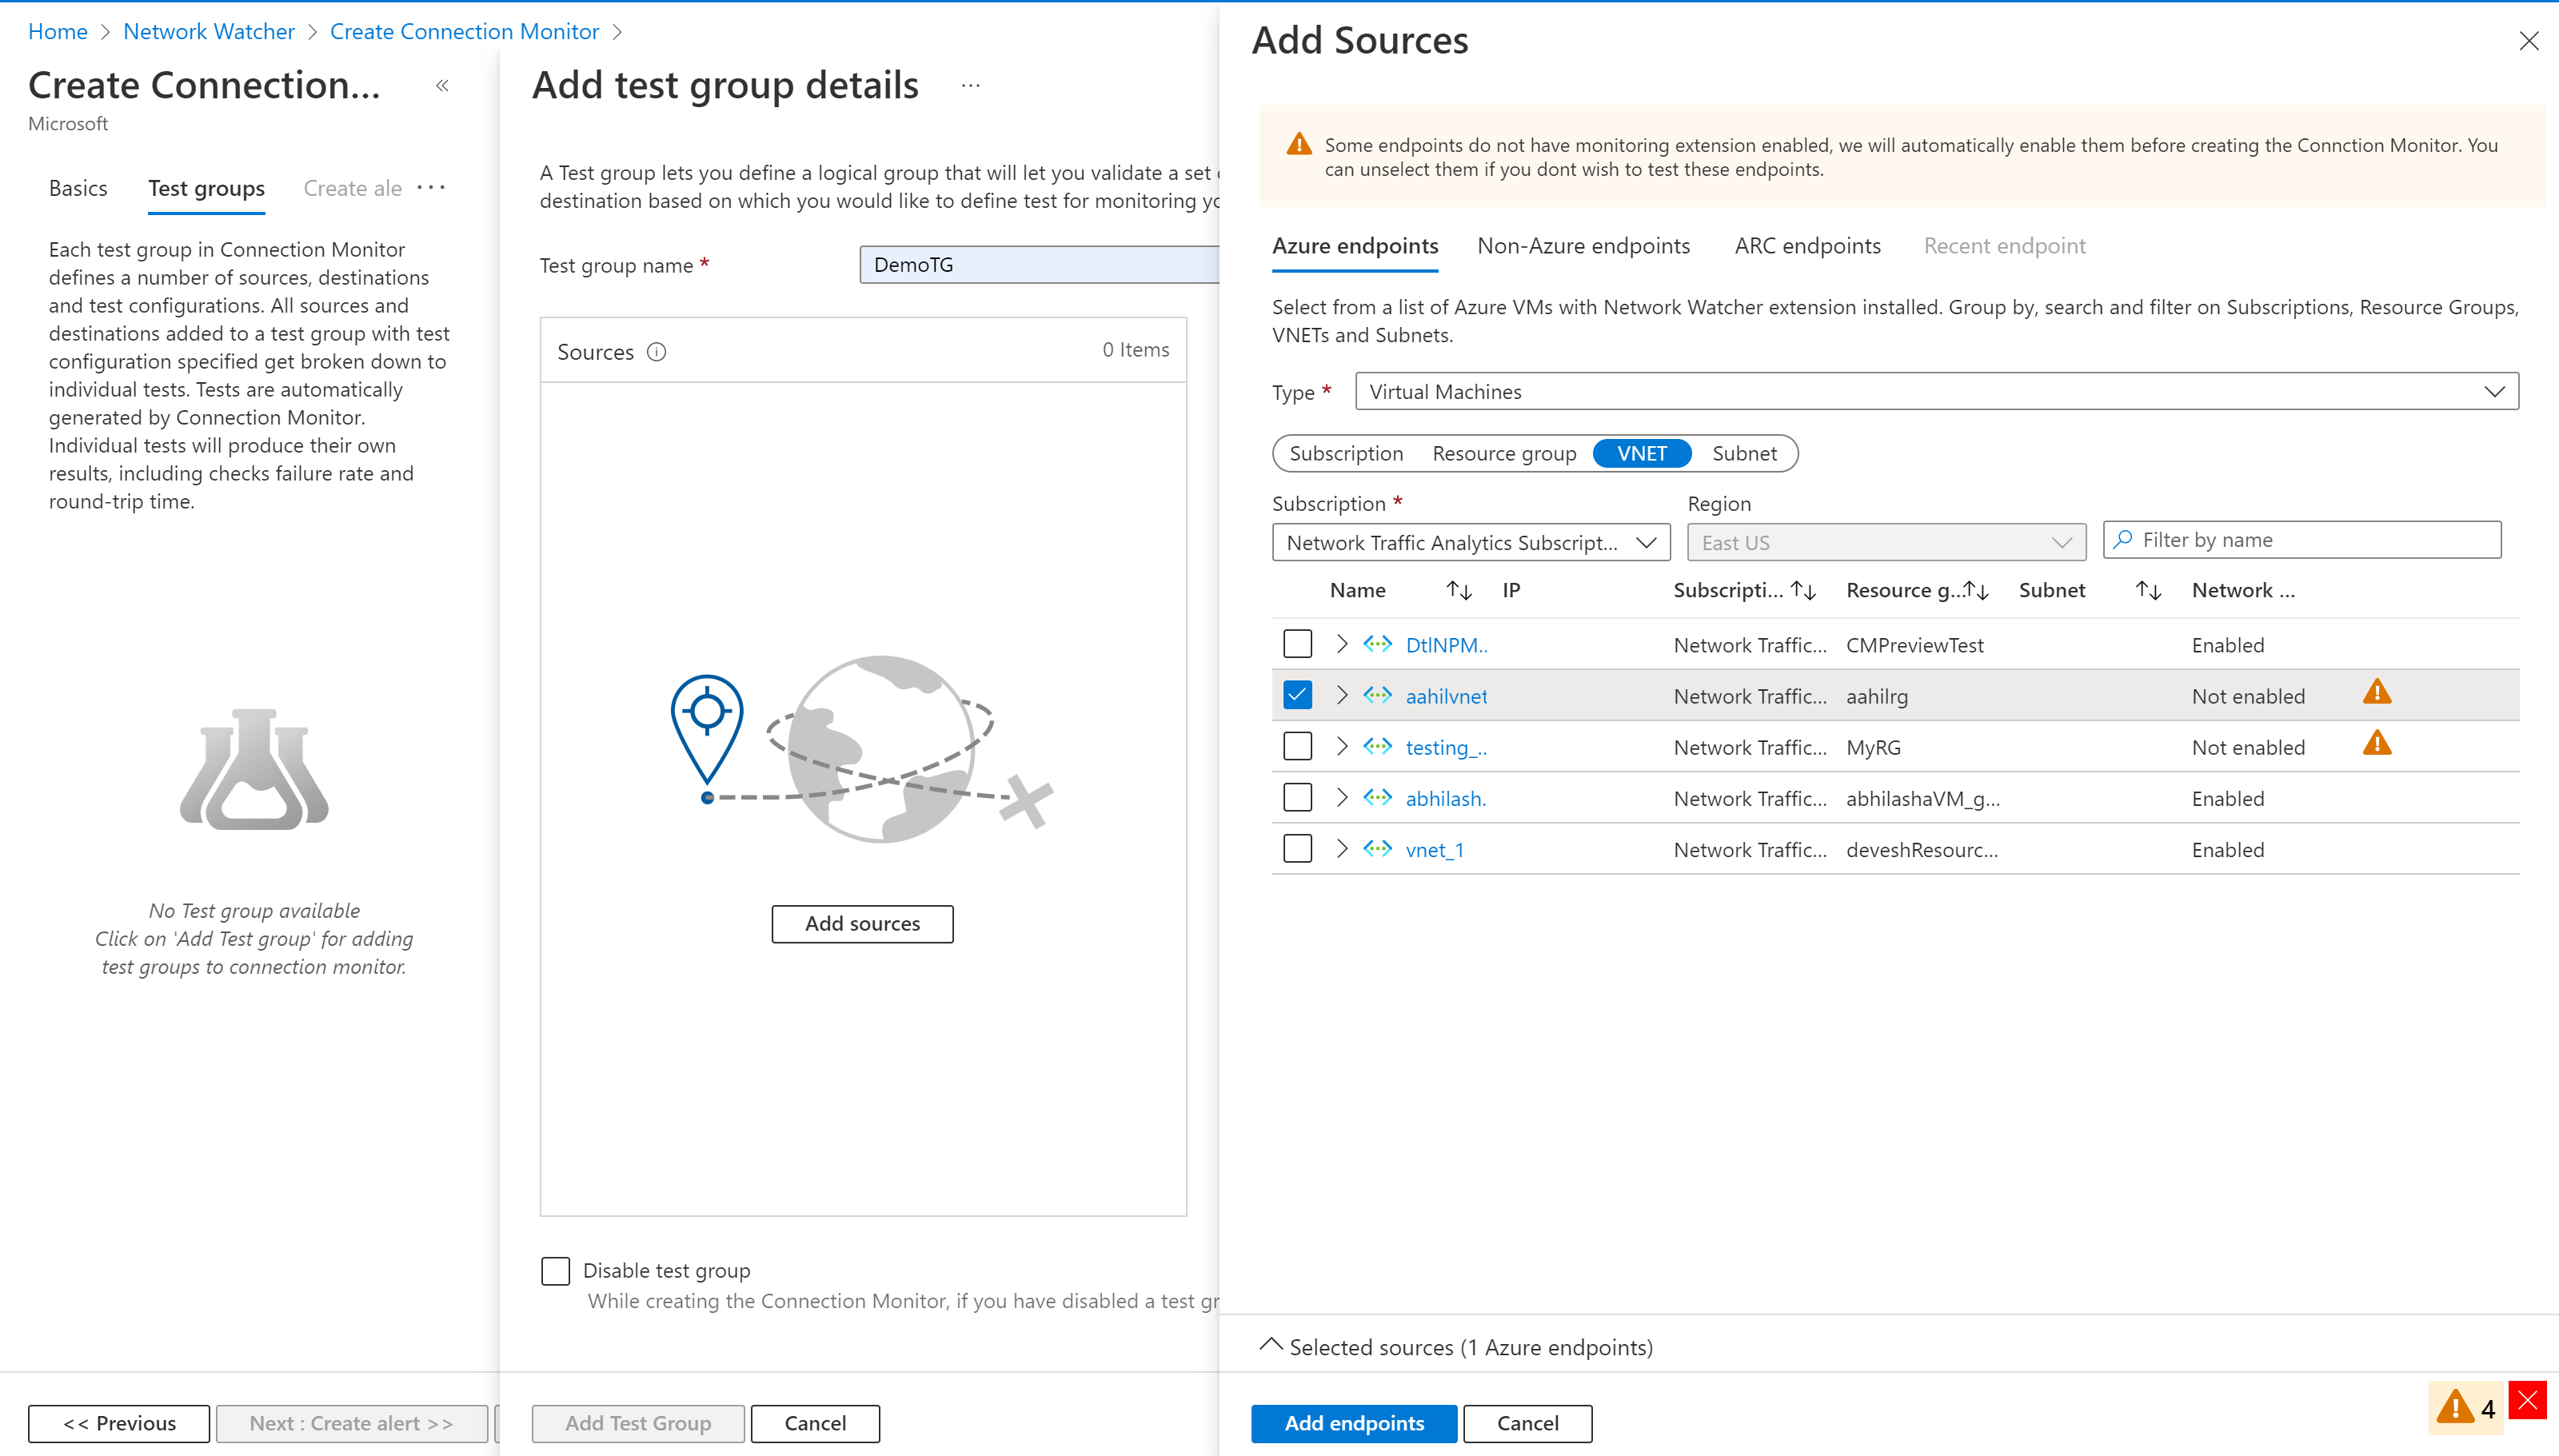
To choose Azure agents, select the Azure endpoints tab. Here you see only VMs or virtual machine scale sets that are bound to the region that you specified when you created the connection monitor. By default, VMs and virtual machine scale sets are grouped into the subscription that they belong to. These groups are collapsed.
You can drill down from the Subscription level to other levels in the hierarchy:
Subscription > Resource group > Virtual network > Subnet > VMs with agents
You can also change the Group by selector to start the tree from any other level. For example, if you group by virtual network, you see the VMs that have agents in the hierarchy Virtual network > Subnet > VMs with agents.
When you select a virtual network, subnet, a single VM or a virtual machine scale set the corresponding resource ID is set as the endpoint. By default, all VMs in the selected virtual network or subnet participate in monitoring. To reduce the scope, either select specific subnets or agents or change the value of the scope property.
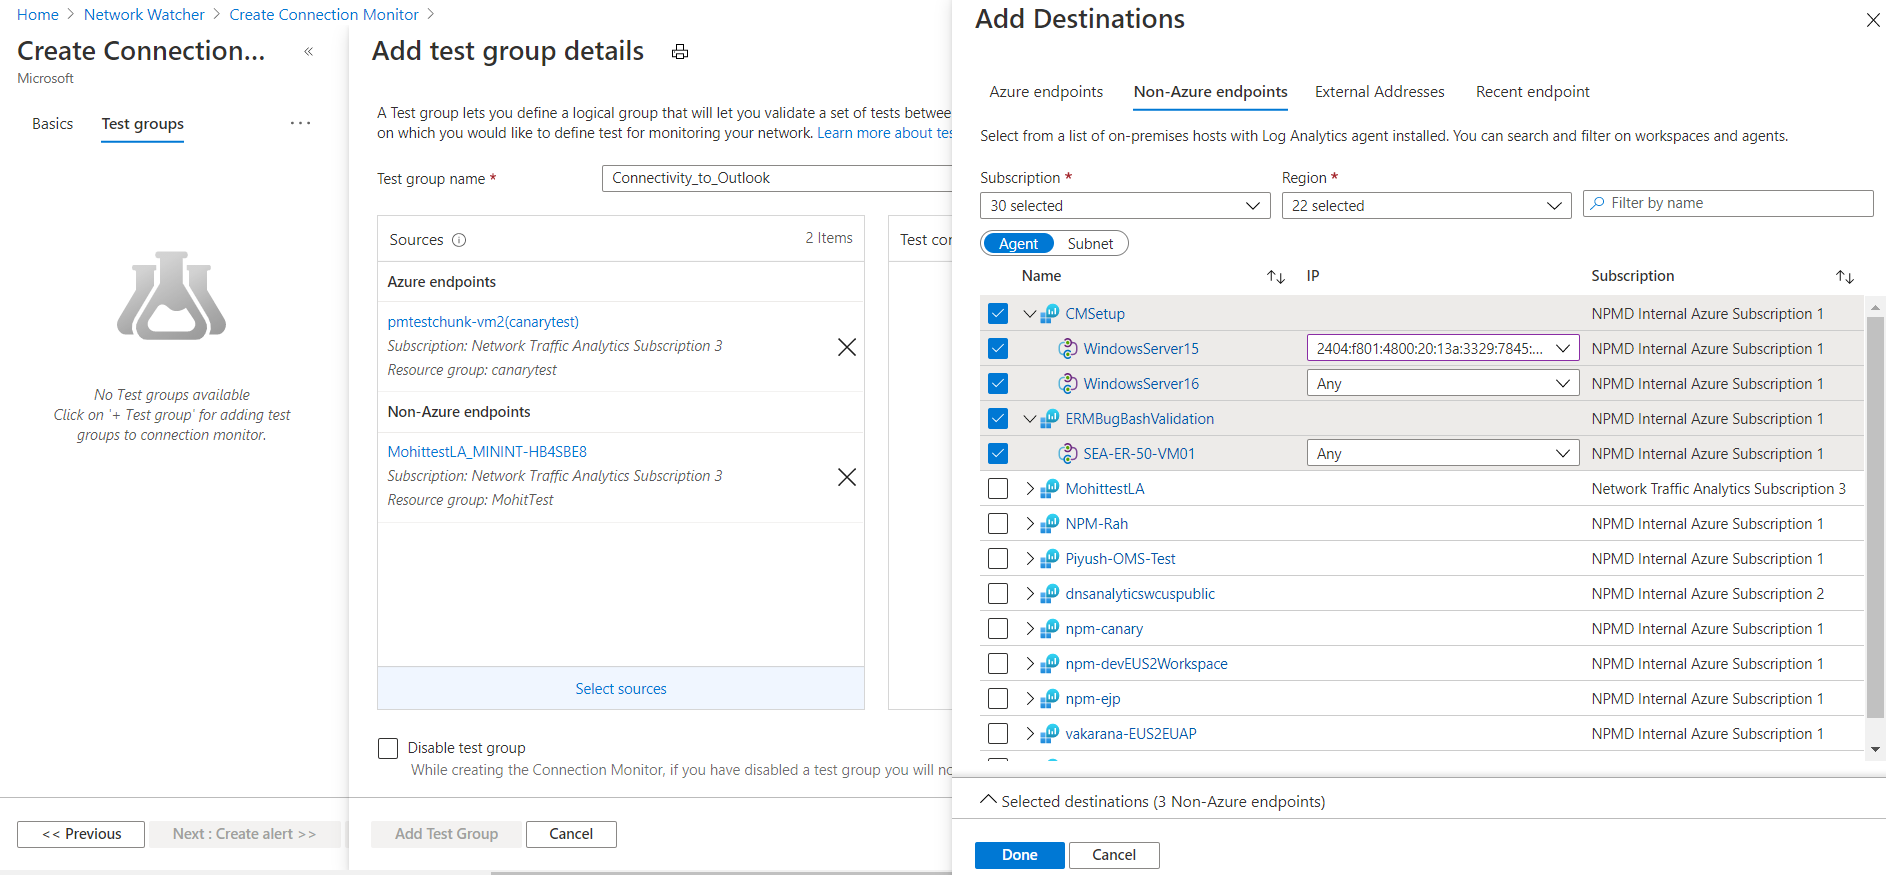
To choose on-premises agents, select the Non–Azure endpoints tab. By default, agents are grouped into workspaces by region. All these workspaces have the Network Performance Monitor configured.
Under Create Connection Monitor, on the Basics pane, the default region is selected. If you change the region, you can choose agents from workspaces in the new region. You can select one or more agents or subnets. In the Subnet view, you can select specific IPs for monitoring. If you add multiple subnets, a custom on-premises network named OnPremises_Network_1 will be created. You can also change the Group by selector to group by agents.
To choose recently used endpoints, you can use the Recent endpoint pane.
You need not choose the endpoints with monitoring agents enabled only. You can select Azure or non-Azure endpoints without the agent enabled and proceed with the creation of Connection Monitor. During the creation process, the monitoring agents for the endpoints will be automatically enabled.
When you finish setting up sources, select Done at the bottom of the pane. You can still edit basic properties like the endpoint name by selecting the endpoint in the Create Test Group view.
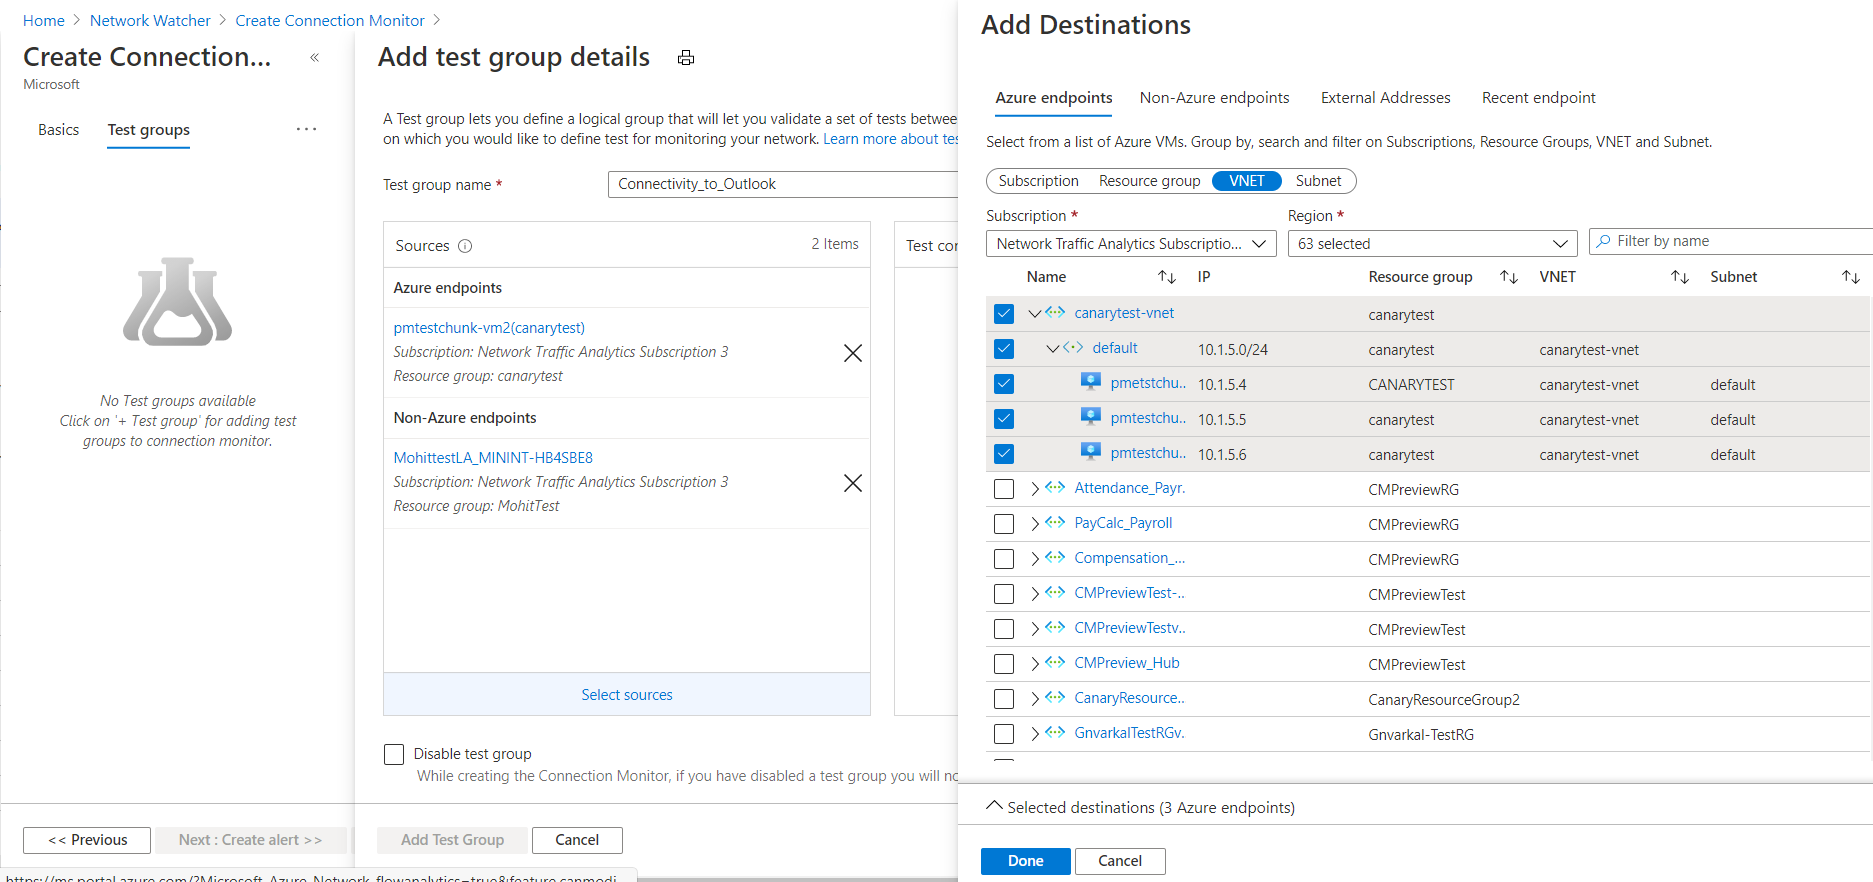
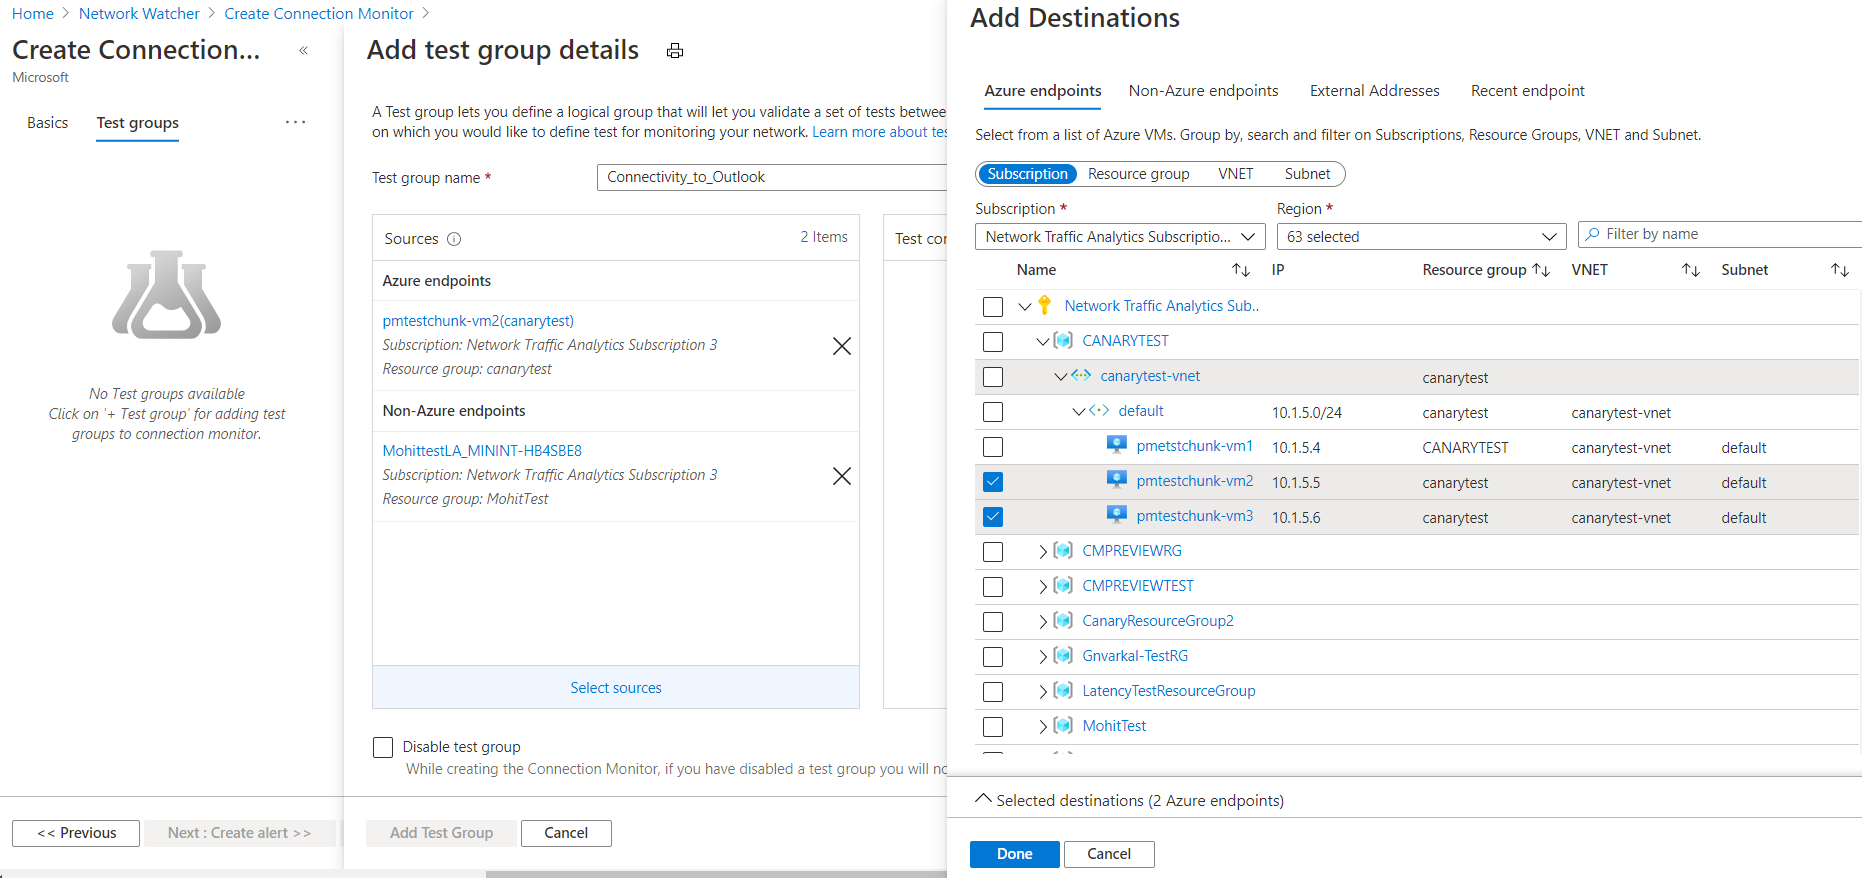
Destinations: You can monitor connectivity to an Azure VM, an on-premises machine, or any endpoint (a public IP, URL, or FQDN) by specifying it as a destination. In a single test group, you can add Azure VMs, on-premises machines, Office 365 URLs, Dynamics 365 URLs, and custom endpoints.
To choose Azure VMs as destinations, select the Azure endpoints tab. By default, the Azure VMs are grouped into a subscription hierarchy that's in the region that you selected under Create Connection Monitor on the Basics pane. You can change the region and choose Azure VMs from the new region. Then you can drill down from the Subscription level to other levels in the hierarchy, just as you can when you set the source Azure endpoints.
You can select virtual networks, subnets, or single VMs, as you can when you set the source Azure endpoints. When you select a virtual network, subnet, or single VM, the corresponding resource ID is set as the endpoint. By default, all VMs in the selected virtual network or subnet that have the Network Watcher extension participate in monitoring. To reduce the scope, either select specific subnets or agents or change the value of the scope property.
To choose non-Azure agents as destinations, select the Non-Azure endpoints tab. By default, agents are grouped into workspaces by region. All these workspaces have Network Performance Monitor configured.
If you need to add Network Performance Monitor to your workspace, get it from Azure Marketplace. For information about how to add Network Performance Monitor, see Monitoring solutions in Azure Monitor. For information about how to configure agents for on-premises machines, see Agents for on-premises machines.
Under Create Connection Monitor, on the Basics pane, the default region is selected. If you change the region, you can choose agents from workspaces in the new region. You can select one or more agents or subnets. In the Subnet view, you can select specific IPs for monitoring. If you add multiple subnets, a custom on-premises network named OnPremises_Network_1 will be created.
To choose public endpoints as destinations, select the External Addresses tab. The list of endpoints includes Office 365 test URLs and Dynamics 365 test URLs, grouped by name. You also can choose endpoints that were created in other test groups in the same connection monitor.
To add an endpoint, in the upper-right corner, select Add Endpoint. Then provide an endpoint name and URL, IP, or FQDN.
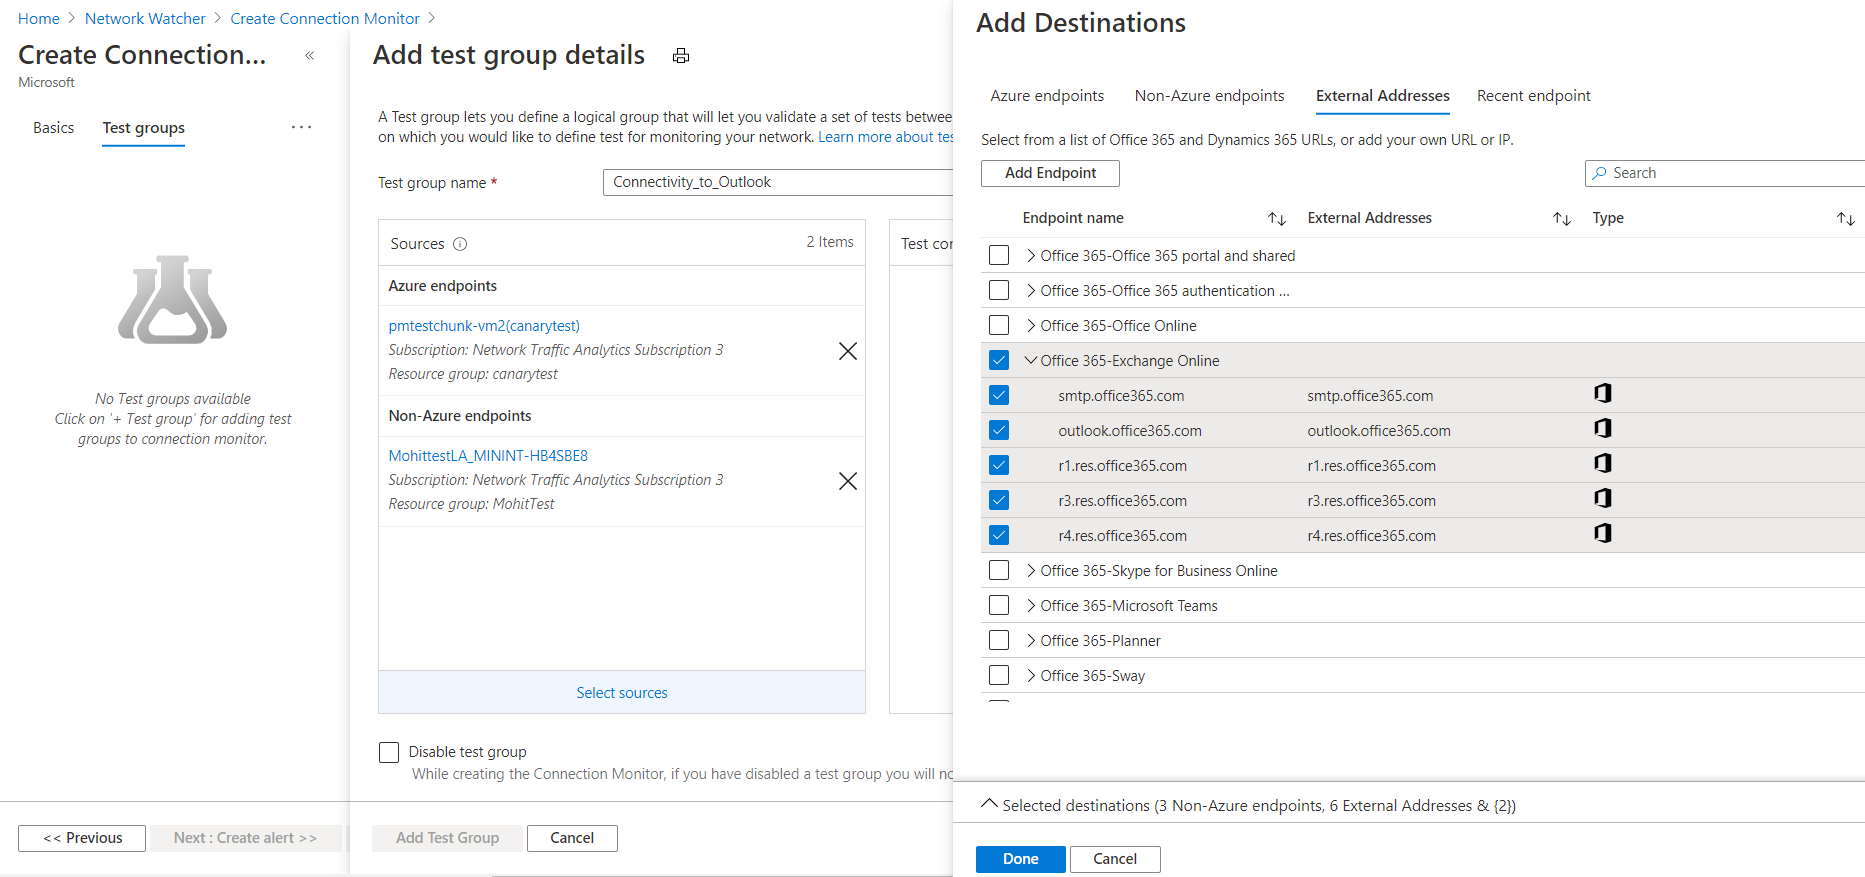
To choose recently used endpoints, go to the Recent endpoint pane.
When you finish choosing destinations, select Done. You can still edit basic properties, such as the endpoint name, by selecting the endpoint in the Create Test Group view.
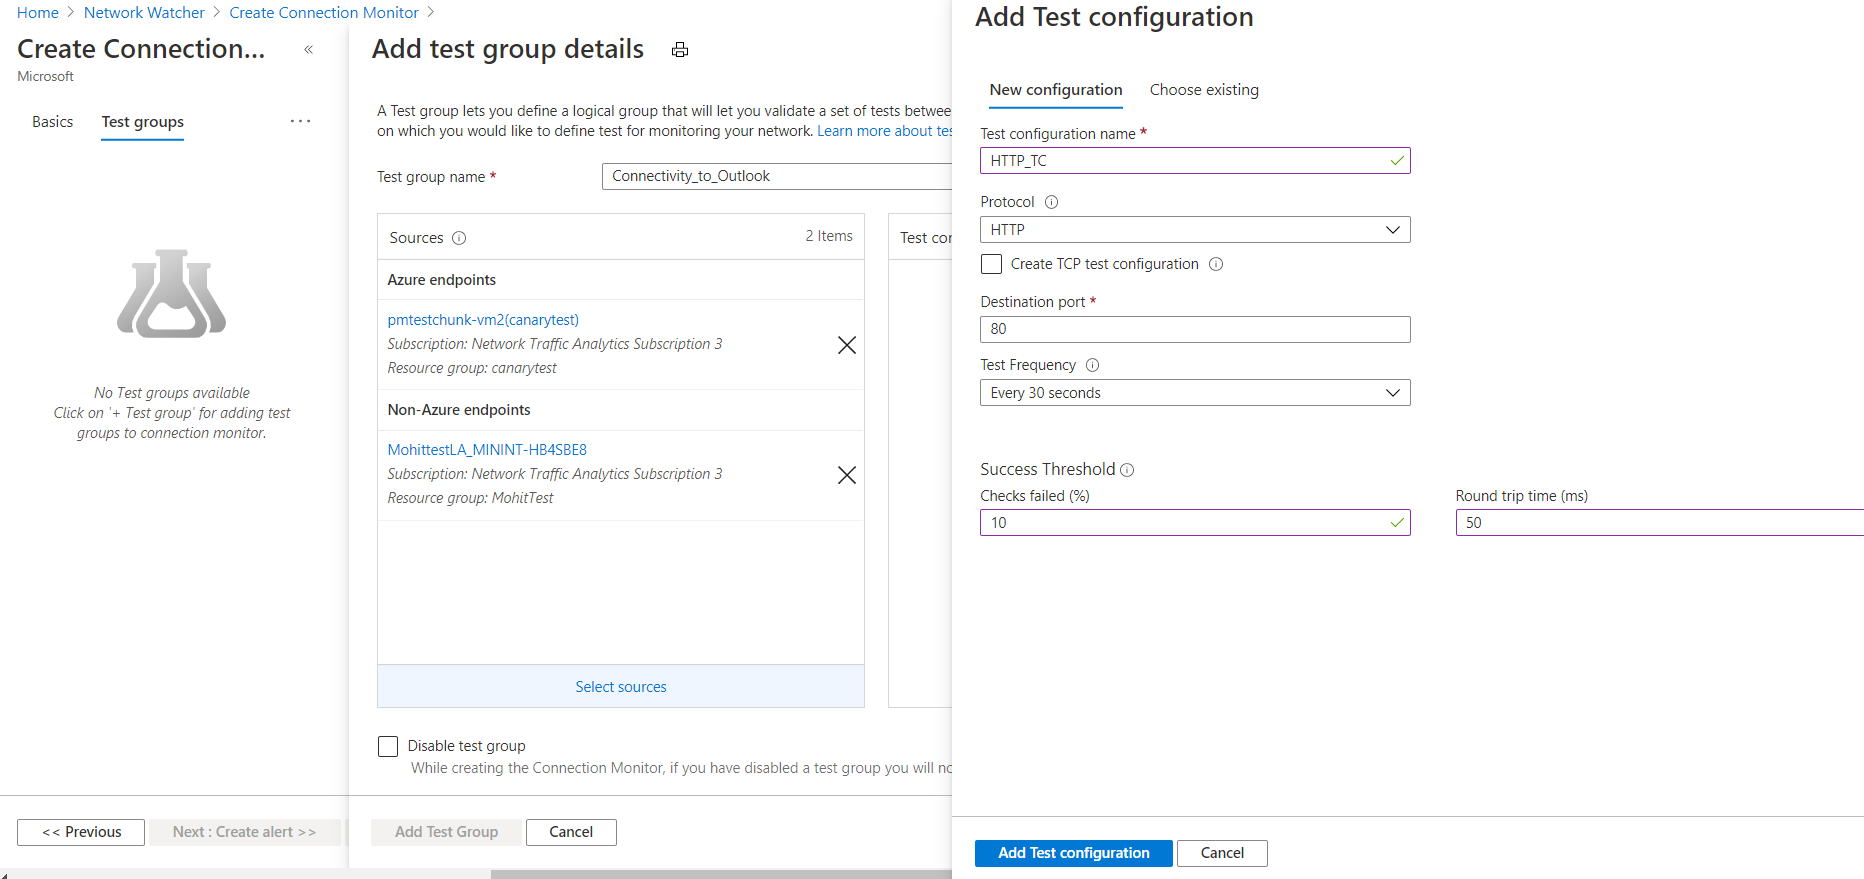
Test configurations: You can add one or more test configurations to a test group. Create a new test configuration by using the New configuration pane. Or add a test configuration from another test group in the same Connection monitor from the Choose existing pane.
a. Test configuration name: Name the test configuration.
b. Protocol: Select TCP, ICMP, or HTTP. To change HTTP to HTTPS, select HTTP as the protocol, and then select 443 as the port.
c. Create TCP test configuration: This checkbox appears only if you select HTTP in the Protocol list. Select this checkbox to create another test configuration that uses the same sources and destinations that you specified elsewhere in your configuration. The new test configuration is named <name of test configuration>_networkTestConfig.
d. Disable traceroute: This checkbox applies when the protocol is TCP or ICMP. Select this box to stop sources from discovering topology and hop-by-hop RTT.
e. Destination port: You can provide a destination port of your choice.
f. Listen on port: This checkbox applies when the protocol is TCP. Select this checkbox to open the chosen TCP port if it's not already open.
g. Test Frequency: In this list, specify how frequently sources will ping destinations on the protocol and port that you specified.You can choose 30 seconds, 1 minute, 5 minutes, 15 minutes, or 30 minutes. Select custom to enter another frequency that's between 30 seconds and 30 minutes. Sources will test connectivity to destinations based on the value that you choose. For example, if you select 30 seconds, sources will check connectivity to the destination at least once in every 30-second period.
h. Success Threshold: You can set thresholds on the following network parameters:Checks failed: Set the percentage of checks that can fail when sources check connectivity to destinations by using the criteria that you specified. For the TCP or ICMP protocol, the percentage of failed checks can be equated to the percentage of packet loss. For HTTP protocol, this value represents the percentage of HTTP requests that received no response.
Round trip time: Set the RTT, in milliseconds, for how long sources can take to connect to the destination over the test configuration.
Test Groups: You can add one or more Test Groups to a Connection monitor. These test groups can consist of multiple Azure or non-Azure endpoints.
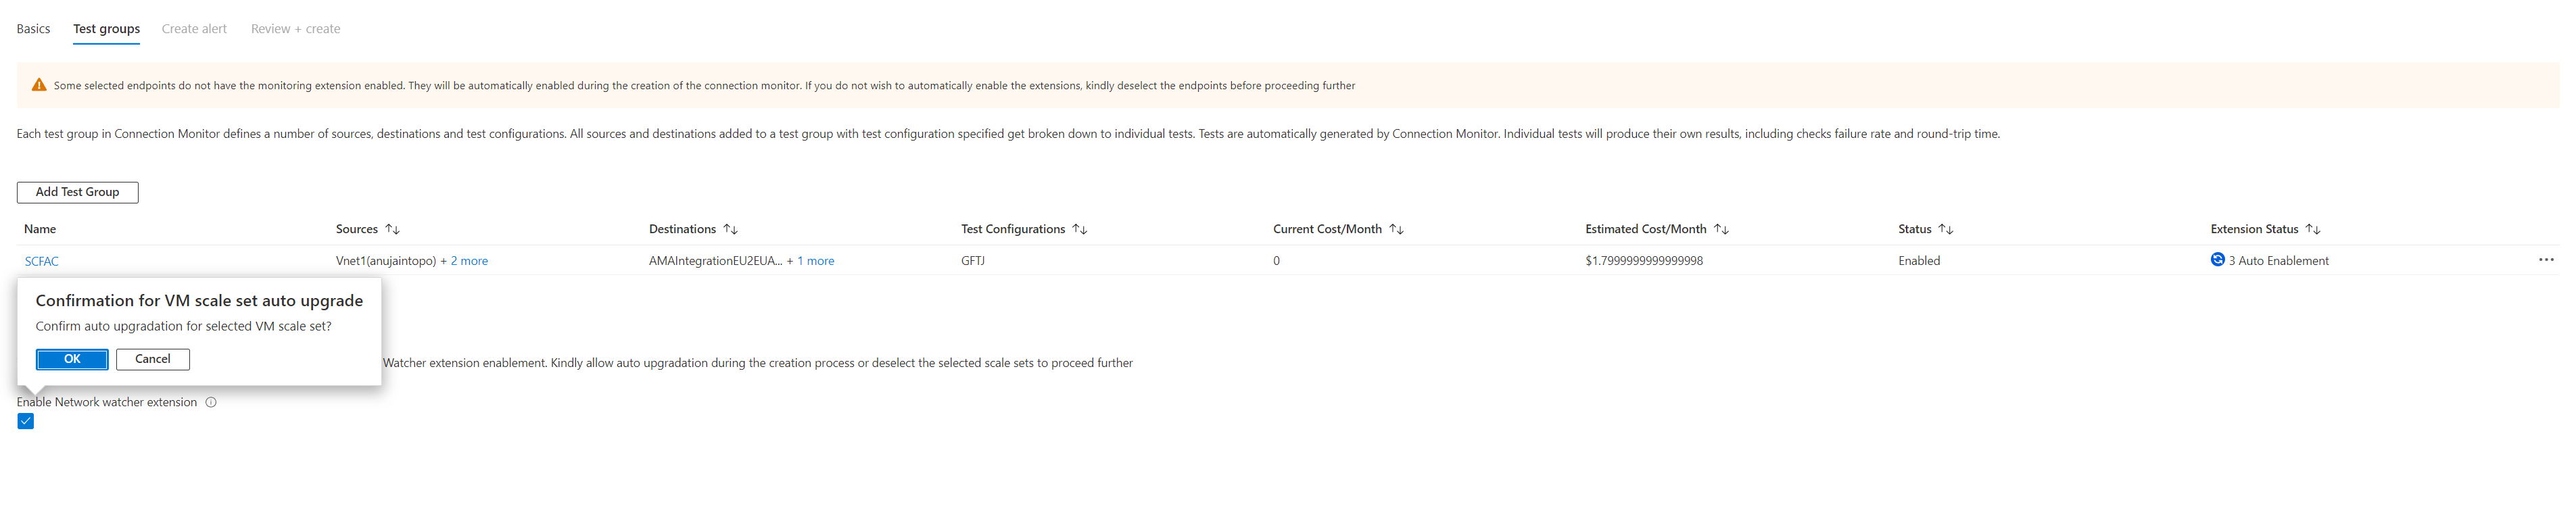
For selected Azure VMs or Azure virtual machine scale sets and non-Azure endpoints without monitoring extensions, the extension for Azure VMs and the Network Performance Monitor solution for non-Azure endpoints will be auto-enabled after the creation of Connection monitor begins.
If the selected virtual machine scale set is set for manual upgrade, you'll have to upgrade the scale set after the Network Watcher extension installation. Doing so lets you continue setting up the Connection monitor with virtual machine scale sets as endpoints. If the virtual machine scale set is set to auto-upgrade, you don't need to worry about upgrading after the installation of the Network Watcher extension.
In the previously mentioned scenario, you can consent to an auto-upgrade of virtual Machine Scale sets with auto-enabling of the Network Watcher extension during the creation of Connection monitor for virtual Machine Scale sets with manual upgrading. This approach eliminates the need to manually upgrade the virtual machine scale set after you install the Network Watcher extension.
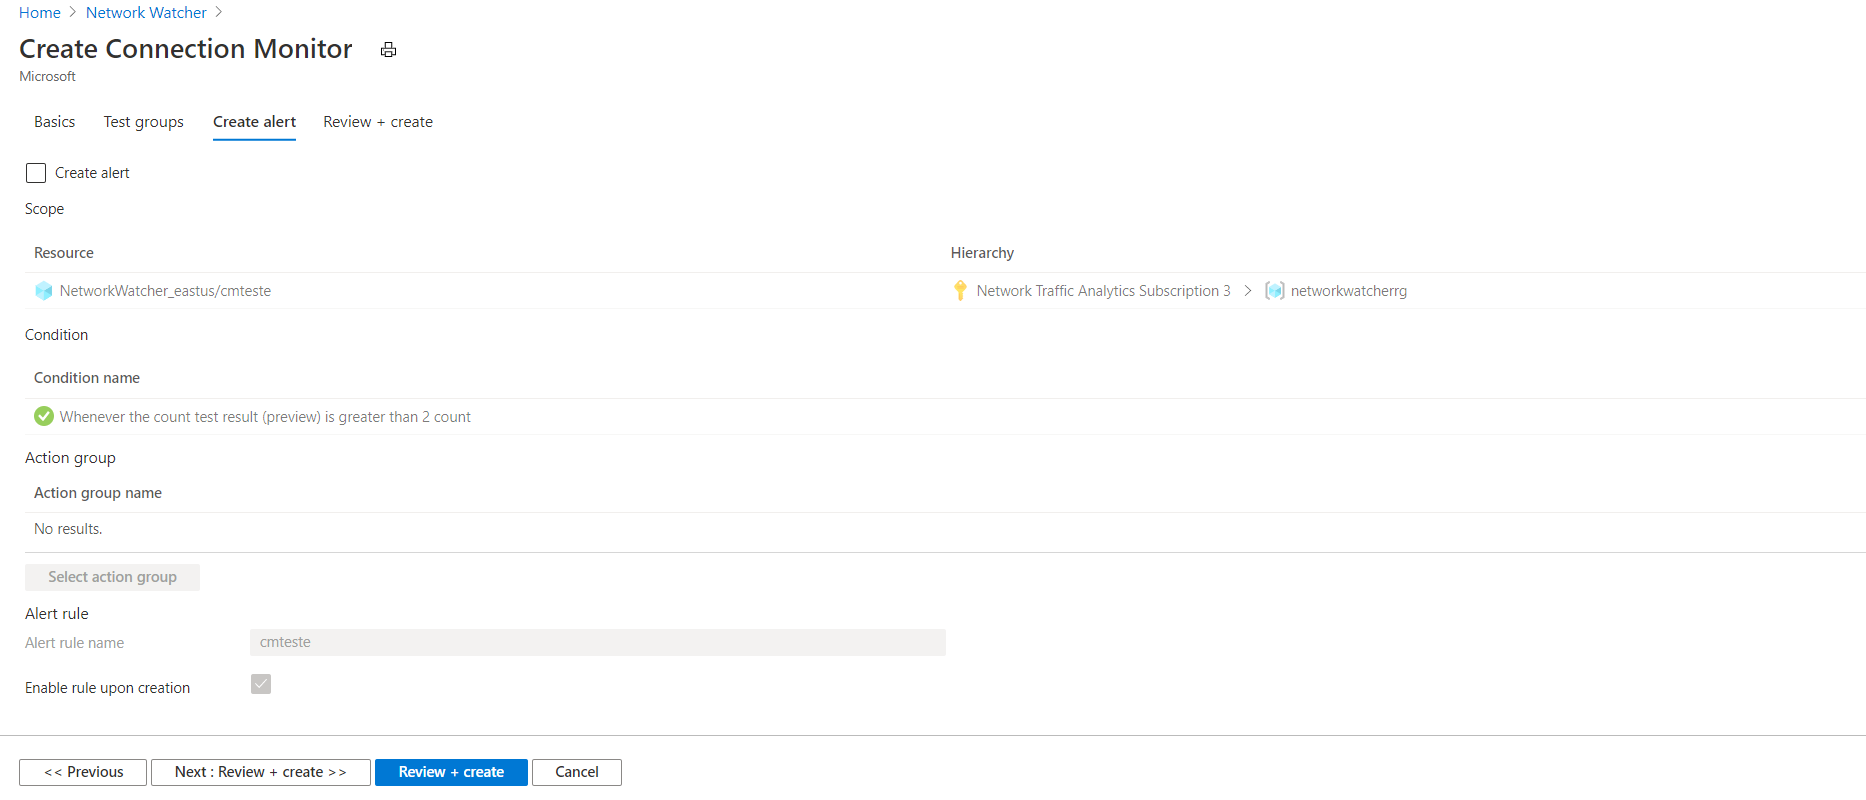
Create alerts in Connection monitor
You can set up alerts on tests that are failing based on the thresholds set in test configurations.
In the Azure portal, to create alerts for a connection monitor, specify values for these fields:
Create alert: You can select this checkbox to create a metric alert in Azure Monitor. When you select this checkbox, the other fields will be enabled for editing. Additional charges for the alert will be applicable, based on the pricing for alerts.
Scope > Resource > Hierarchy: These values are automatically filled, based on the values specified on the Basics pane.
Condition name: The alert is created on the
Test Result(preview)metric. When the result of the connection monitor test is a failing result, the alert rule will fire.Action group name: You can enter your email directly or you can create alerts via action groups. If you enter your email directly, an action group with the name NPM Email ActionGroup is created. The email ID is added to that action group. If you choose to use action groups, you need to select a previously created action group. To learn how to create an action group, see Create action groups in the Azure portal. After the alert is created, you can manage your alerts.
Alert rule name: The name of the connection monitor.
Enable rule upon creation: Select this checkbox to enable the alert rule based on the condition. Disable this checkbox if you want to create the rule without enabling it.
After you've completed all the steps, the process will proceed with a unified enabling of monitoring extensions for all endpoints without monitoring agents enabled, followed by the creation of the connection monitor.
After the creation process is successful, it takes about 5 minutes for the connection monitor to be displayed on the dashboard.
Virtual machine scale set coverage
Currently, Connection monitor provides default coverage for the scale set instances that are selected as endpoints. This means that only a default percentage of all the added scale set instances would be randomly selected to monitor connectivity from the scale set to the endpoint.
As a best practice, to avoid loss of data due to downscaling of instances, we recommend that you select all instances in a scale set while you're creating a test group, instead of selecting a particular few for monitoring your endpoints.
Scale limits
Connection monitors have these scale limits:
- Maximum connection monitors per subscription per region: 100
- Maximum test groups per connection monitor: 20
- Maximum sources and destinations per connection monitor: 100
- Maximum test configurations per connection monitor: 2 via the Azure portal
Clean up resources
When no longer needed, delete myResourceGroup resource group and all of the resources it contains:
In the search box at the top of the portal, enter myResourceGroup. Select myResourceGroup from the search results.
Select Delete resource group.
In Delete a resource group, enter myResourceGroup, and then select Delete.
Select Delete to confirm the deletion of the resource group and all its resources.
Next step
To learn how to diagnose and troubleshoot problems with virtual network gateways, advance to the next tutorial:
Feedback
Coming soon: Throughout 2024 we will be phasing out GitHub Issues as the feedback mechanism for content and replacing it with a new feedback system. For more information see: https://aka.ms/ContentUserFeedback.
Submit and view feedback for