Audit logging in Azure Database for PostgreSQL - Single Server
APPLIES TO:  Azure Database for PostgreSQL - Single Server
Important
Azure Database for PostgreSQL - Single Server is on the retirement path. We strongly recommend that you upgrade to Azure Database for PostgreSQL - Flexible Server. For more information about migrating to Azure Database for PostgreSQL - Flexible Server, see What's happening to Azure Database for PostgreSQL Single Server?.
Audit logging of database activities in Azure Database for PostgreSQL - Single Server is available through the PostgreSQL Audit extension, pgAudit. The pgAudit extension provides detailed session and object audit logging.
Note
The pgAudit extension is in preview on Azure Database for PostgreSQL. It can be enabled on general purpose and memory-optimized servers only.
If you want Azure resource-level logs for operations like compute and storage scaling, see Overview of Azure platform logs.
Usage considerations
By default, pgAudit log statements are emitted along with your regular log statements by using the Postgres standard logging facility. In Azure Database for PostgreSQL, these .log files can be downloaded through the Azure portal or the Azure CLI. The maximum storage for the collection of files is 1 GB. Each file is available for a maximum of seven days. The default is three days. This service is a short-term storage option.
Alternatively, you can configure all logs to be sent to the Azure Monitor Logs store for later analytics in Log Analytics. If you enable Monitor resource logging, your logs are automatically sent in JSON format to Azure Storage, Azure Event Hubs, or Monitor Logs, depending on your choice.
Enabling pgAudit generates a large volume of logging on a server, which affects performance and log storage. We recommend that you use Monitor Logs, which offers longer-term storage options and analysis and alerting features. Turn off standard logging to reduce the performance impact of additional logging:
- Set the parameter
logging_collectorto OFF. - Restart the server to apply this change.
To learn how to set up logging to Storage, Event Hubs, or Monitor Logs, see the resource logs section of Logs in Azure Database for PostgreSQL - Single Server.
Install pgAudit
To install pgAudit, you need to include it in the server's shared preloaded libraries. A change to the Postgres shared_preload_libraries parameter requires a server restart to take effect. You can change parameters by using the portal, the CLI, or the REST API.
To use the portal:
Select your Azure Database for PostgreSQL server.
On the left, under Settings, select Server parameters.
Search for shared_preload_libraries.
Select PGAUDIT.
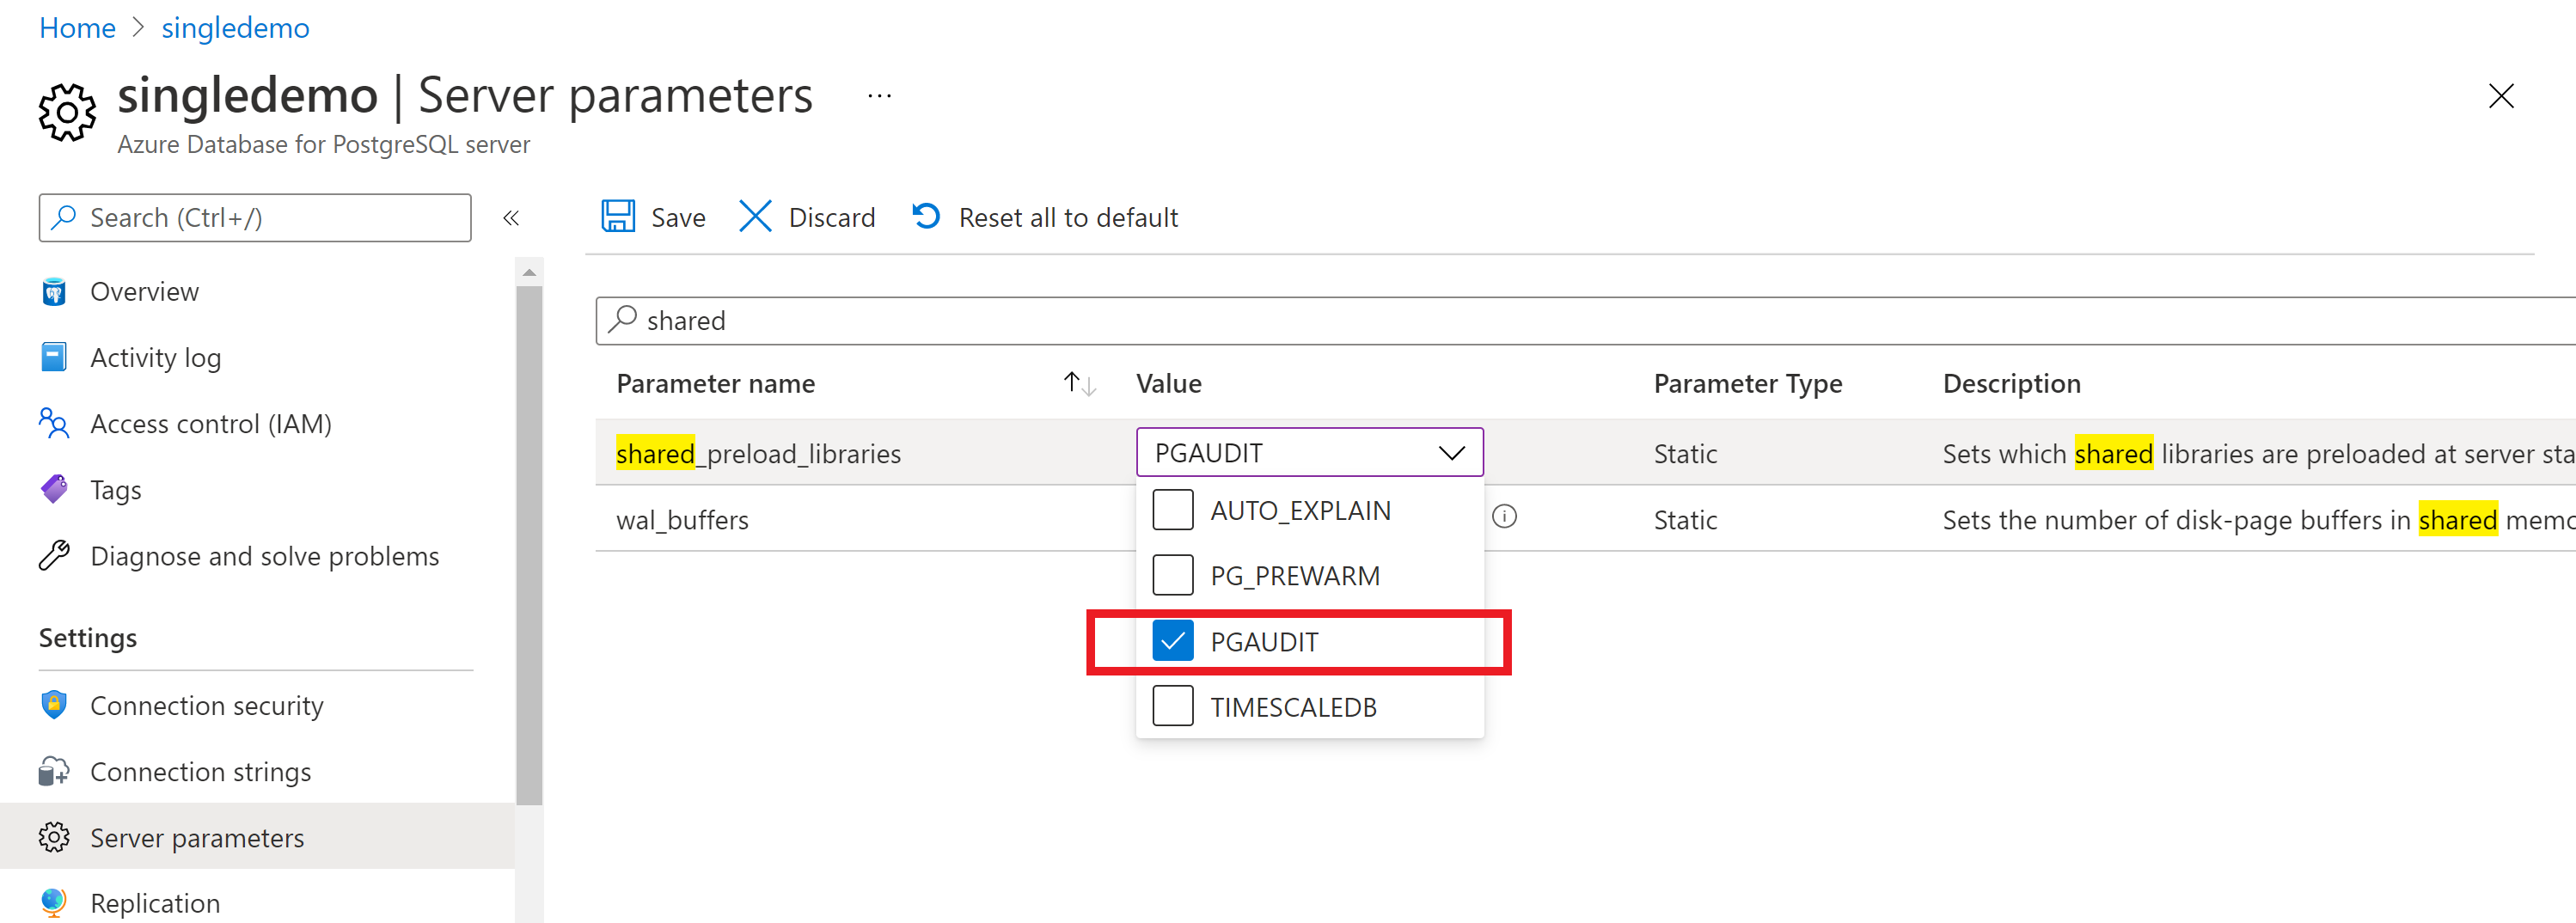
Restart the server to apply the change.
Connect to your server by using a client like psql, and enable the pgAudit extension:
CREATE EXTENSION pgaudit;
Tip
If you see an error, confirm that you restarted your server after you saved shared_preload_libraries.
pgAudit settings
By using pgAudit, you can configure session or object audit logging. Session audit logging emits detailed logs of executed statements. Object audit logging is audit scoped to specific relations. You can choose to set up one or both types of logging.
Note
The pgAudit settings are specified globally and can't be specified at a database or role level.
After you install pgAudit, you can configure its parameters to start logging.
To configure pgAudit, in the portal:
Select your Azure Database for PostgreSQL server.
On the left, under Settings, select Server parameters.
Search for the pgaudit parameters.
Select appropriate settings parameters to edit. For example, to start logging, set pgaudit.log to WRITE.
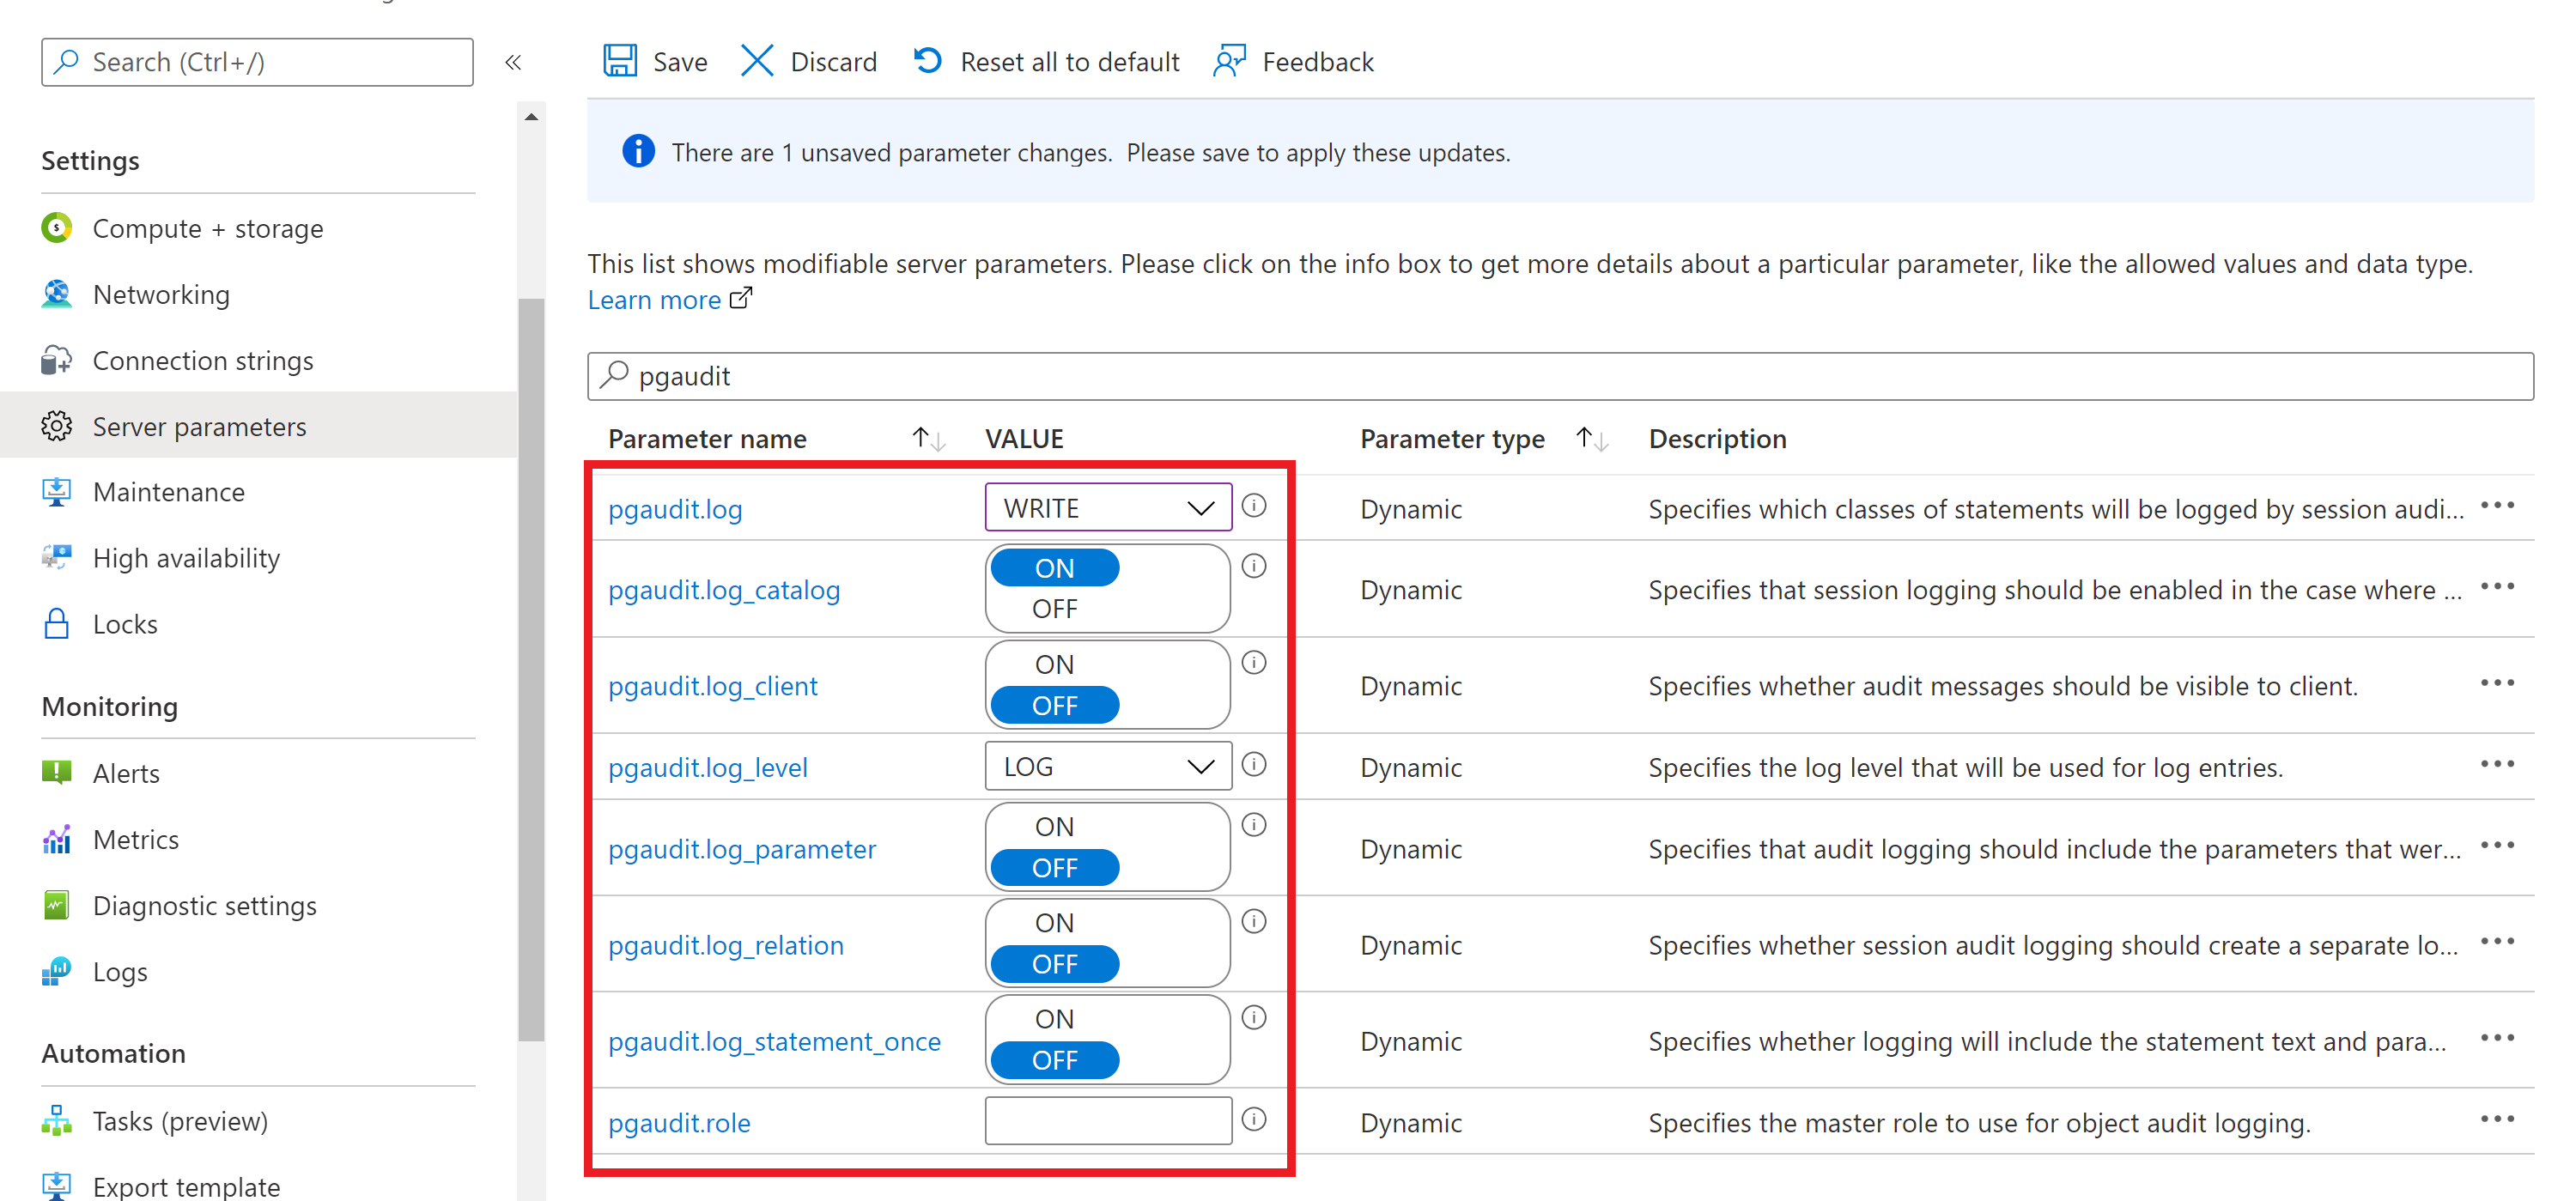
Select Save to save your changes.
The pgAudit documentation provides the definition of each parameter. Test the parameters first, and confirm that you're getting the expected behavior. For example:
- When the setting pgaudit.log_client is turned on, it redirects logs to a client process like psql instead of being written to a file. In general, leave this setting disabled.
- The parameter pgaudit.log_level is only enabled when pgaudit.log_client is on.
Note
In Azure Database for PostgreSQL, pgaudit.log can't be set by using a minus-sign shortcut (-) as described in the pgAudit documentation. All required statement classes, such as READ and WRITE, should be individually specified.
Audit log format
Each audit entry is indicated by AUDIT: near the beginning of the log line. The format of the rest of the entry is detailed in the pgAudit documentation.
If you need any other fields to satisfy your audit requirements, use the Postgres parameter log_line_prefix. The string log_line_prefix is output at the beginning of every Postgres log line. For example, the following log_line_prefix setting provides timestamp, username, database name, and process ID:
t=%m u=%u db=%d pid=[%p]:
To learn more about log_line_prefix, see the PostgreSQL documentation.
Get started
To quickly get started, set pgaudit.log to WRITE. Then open your logs to review the output.
View audit logs
If you're using .log files, your audit logs are included in the same file as your PostgreSQL error logs. You can download log files from the portal or the CLI.
If you're using Azure resource logging, the way you access the logs depends on which endpoint you choose. For Storage, see Azure resource logs. For Event Hubs, also see Azure resource logs.
For Monitor Logs, the logs are sent to the workspace you selected. The Postgres logs use the AzureDiagnostics collection mode, so they can be queried from the AzureDiagnostics table, as shown. To learn more about querying and alerting, see Log queries in Azure Monitor.
Use this query to get started. You can configure alerts based on queries.
Search for all Postgres logs for a particular server in the last day:
AzureDiagnostics
| where LogicalServerName_s == "myservername"
| where TimeGenerated > ago(1d)
| where Message contains "AUDIT:"
Next steps
- Learn about logging in Azure Database for PostgreSQL.
- Learn how to set parameters by using the Azure portal, the Azure CLI, or the REST API.
Feedback
Coming soon: Throughout 2024 we will be phasing out GitHub Issues as the feedback mechanism for content and replacing it with a new feedback system. For more information see: https://aka.ms/ContentUserFeedback.
Submit and view feedback for