Monitor Azure Route Server
This article helps you understand Azure Route Server monitoring and metrics using Azure Monitor. Azure Monitor is one stop shop for all metrics, alerting and diagnostic logs across all of Azure.
Note
Using Classic Metrics is not recommended.
Route Server metrics
To view Azure Route Server metrics, go to your Route Server resource in the Azure portal and select Metrics.
Once a metric is selected, the default aggregation is applied. Optionally, you can apply splitting, which shows the metric with different dimensions.

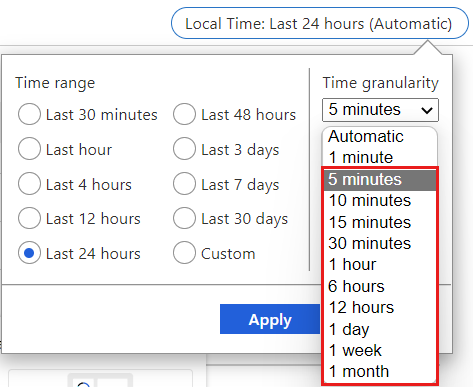
Important
When viewing Route Server metrics in the Azure portal, select a time granularity of 5 minutes or greater for best possible results.
Aggregation types
Metrics explorer supports Sum, Count, Average, Minimum and Maximum as aggregation types. You should use the recommended Aggregation type when reviewing the insights for each Route Server metric.
- Sum: The sum of all values captured during the aggregation interval.
- Count: The number of measurements captured during the aggregation interval.
- Average: The average of the metric values captured during the aggregation interval.
- Minimum: The smallest value captured during the aggregation interval.
- Maximum: The largest value captured during the aggregation interval.
| Metric | Category | Unit | Aggregation Type | Description | Dimensions | Exportable via Diagnostic Settings? |
|---|---|---|---|---|---|---|
| BGP Peer Status | Scalability | Count | Maximum | BGP availability from Route Server to Peer | BGP Peer IP, BGP Peer Type, Route Server Instance | Yes |
| Count of Routes Advertised to Peer | Scalability | Count | Maximum | Count of routes advertised from Route Server to Peer | BGP Peer IP, BGP Peer Type, Route Server Instance | Yes |
| Count of Routes Learned from Peer | Scalability | Count | Maximum | Count of routes learned from Peer | BGP Peer IP, BGP Peer Type, Route Server Instance | Yes |
Important
Azure Monitor exposes another metric for Route Server, Data Processed by the Virtual Hub Router. This metric doesn't apply to Route Server and should be ignored.
BGP Peer Status
Aggregation type: Max
This metric shows the BGP availability of peer NVA connections. The BGP Peer Status is a binary metric. 1 = BGP is up-and-running. 0 = BGP is unavailable.

To check the BGP status of a specific NVA peer, select Apply splitting and choose BgpPeerIp.

Count of Routes Advertised to Peer
Aggregation type: Max
This metric shows the number of routes the Route Server advertised to NVA peers.

Count of Routes Learned from Peer
Aggregation type: Max
This metric shows the number of routes the Route Server learned from NVA peers.

To show the number of routes the Route Server received from a specific NVA peer, select Apply splitting and choose BgpPeerIp.

Next steps
To learn how to configure a Route Server, see:
Feedback
Coming soon: Throughout 2024 we will be phasing out GitHub Issues as the feedback mechanism for content and replacing it with a new feedback system. For more information see: https://aka.ms/ContentUserFeedback.
Submit and view feedback for