Manage your SOC better with incident metrics
Note
For information about feature availability in US Government clouds, see the Microsoft Sentinel tables in Cloud feature availability for US Government customers.
As a Security Operations Center (SOC) manager, you need to have overall efficiency metrics and measures at your fingertips to gauge the performance of your team. You'll want to see incident operations over time by many different criteria, like severity, MITRE tactics, mean time to triage, mean time to resolve, and more. Microsoft Sentinel now makes this data available to you with the new SecurityIncident table and schema in Log Analytics and the accompanying Security operations efficiency workbook. You'll be able to visualize your team's performance over time and use this insight to improve efficiency. You can also write and use your own KQL queries against the incident table to create customized workbooks that fit your specific auditing needs and KPIs.
Use the security incidents table
The SecurityIncident table is built into Microsoft Sentinel. You'll find it with the other tables in the SecurityInsights collection under Logs. You can query it like any other table in Log Analytics.
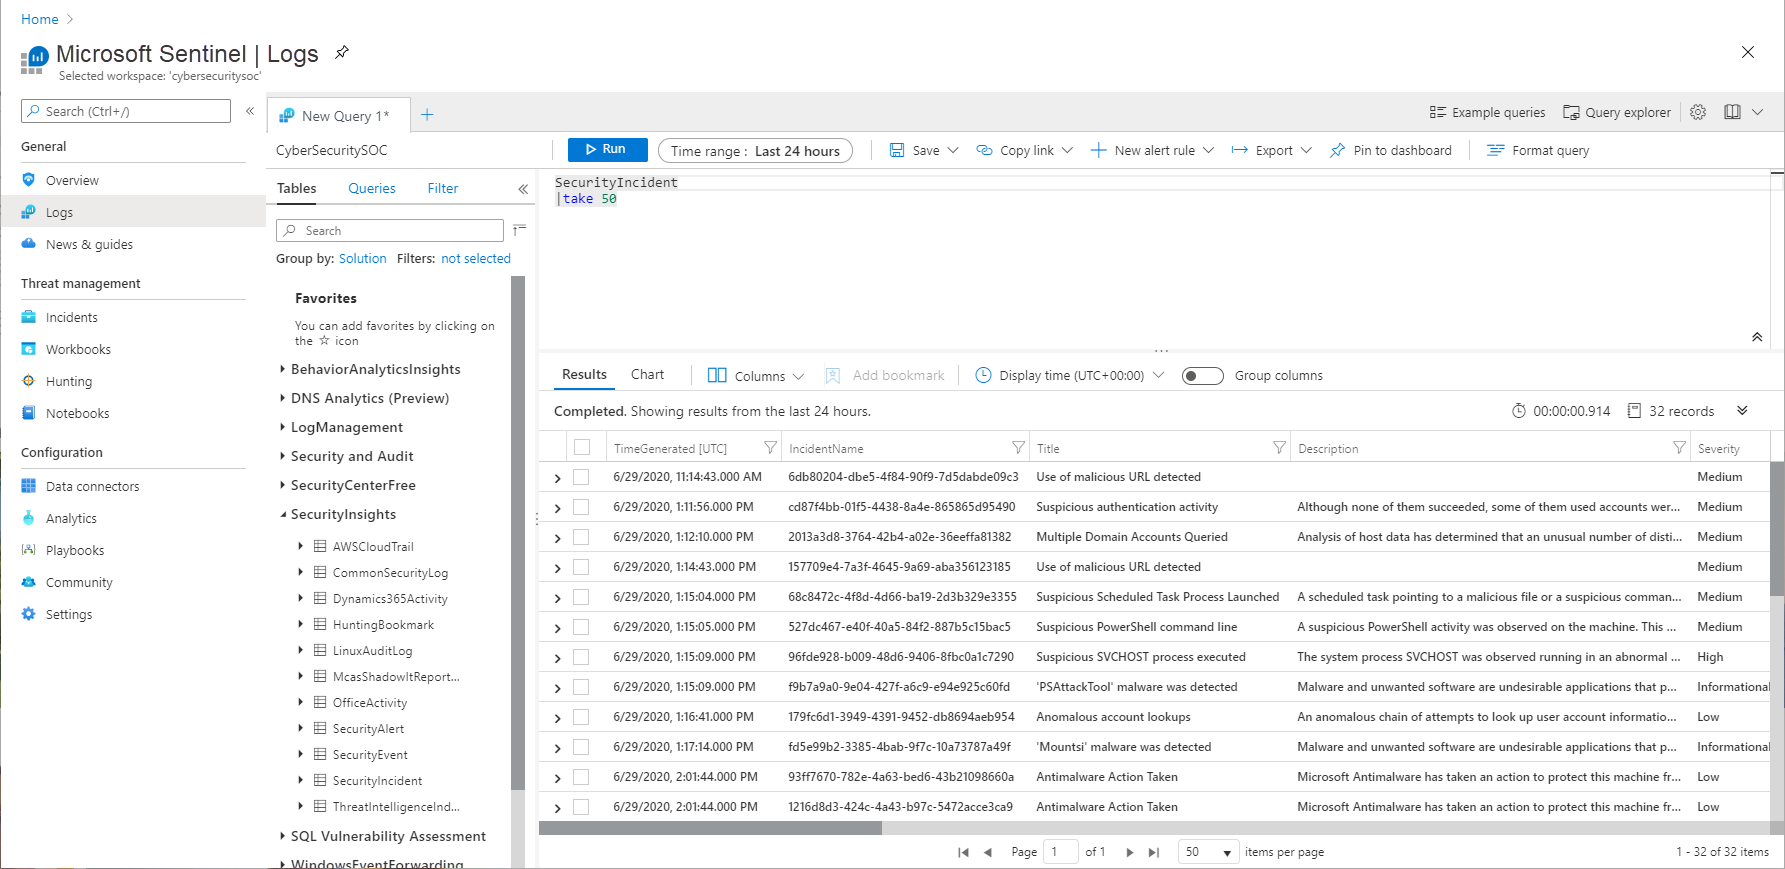
Every time you create or update an incident, a new log entry will be added to the table. This allows you to track the changes made to incidents, and allows for even more powerful SOC metrics, but you need to be mindful of this when constructing queries for this table as you may need to remove duplicate entries for an incident (dependent on the exact query you are running).
For example, if you wanted to return a list of all incidents sorted by their incident number but only wanted to return the most recent log per incident, you could do this using the KQL summarize operator with the arg_max() aggregation function:
SecurityIncident
| summarize arg_max(LastModifiedTime, *) by IncidentNumber
More sample queries
Incident state - all incidents by status and severity in a given time frame:
let startTime = ago(14d);
let endTime = now();
SecurityIncident
| where TimeGenerated >= startTime
| summarize arg_max(TimeGenerated, *) by IncidentNumber
| where LastModifiedTime  between (startTime .. endTime)
| where Status in  ('New', 'Active', 'Closed')
| where Severity in ('High','Medium','Low', 'Informational')
Closure time by percentile:
SecurityIncident
| summarize arg_max(TimeGenerated,*) by IncidentNumber
| extend TimeToClosure =  (ClosedTime - CreatedTime)/1h
| summarize 5th_Percentile=percentile(TimeToClosure, 5),50th_Percentile=percentile(TimeToClosure, 50),
  90th_Percentile=percentile(TimeToClosure, 90),99th_Percentile=percentile(TimeToClosure, 99)
Triage time by percentile:
SecurityIncident
| summarize arg_max(TimeGenerated,*) by IncidentNumber
| extend TimeToTriage =  (FirstModifiedTime - CreatedTime)/1h
| summarize 5th_Percentile=max_of(percentile(TimeToTriage, 5),0),50th_Percentile=percentile(TimeToTriage, 50),
  90th_Percentile=percentile(TimeToTriage, 90),99th_Percentile=percentile(TimeToTriage, 99)
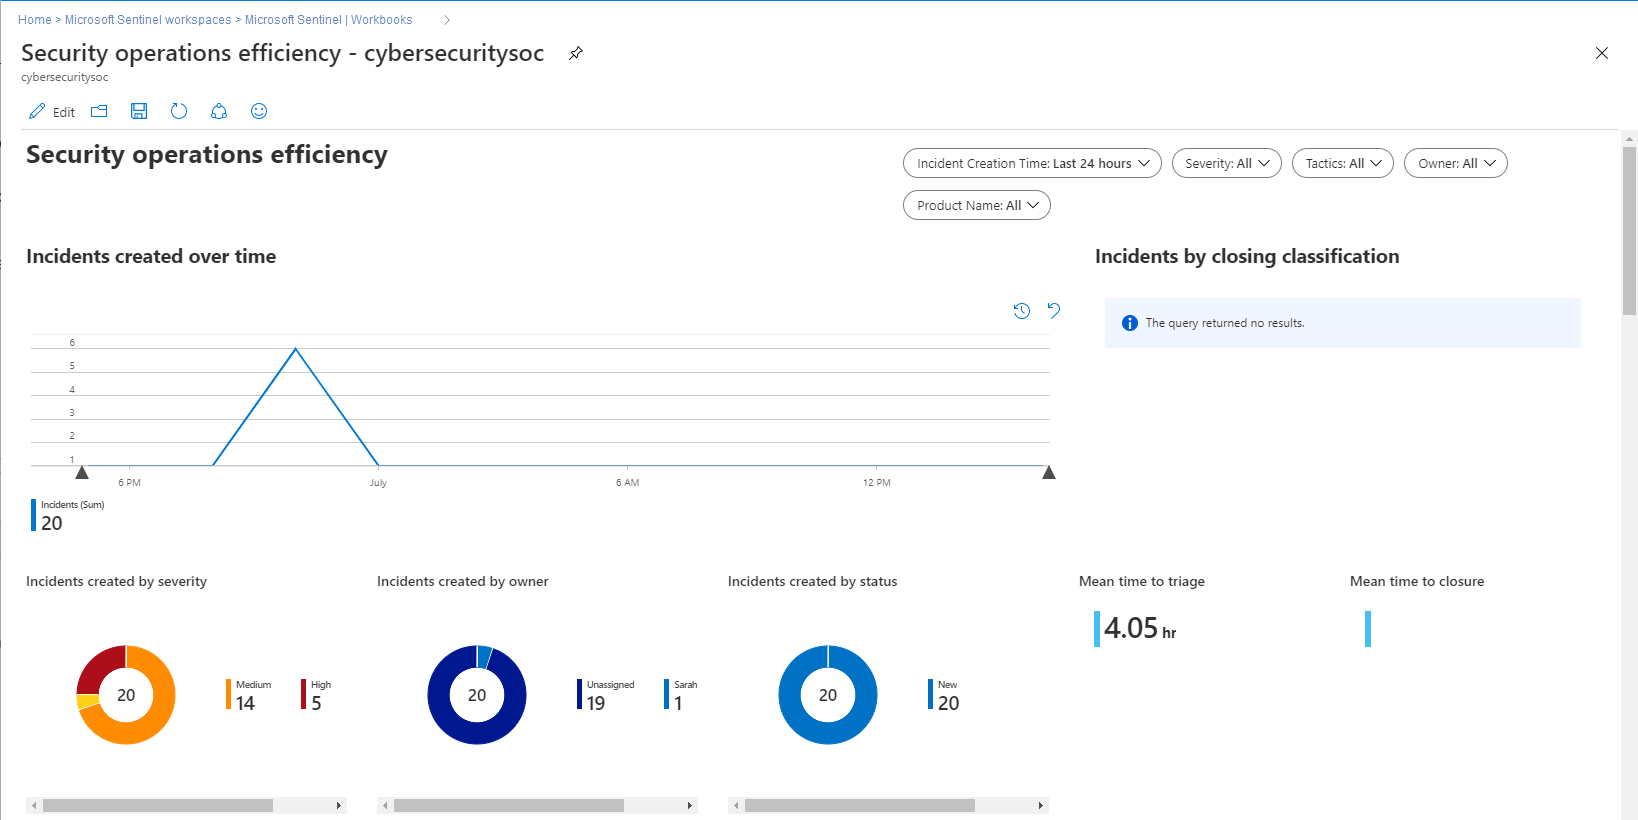
Security operations efficiency workbook
To complement the SecurityIncidents table, we’ve provided you with an out-of-the-box security operations efficiency workbook template that you can use to monitor your SOC operations. The workbook contains the following metrics:
- Incident created over time
- Incidents created by closing classification, severity, owner, and status
- Mean time to triage
- Mean time to closure
- Incidents created by severity, owner, status, product, and tactics over time
- Time to triage percentiles
- Time to closure percentiles
- Mean time to triage per owner
- Recent activities
- Recent closing classifications
You can find this new workbook template by choosing Workbooks from the Microsoft Sentinel navigation menu and selecting the Templates tab. Choose Security operations efficiency from the gallery and click one of the View saved workbook and View template buttons.
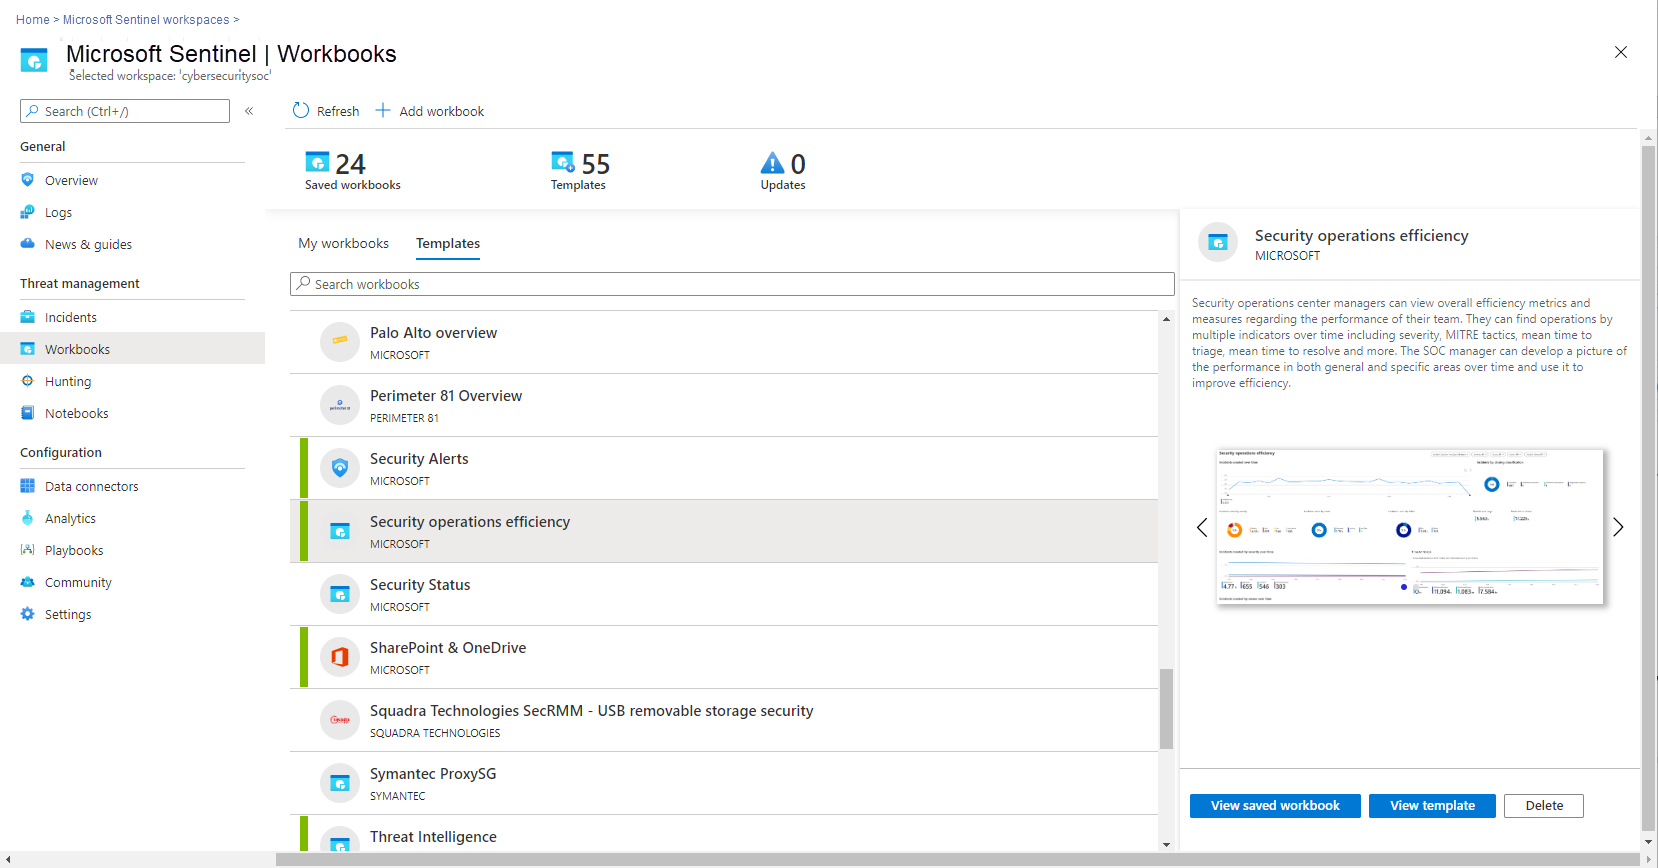
You can use the template to create your own custom workbooks tailored to your specific needs.
SecurityIncidents schema
The data model of the schema
| Field | Data type | Description |
|---|---|---|
| AdditionalData | dynamic | Alerts count, bookmarks count, comments count, alert products names and tactics |
| AlertIds | dynamic | Alerts from which incident was created |
| BookmarkIds | dynamic | Bookmarked entities |
| Classification | string | Incident closing classification |
| ClassificationComment | string | Incident closing classification comment |
| ClassificationReason | string | Incident closing classification reason |
| ClosedTime | datetime | Timestamp (UTC) of when the incident was last closed |
| Comments | dynamic | Incident comments |
| CreatedTime | datetime | Timestamp (UTC) of when the incident was created |
| Description | string | Incident description |
| FirstActivityTime | datetime | First event time |
| FirstModifiedTime | datetime | Timestamp (UTC) of when the incident was first modified |
| IncidentName | string | Internal GUID |
| IncidentNumber | int | |
| IncidentUrl | string | Link to incident |
| Labels | dynamic | Tags |
| LastActivityTime | datetime | Last event time |
| LastModifiedTime | datetime | Timestamp (UTC) of when the incident was last modified (the modification described by the current record) |
| ModifiedBy | string | User or system that modified the incident |
| Owner | dynamic | |
| RelatedAnalyticRuleIds | dynamic | Rules from which the incident's alerts were triggered |
| Severity | string | Severity of the incident (High/Medium/Low/Informational) |
| SourceSystem | string | Constant ('Azure') |
| Status | string | |
| TenantId | string | |
| TimeGenerated | datetime | Timestamp (UTC) of when the current record was created (upon modification of the incident) |
| Title | string | |
| Type | string | Constant ('SecurityIncident') |
Next steps
- To get started with Microsoft Sentinel, you need a subscription to Microsoft Azure. If you do not have a subscription, you can sign up for a free trial.
- Learn how to onboard your data to Microsoft Sentinel, and get visibility into your data, and potential threats.
Feedback
Coming soon: Throughout 2024 we will be phasing out GitHub Issues as the feedback mechanism for content and replacing it with a new feedback system. For more information see: https://aka.ms/ContentUserFeedback.
Submit and view feedback for