Create a Power BI report from Microsoft Sentinel data
Power BI is a reporting and analytics platform that turns data into coherent, immersive, interactive visualizations. Power BI lets you easily connect to data sources, visualize and discover relationships, and share insights with whoever you want.
You can base Power BI reports on data from Microsoft Sentinel Log Analytics workspaces, and share those reports with people who don't have access to Microsoft Sentinel. For example, you might want to share information about failed sign-in attempts with app owners, without granting them Microsoft Sentinel access. Power BI visualizations can provide the data at a glance.
In this article, you:
- Export a Log Analytics Kusto query to a Power BI M language query.
- Use the M query in Power BI Desktop to create visualizations and a report.
- Publish the report to the Power BI service, and share it with others.
- Add the report to a Teams channel.
People you granted access in the Power BI service, and members of the Teams channel, can see the report without needing Microsoft Sentinel permissions.
Note
This article provides a scenario-based procedure to view analysis reports in PowerBI for your Microsoft Sentinel data. For more information, see Connect data sources and Visualize collected data.
Prerequisites
To complete the steps in this article, you need:
- At least read access to a Microsoft Sentinel Log Analytics workspace that monitors sign-in attempts.
- A Power BI account that has read access to the Log Analytics workspace.
- Power BI Desktop installed from the Microsoft Store.
Export a query from Log Analytics
Create, run, and export a Kusto query in your Microsoft Sentinel Log Analytics workspace.
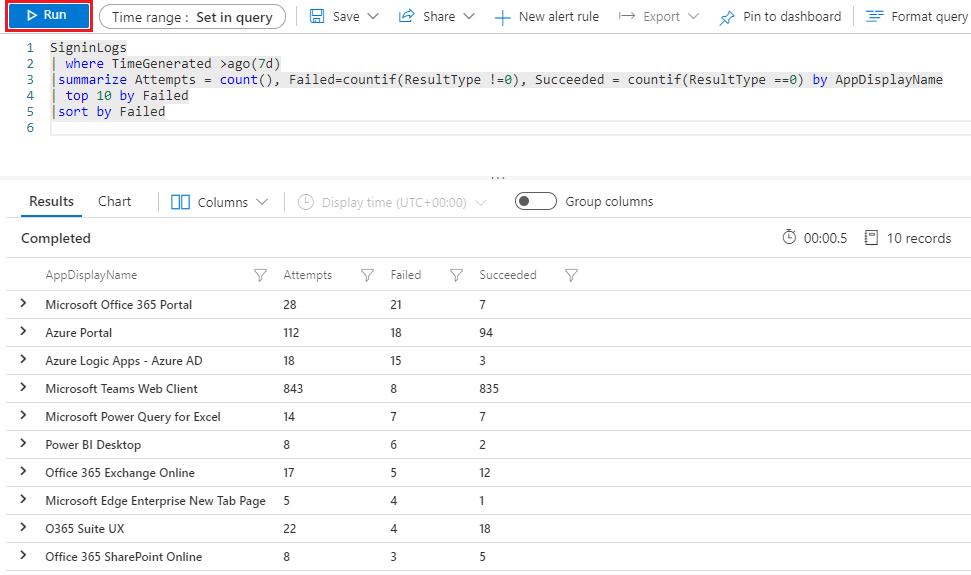
To create a simple query, in your Microsoft Sentinel Log Analytics workspace, select Logs. In the query editor under New Query 1, enter the following Kusto query:
SigninLogs
|  where TimeGenerated >ago(7d)
| summarize Attempts = count(), Failed=countif(ResultType !=0), Succeeded = countif(ResultType ==0) by AppDisplayName
|  top 10 by Failed
| sort by Failed
Or, use your favorite Microsoft Sentinel Log Analytics Kusto query.
Select Run to run the query and generate results.
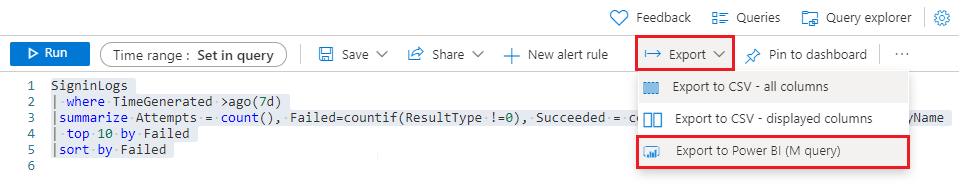
To export the query to Power BI M query format, select Export, and then select Export to Power BI (M query). Log Analytics exports the query to a text file called PowerBIQuery.txt.
Copy the contents of the exported file.
Get the data in Power BI Desktop
Run the exported M query in Power BI Desktop to get data.
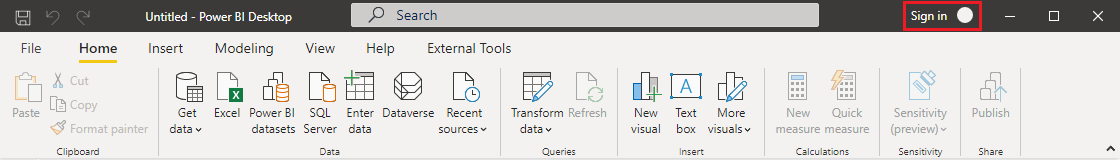
Open Power BI Desktop, and sign in to your Power BI account that has read access to the Log Analytics workspace.
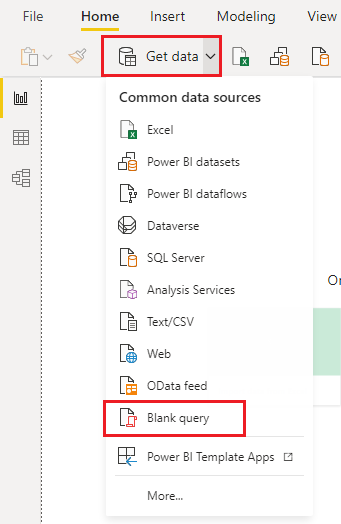
In the Power BI ribbon, select Get data and then select Blank query. The Power Query Editor opens.
In the Power Query Editor, select Advanced Editor.
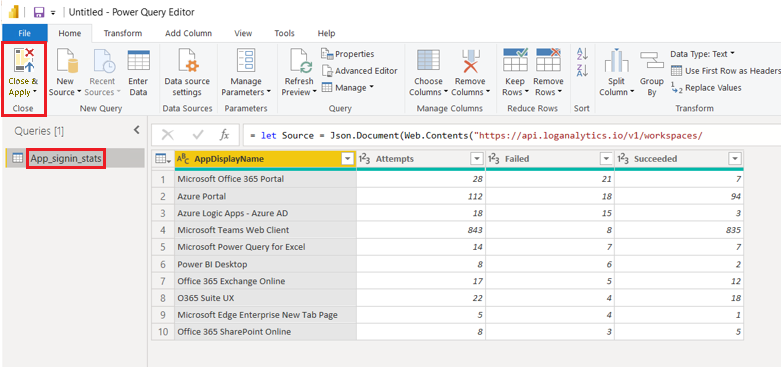
Paste the copied contents of the exported PowerBIQuery.txt file into the Advanced Editor window, and then select Done.

In the Power Query Editor, rename the query to App_signin_stats, and then select Close & Apply.
Create visualizations from the data
Now that your data is in Power BI, you can create visualizations to provide insights into the data.
Create a table visual
First, create a table that shows all the results of the query.
To add a table visualization to the Power BI Desktop canvas, select the table icon under Visualizations.
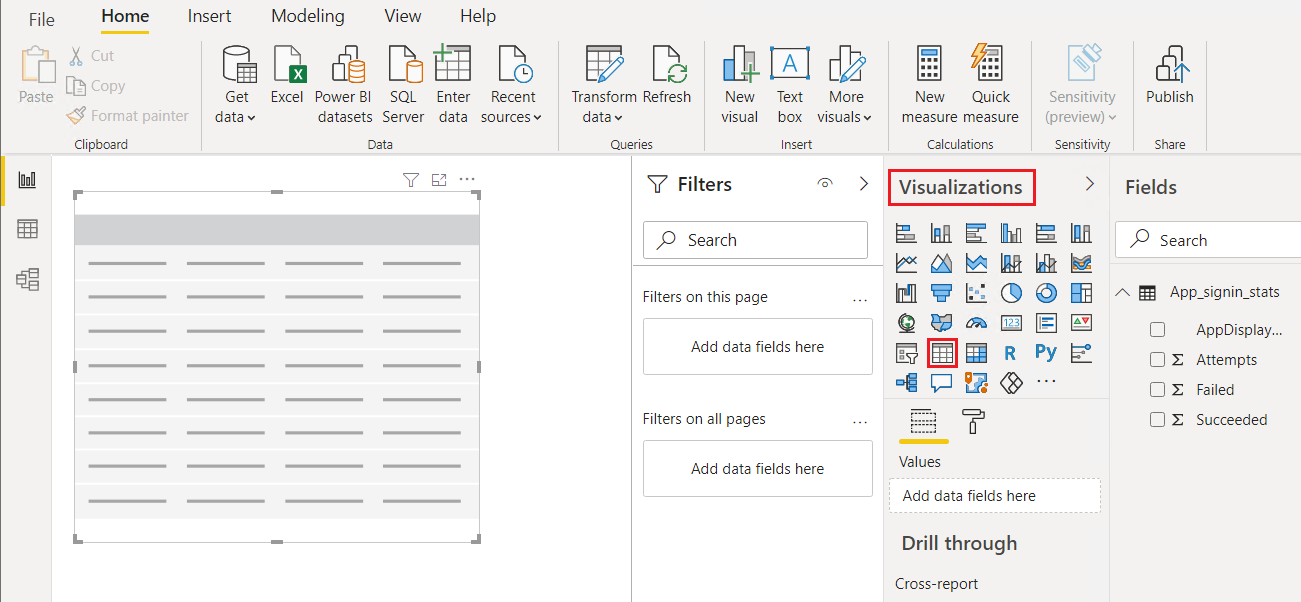
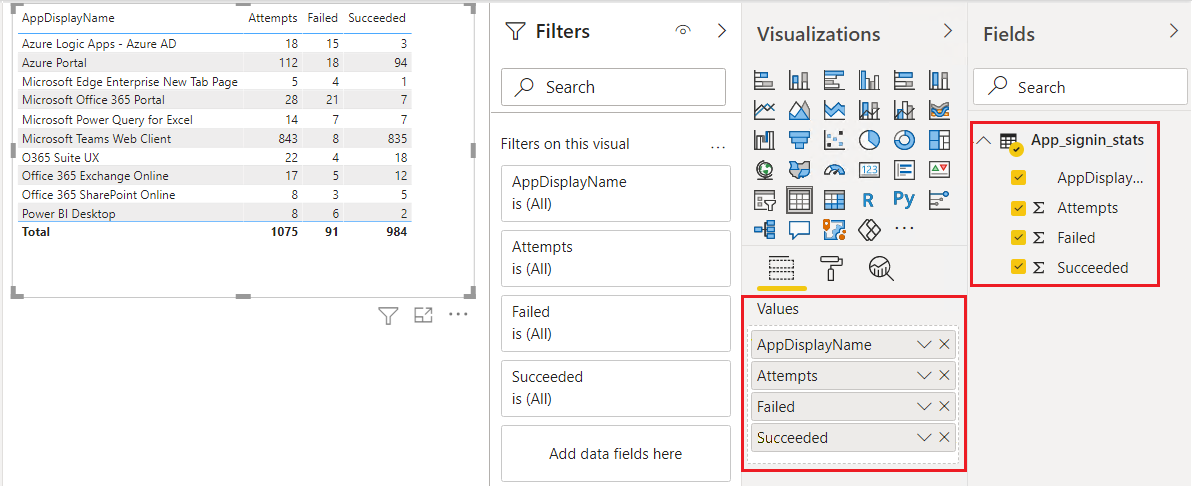
Under Fields, select all the fields in your query, so they all appear in the table. If the table doesn't show all the data, enlarge the table by dragging its selection handles.
Create a pie chart
Next, create a pie chart that shows which applications had the most failed sign-in attempts.
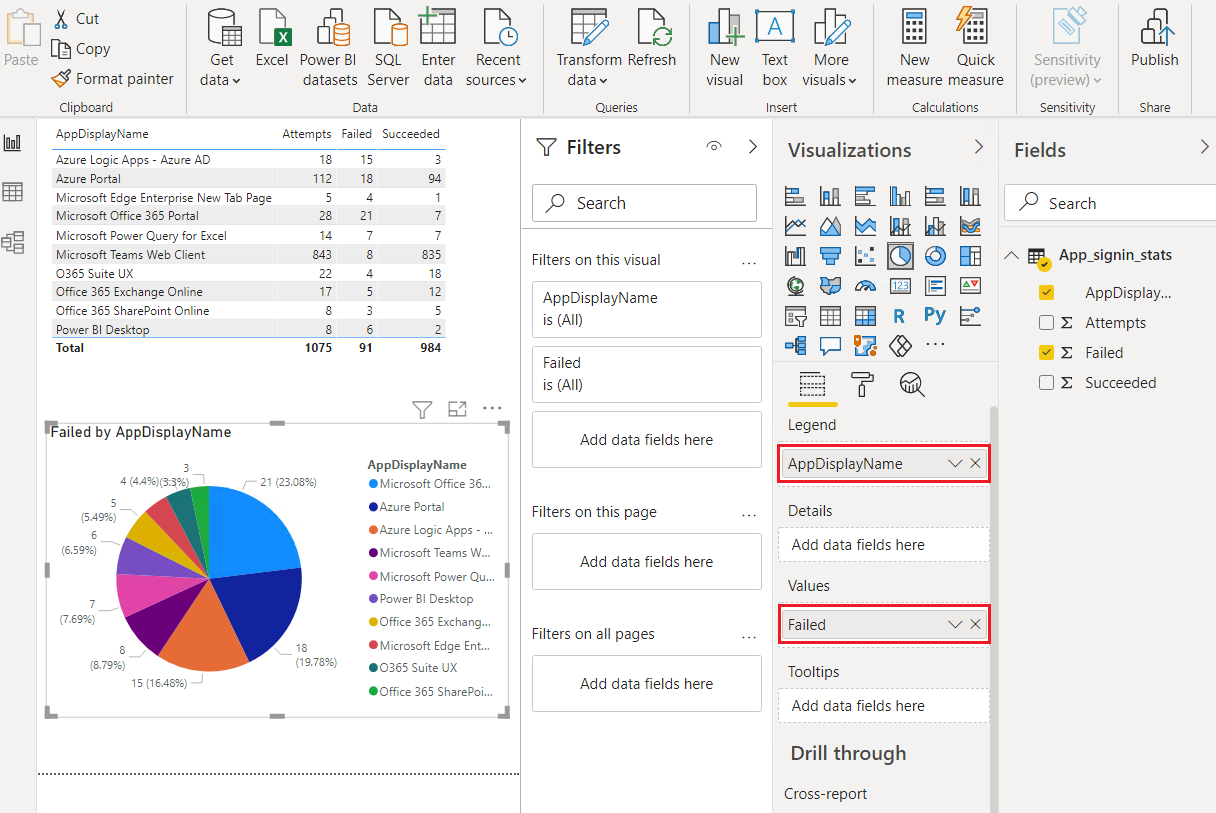
Deselect the table visual by clicking or tapping outside of it, and then under Visualizations, select the pie chart icon.
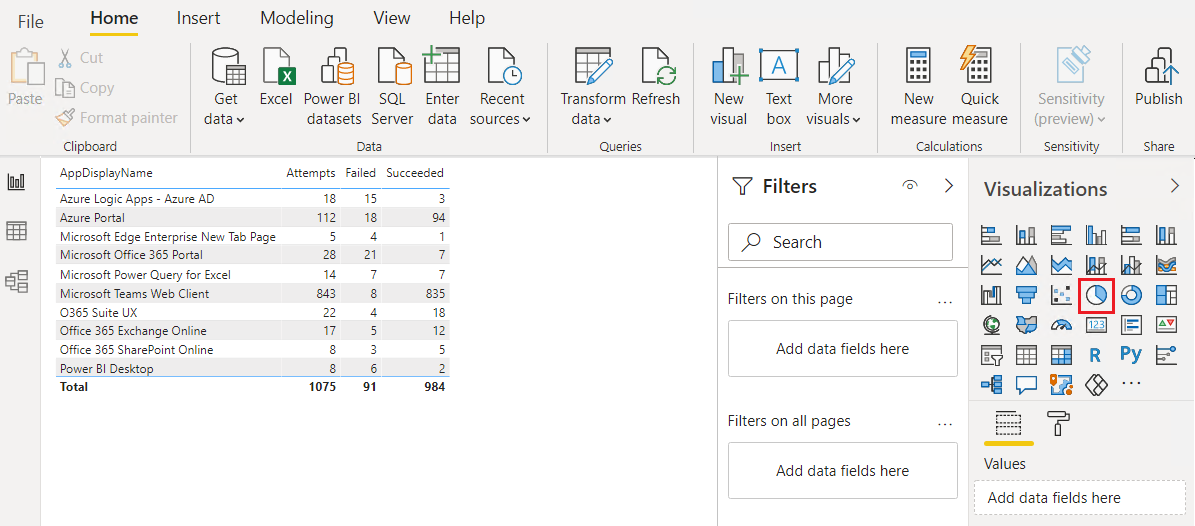
Select AppDisplayName in the Legend well, or drag it from the Fields pane. Select Failed in the Values well, or drag it from Fields. The pie chart now shows the number of failed sign-in attempts per application.
Create a new quick measure
You also want to show what percentage of sign-in attempts failed for each application. Since your query doesn't have a percentage column, you can create a new measure to show this information.
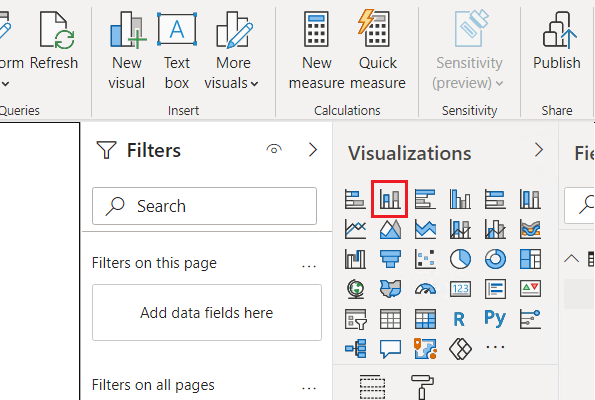
Under Visualizations, select the stacked column chart icon to create a stacked column chart.
With the new visualization selected, select Quick measure in the ribbon.
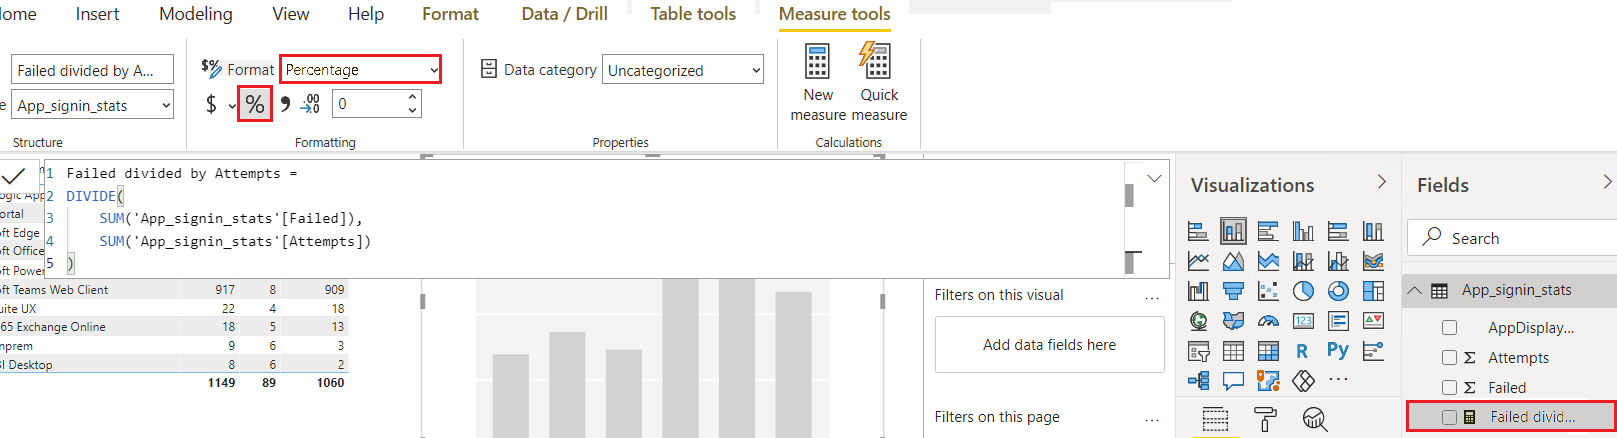
In the Quick measures window, under Calculation, select Division. Drag Failed from Fields into the Numerator field, and drag Attempts from Fields to Denominator.

Select OK. The new measure appears in the Fields pane.
Select the new measure in the Fields pane, and under Formatting in the ribbon, select Percentage.
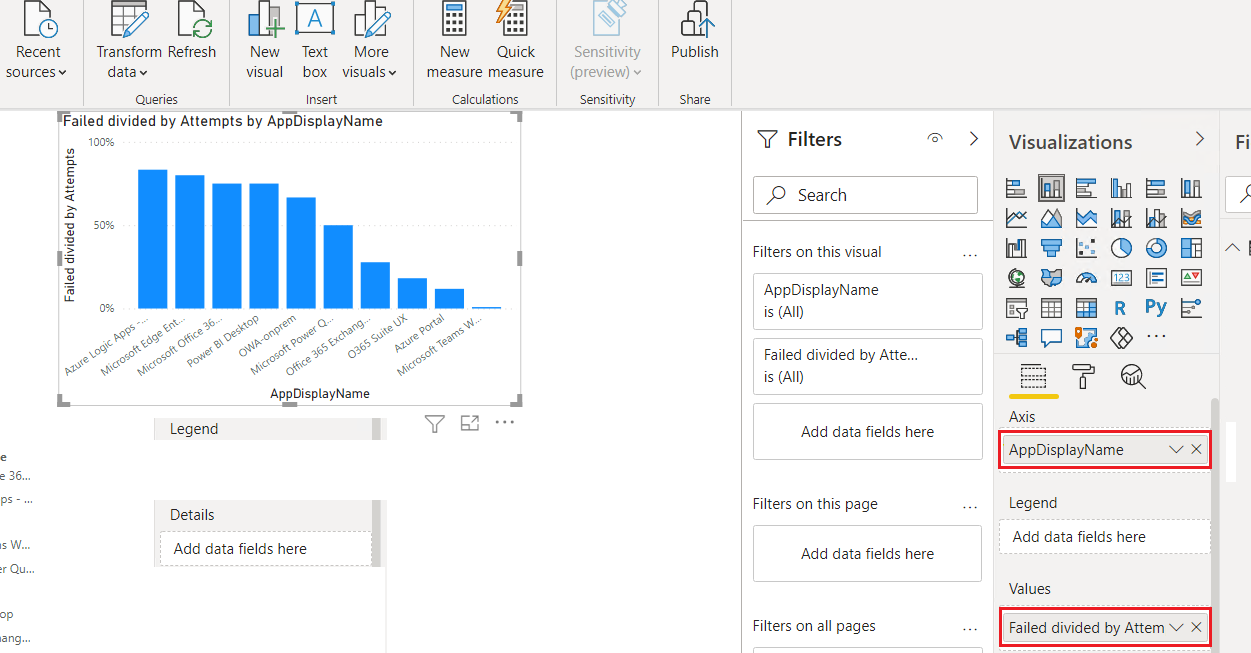
With the column chart visualization selected on the canvas, select or drag the AppDisplayName field into the Axis well, and the new Failed divided by Attempts measure into the Values well. The chart now shows the percentage of failed sign-in attempts for each application.
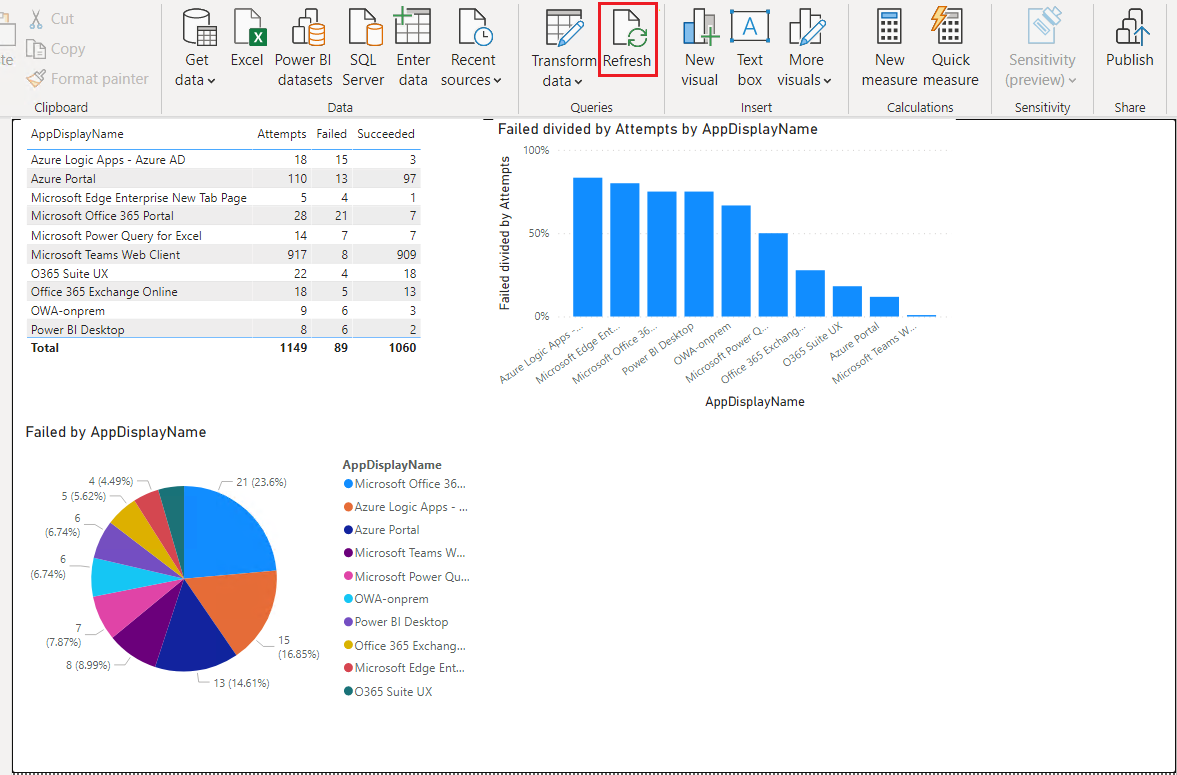
Refresh the data and save the report
Select Refresh to get the latest data from Microsoft Sentinel.
Select File > Save and save your Power BI report.
Create a Power BI online workspace
To create a Power BI workspace for sharing the report:
Sign in to powerbi.com with the same account you used for Power BI Desktop and Microsoft Sentinel read access.
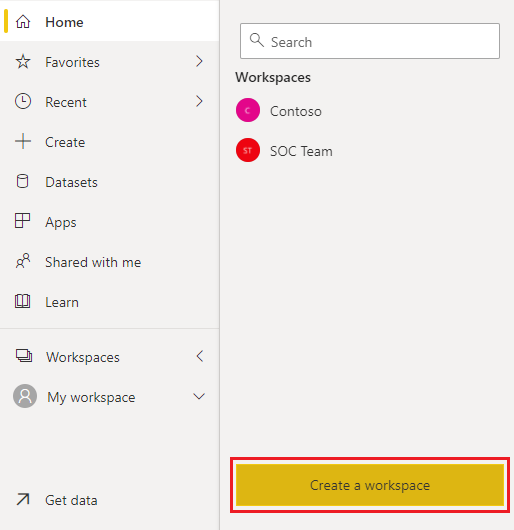
Under Workspaces, select Create a workspace. Name the workspace Management Reports, and select Save.
To grant people and groups access to the workspace, select the More options dots next to the new workspace name, and then select Workspace access.
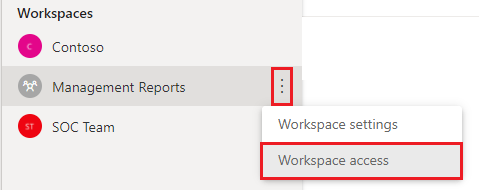
In the Workspace access side pane, you can add users' email addresses and assign each user a role. The roles are Admin, Member, Contributor, and Viewer.
Publish the Power BI report
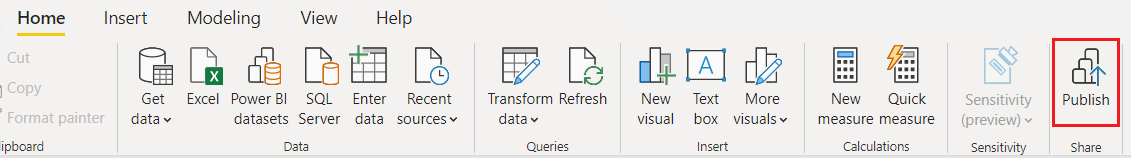
Now you can use Power BI Desktop to publish your Power BI report so other people can see it.
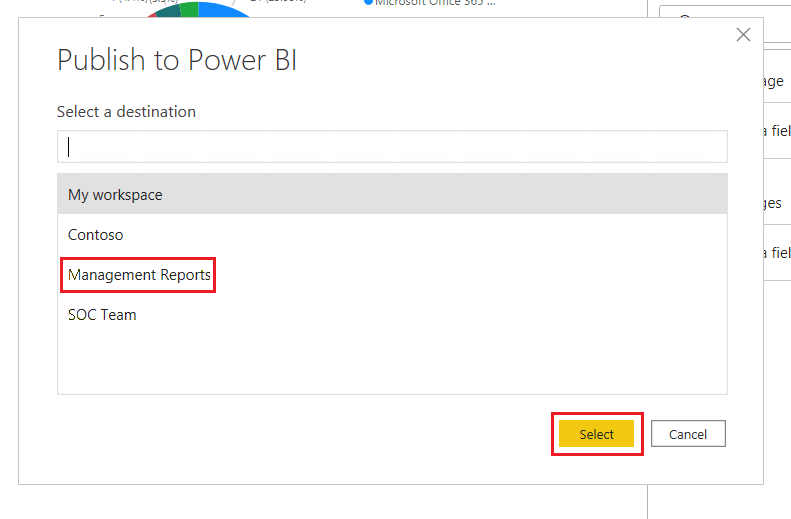
In your new report in Power BI Desktop, select Publish.
Select the Management Reports workspace to publish to, and select Select.
Import the report to a Microsoft Teams channel
You also want members of the Management Teams channel to be able to see the report. To add the report to a Teams channel:
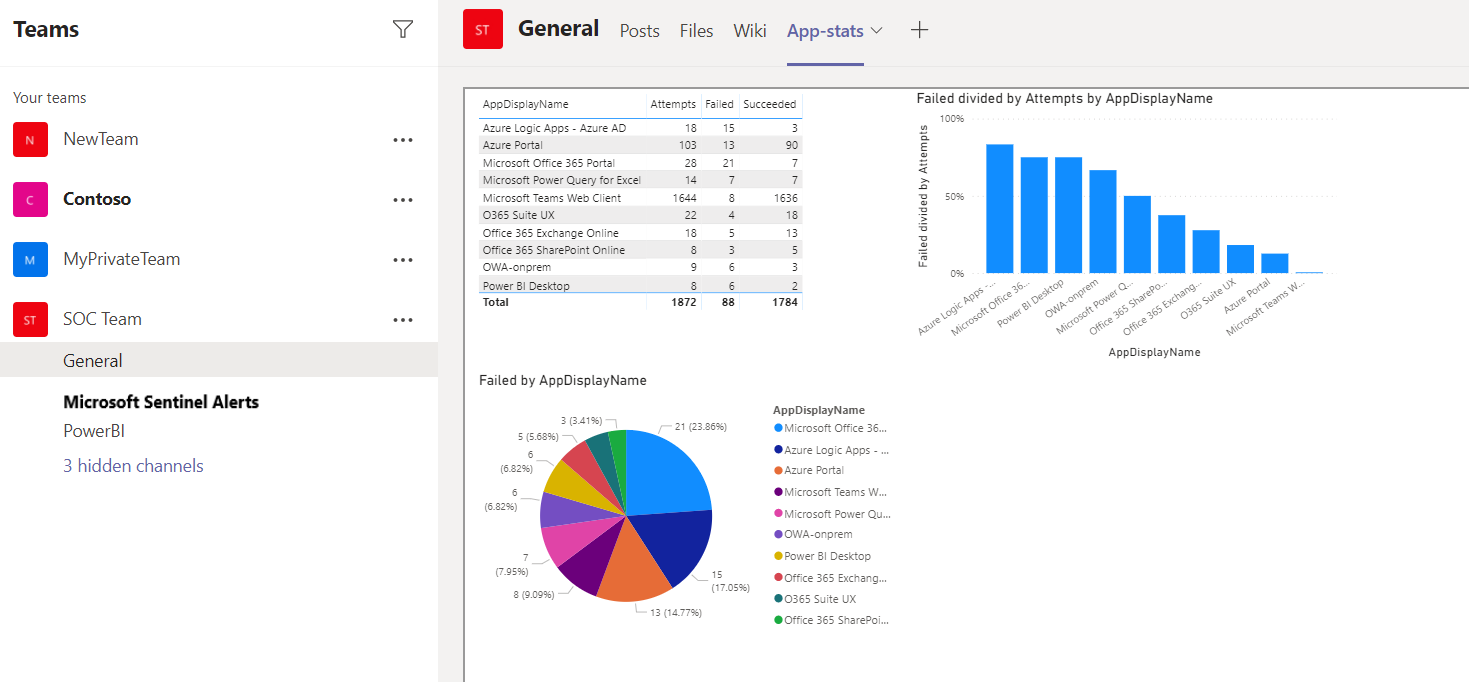
In the Management Teams channel, select + to add a tab, and in the Add a tab window, search for and select Power BI.

Select your new report from the list of Power BI reports, and select Save. The report appears in a new tab in the Teams channel.
Schedule report refresh
Refresh your Power BI report on a schedule, so updated data always appears in the report.
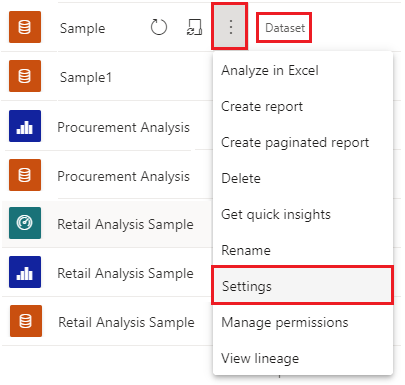
In the Power BI service, select the workspace you published your report to.
Next to the report's dataset, select More options > Settings.
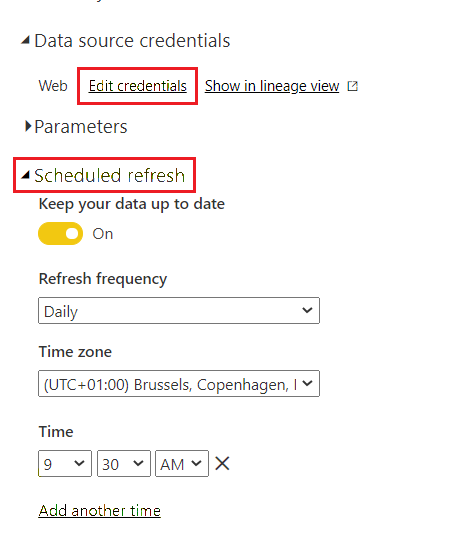
Select Edit credentials to provide the credentials for an account that has read access to the Log Analytics workspace.
Under Scheduled refresh, set the slider to On, and set up a refresh schedule for the report.
Next steps
For more information, see:
Feedback
Coming soon: Throughout 2024 we will be phasing out GitHub Issues as the feedback mechanism for content and replacing it with a new feedback system. For more information see: https://aka.ms/ContentUserFeedback.
Submit and view feedback for