Visualization and reporting for Teradata migrations
This article is part four of a seven-part series that provides guidance on how to migrate from Teradata to Azure Synapse Analytics. The focus of this article is best practices for visualization and reporting.
Access Azure Synapse Analytics using Microsoft and third-party BI tools
Organizations access data warehouses and data marts using a range of business intelligence (BI) tools and applications. Some examples of BI products are:
Microsoft BI tools, such as Power BI.
Office applications, such as Microsoft Excel spreadsheets.
Third-party BI tools from different vendors.
Custom analytics applications with embedded BI tool functionality.
Operational applications that support on-demand BI by running queries and reports on a BI platform that in turn queries data in a data warehouse or data mart.
Interactive data science development tools, such as Azure Synapse Spark Notebooks, Azure Machine Learning, RStudio, and Jupyter Notebooks.
If you migrate visualization and reporting as part of your data warehouse migration, all existing queries, reports, and dashboards generated by BI products need to run in the new environment. Your BI products must yield the same results on Azure Synapse as they did in your legacy data warehouse environment.
For consistent results after migration, all BI tools and application dependencies must work after you've migrated your data warehouse schema and data to Azure Synapse. The dependencies include less visible aspects, such as access and security. When you address access and security, ensure that you migrate:
Authentication so users can sign into the data warehouse and data mart databases on Azure Synapse.
All users to Azure Synapse.
All user groups to Azure Synapse.
All roles to Azure Synapse.
All authorization privileges governing access control to Azure Synapse.
User, role, and privilege assignments to mirror what you had in your existing data warehouse before migration. For example:
- Database object privileges assigned to roles
- Roles assigned to user groups
- Users assigned to user groups and/or roles
Access and security are important considerations for data access in the migrated system and are discussed in more detail in Security, access, and operations for Teradata migrations.
Tip
Existing users, user groups, roles, and assignments of access security privileges need to be migrated first for migration of reports and visualizations to succeed.
Migrate all required data to ensure that the reports and dashboards that query data in the legacy environment produce the same results in Azure Synapse.
Business users will expect a seamless migration, with no surprises that destroy their confidence in the migrated system on Azure Synapse. Take care to allay any fears that your users might have through good communication. Your users will expect that:
Table structure remains the same when directly referred to in queries.
Table and column names remain the same when directly referred to in queries. For instance, calculated fields defined on columns in BI tools shouldn't fail when aggregate reports are produced.
Historical analysis remains the same.
Data types remain the same, if possible.
Query behavior remains the same.
ODBC/JDBC drivers are tested to ensure that query behavior remains the same.
Tip
Communication and business user involvement are critical to success.
If BI tools query views in the underlying data warehouse or data mart database, will those views still work after the migration? Some views might not work if there are proprietary SQL extensions specific to your legacy data warehouse DBMS that have no equivalent in Azure Synapse. If so, you need to know about those incompatibilities and find a way to resolve them.
Tip
Views and SQL queries using proprietary SQL query extensions are likely to result in incompatibilities that impact BI reports and dashboards.
Other issues, like the behavior of NULL values or data type variations across DBMS platforms, need to be tested to ensure that even slight differences don't exist in calculation results. Minimize those issues and take all necessary steps to shield business users from being affected by them. Depending on your legacy data warehouse environment, third-party tools that can help hide the differences between the legacy and new environments so that BI tools and applications run unchanged.
Testing is critical to visualization and report migration. You need a test suite and agreed-on test data to run and rerun tests in both environments. A test harness is also useful, and a few are mentioned in this guide. Also, it's important to involve business users in the testing aspect of the migration to keep confidence high and to keep them engaged and part of the project.
Tip
Use repeatable tests to ensure reports, dashboards, and other visualizations migrate successfully.
You might be thinking about switching BI tools, for example to migrate to Power BI. The temptation is to make such changes at the same time you're migrating your schema, data, ETL processing, and more. However, to minimize risk, it's better to migrate to Azure Synapse first and get everything working before undertaking further modernization.
If your existing BI tools run on-premises, ensure they can connect to Azure Synapse through your firewall so you're able to run comparisons against both environments. Alternatively, if the vendor of your existing BI tools offers their product on Azure, you can try it there. The same applies for applications running on-premises that embed BI or call your BI server on demand, for example by requesting a "headless report" with XML or JSON data.
There's a lot to think about here, so let's take a closer look.
Use data virtualization to minimize the impact of migration on BI tools and reports
During migration, you might be tempted to fulfill long-term requirements like opening business requests, adding missing data, or implementing new features. However, such changes can affect BI tool access to your data warehouse, especially if the change involves structural changes to your data model. If you want to adopt an agile data modeling technique or implement structural changes, do so after migration.
One way to minimize the effect of schema changes or other structural changes on your BI tools is to introduce data virtualization between the BI tools and your data warehouse and data marts. The following diagram shows how data virtualization can hide a migration from users.
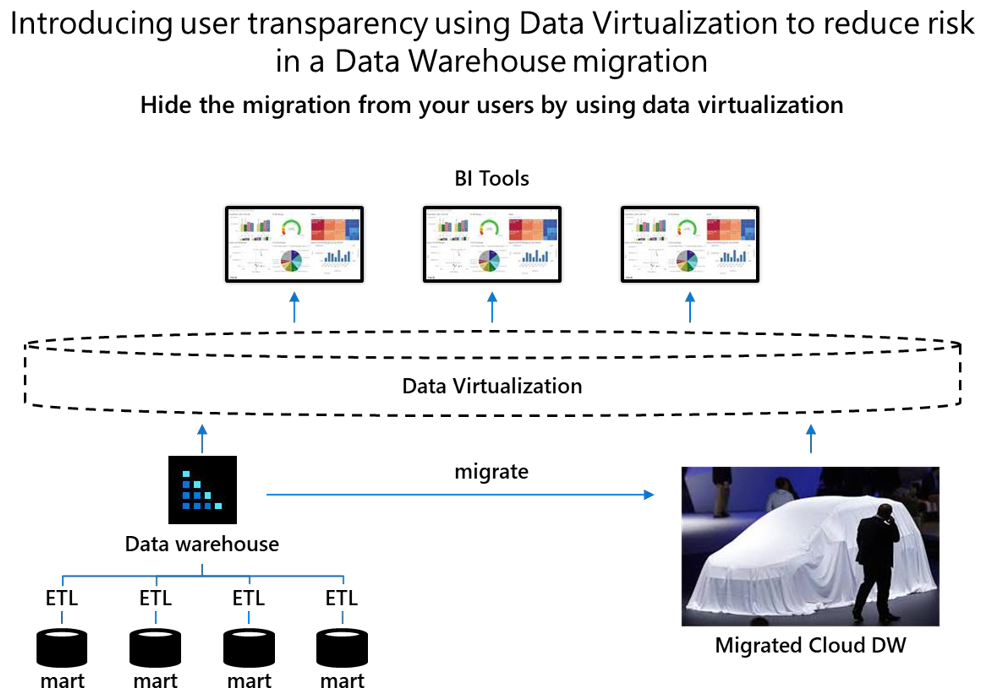
Data virtualization breaks the dependency between business users utilizing self-service BI tools and the physical schema of the underlying data warehouse and data marts that are being migrated.
Tip
Data virtualization allows you to shield business users from structural changes during migration so they remain unaware of those changes. Structural changes include schema alterations that tune your data model for Azure Synapse.
With data virtualization, any schema alterations made during a migration to Azure Synapse, for example to optimize performance, can be hidden from business users because they only have access to virtual tables in the data virtualization layer. And, if you make structural changes, you only need to update the mappings between the data warehouse or data marts and any virtual tables. With data virtualization, users remain unaware of structural changes. Microsoft partners provide data virtualization software.
Identify high-priority reports to migrate first
A key question when migrating your existing reports and dashboards to Azure Synapse is which ones to migrate first. Several factors might drive that decision, such as:
Usage
Business value
Ease of migration
Data migration strategy
The following sections discuss these factors.
Whatever your decision, it must involve your business users because they produce the reports, dashboards, and other visualizations, and make business decisions based on insights from those items. Everyone benefits when you can:
- Migrate reports and dashboards seamlessly,
- Migrate reports and dashboards with minimal effort, and
- Point your BI tool(s) at Azure Synapse instead of your legacy data warehouse system, and get like-for-like reports, dashboards, and other visualizations.
Migrate reports based on usage
Usage is often an indicator of business value. Unused reports and dashboards clearly don't contribute to business decisions or offer current value. If you don't have a way to find out which reports and dashboards are unused, you can use one of the several BI tools that provide usage statistics.
If your legacy data warehouse has been up and running for years, there's a good chance you have hundreds, if not thousands, of reports in existence. It's worth compiling an inventory of reports and dashboards and identifying their business purpose and usage statistics.
For unused reports, determine whether to decommission them to reduce your migration effort. A key question when deciding whether to decommission an unused report is whether the report is unused because people don't know it exists, because it offers no business value, or because it's been superseded by another report.
Migrate reports based on business value
Usage alone isn't always a good indicator of business value. You might want to consider the extent to which a report's insights contribute to business value. One way to do that is to evaluate the profitability of every business decision that relies on the report and the extent of the reliance. However, that information is unlikely to be readily available in most organizations.
Another way to evaluate business value is to look at the alignment of a report with business strategy. The business strategy set by your executive typically lays out strategic business objectives (SBOs), key performance indicators (KPIs), KPI targets that need to be achieved, and who is accountable for achieving them. You can classify a report by which SBOs the report contributes to, such as fraud reduction, improved customer engagement, and optimized business operations. Then, you can prioritize for migration the reports and dashboards that are associated with high-priority objectives. In this way, the initial migration can deliver business value in a strategic area.
Another way to evaluate business value is to classify reports and dashboards as operational, tactical, or strategic to identify at which business level they're used. SBOs require contributions at all these levels. By knowing which reports and dashboards are used, at what level, and what objectives they're associated with, you're able to focus the initial migration on high-priority business value. You can use the following business strategy objective table to evaluate reports and dashboards.
| Level | Report / dashboard name | Business purpose | Department used | Usage frequency | Business priority |
|---|---|---|---|---|---|
| Strategic | |||||
| Tactical | |||||
| Operational |
Metadata discovery tools like Azure Data Catalog let business users tag and rate data sources to enrich the metadata for those data sources to assist with their discovery and classification. You can use the metadata for a report or dashboard to help you understand its business value. Without such tools, understanding the contribution of reports and dashboards to business value is likely to be a time-consuming task, whether you're migrating or not.
Migrate reports based on data migration strategy
If your migration strategy is based on migrating data marts first, then the order of data mart migration will affect which reports and dashboards are migrated first. If your strategy is based on business value, the order in which you migrate data marts to Azure Synapse will reflect business priorities. Metadata discovery tools can help you implement your strategy by showing you which data mart tables supply data for which reports.
Tip
Your data migration strategy affects which reports and visualizations get migrated first.
Migration incompatibility issues that can affect reports and visualizations
BI tools produce reports, dashboards, and other visualizations by issuing SQL queries that access physical tables and/or views in your data warehouse or data mart. When you migrate your legacy data warehouse to Azure Synapse, several factors can affect the ease of migration of reports, dashboards, and other visualizations. Those factors include:
Schema incompatibilities between the environments.
SQL incompatibilities between the environments.
Schema incompatibilities
During a migration, schema incompatibilities in the data warehouse or data mart tables that supply data for reports, dashboards, and other visualizations can be:
Non-standard table types in your legacy data warehouse DBMS that don't have an equivalent in Azure Synapse.
Data types in your legacy data warehouse DBMS that don't have an equivalent in Azure Synapse.
In most cases, there's a workaround to the incompatibilities. For example, you can migrate the data in an unsupported table type into a standard table with appropriate data types and indexed or partitioned on a date/time column. Similarly, it might be possible to represent unsupported data types in another type of column and perform calculations in Azure Synapse to achieve the same results.
Tip
Schema incompatibilities include legacy warehouse DBMS table types and data types that are unsupported on Azure Synapse.
To identify the reports affected by schema incompatibilities, run queries against the system catalog of your legacy data warehouse to identify the tables with unsupported data types. Then, you can use metadata from your BI tool to identify the reports that access data in those tables. For more information about how to identify object type incompatibilities, see Unsupported Teradata database object types.
Tip
Query the system catalog of your legacy warehouse DBMS to identify schema incompatibilities with Azure Synapse.
The effect of schema incompatibilities on reports, dashboards, and other visualizations might be less than you think because many BI tools don't support the less generic data types. As a result, your legacy data warehouse might already have views that CAST unsupported data types to more generic types.
SQL incompatibilities
During a migration, SQL incompatibilities are likely to affect any report, dashboard, or other visualization in an application or tool that:
Accesses legacy data warehouse DBMS views that include proprietary SQL functions that have no equivalent in Azure Synapse.
Issues SQL queries that include proprietary SQL functions, specific to the SQL dialect of your legacy environment, that have no equivalent in Azure Synapse.
Gauge the impact of SQL incompatibilities on your reporting portfolio
Your reporting portfolio might include embedded query services, reports, dashboards, and other visualizations. Don't rely on the documentation associated with those items to gauge the effect of SQL incompatibilities on the migration of your reporting portfolio to Azure Synapse. You need to use a more precise way to assess the effect of SQL incompatibilities.
Use EXPLAIN statements to find SQL incompatibilities
You can find SQL incompatibilities by reviewing the logs of recent SQL activity in your legacy Teradata data warehouse. Use a script to extract a representative set of SQL statements to a file. Then, prefix each SQL statement with an EXPLAIN statement, and run those EXPLAIN statements in Azure Synapse. Any SQL statements containing proprietary unsupported SQL extensions will be rejected by Azure Synapse when the EXPLAIN statements are executed. This approach lets you assess the extent of SQL incompatibilities.
Metadata from your legacy data warehouse DBMS can also help you identify incompatible views. As before, capture a representative set of SQL statements from the applicable logs, prefix each SQL statement with an EXPLAIN statement, and run those EXPLAIN statements in Azure Synapse to identify views with incompatible SQL.
Tip
Gauge the impact of SQL incompatibilities by harvesting your DBMS log files and running EXPLAIN statements.
Test report and dashboard migration to Azure Synapse Analytics
A key element of data warehouse migration is testing of reports and dashboards in Azure Synapse to verify the migration has worked. Define a series of tests and a set of required outcomes for each test that you will run to verify success. Test and compare the reports and dashboards across your existing and migrated data warehouse systems to:
Identify whether any schema changes that were made during migration affected the ability of reports to run, report results, or the corresponding report visualizations. An example of a schema change is if you mapped an incompatible data type to an equivalent data type that's supported in Azure Synapse.
Verify that all users are migrated.
Verify that all roles are migrated, and users are assigned to those roles.
Verify that all data access security privileges are migrated to ensure access control list (ACL) migration.
Ensure consistent results for all known queries, reports, and dashboards.
Ensure that data and ETL migration is complete and error-free.
Ensure that data privacy is upheld.
Test performance and scalability.
Test analytical functionality.
Tip
Test and tune performance to minimize compute costs.
For information about how to migrate users, user groups, roles, and privileges, see Security, access, and operations for Teradata migrations.
Automate testing as much as possible to make each test repeatable and to support a consistent approach to evaluating test results. Automation works well for known regular reports, and can be managed via Azure Synapse pipelines or Azure Data Factory orchestration. If you already have a suite of test queries in place for regression testing, you can use the existing testing tools to automate post migration testing.
Tip
Best practice is to build an automated test suite to make tests repeatable.
Ad-hoc analysis and reporting are more challenging and require compilation of a set of tests to verify that the same reports and dashboards from before and after migration are consistent. If you find inconsistencies, then your ability to compare metadata lineage across the original and migrated systems during migration testing becomes crucial. That comparison can highlight differences and pinpoint where inconsistencies originated, when detection by other means is difficult.
Tip
Leverage tools that compare metadata lineage to verify results.
Analyze lineage to understand dependencies between reports, dashboards, and data
Your understanding of lineage is a critical factor in the successful migration of reports and dashboards. Lineage is metadata that shows the journey of migrated data so you can track its path from a report or dashboard all the way back to the data source. Lineage shows how data has traveled from point to point, its location in the data warehouse and/or data mart, and which reports and dashboards use it. Lineage can help you understand what happens to data as it travels through different data stores, such as files and databases, different ETL pipelines, and into reports. When business users have access to data lineage, it improves trust, instills confidence, and supports informed business decisions.
Tip
Your ability to access metadata and data lineage from reports all the way back to a data source is critical for verifying that migrated reports work correctly.
In multi-vendor data warehouse environments, business analysts in BI teams might map out data lineage. For example, if you use different vendors for ETL, data warehouse, and reporting, and each vendor has its own metadata repository, then figuring out where a specific data element in a report came from can be challenging and time-consuming.
Tip
Tools that automate the collection of metadata and show end-to-end lineage in a multi-vendor environment are valuable during a migration.
To migrate seamlessly from a legacy data warehouse to Azure Synapse, use end-to-end data lineage to prove like-for-like migration when you're comparing the reports and dashboards generated by each environment. To show the end-to-end data journey, you'll need to capture and integrate metadata from several tools. Having access to tools that support automated metadata discovery and data lineage, helps you identify duplicate reports or ETL processes, and find reports that rely on obsolete, questionable, or non-existent data sources. You can use that information to reduce the number of reports and ETL processes that you migrate.
You can also compare the end-to-end lineage of a report in Azure Synapse to the end-to-end lineage of the same report in your legacy environment to check for differences that might have inadvertently occurred during migration. This type of comparison is exceptionally useful when you need to test and verify migration success.
Data lineage visualization not only reduces time, effort, and error in the migration process, but also enables faster migration.
By using automated metadata discovery and data lineage tools that compare lineage, you can verify that a report in Azure Synapse that's produced from migrated data is produced in the same way in your legacy environment. This capability also helps you determine:
What data needs to be migrated to ensure successful report and dashboard execution in Azure Synapse.
What transformations have been and should be performed to ensure successful execution in Azure Synapse.
How to reduce report duplication.
Automated metadata discovery and data lineage tools substantially simplify the migration process because they help businesses become more aware of their data assets and to know what needs to be migrated to Azure Synapse to achieve a solid reporting environment.
Several ETL tools provide end-to-end lineage capability, so check whether your existing ETL tool has that capability if you plan to use it with Azure Synapse. Azure Synapse pipelines or Data Factory both support the ability to view lineage in mapping flows. Microsoft partners also provide automated metadata discovery, data lineage, and lineage comparison tools.
Migrate BI tool semantic layers to Azure Synapse Analytics
Some BI tools have what is known as a semantic metadata layer. That layer simplifies business user access to the underlying physical data structures in a data warehouse or data mart database. The semantic metadata layer simplifies access by providing high-level objects like dimensions, measures, hierarchies, calculated metrics, and joins. The high-level objects use business terms that are familiar to business analysts, and map to physical data structures in your data warehouse or data mart.
Tip
Some BI tools have semantic layers that simplify business user access to physical data structures in your data warehouse or data mart.
In a data warehouse migration, changes to column names or table names may be forced upon you. For example, in Teradata, table names can have a "#". In Azure Synapse, the "#" is only allowed as a prefix to a table name to indicate a temporary table. In Teradata, TEMPORARY TABLES do not necessarily have a "#" in the name, but in Synapse they must. You may need to do some rework to change table mappings in such cases.
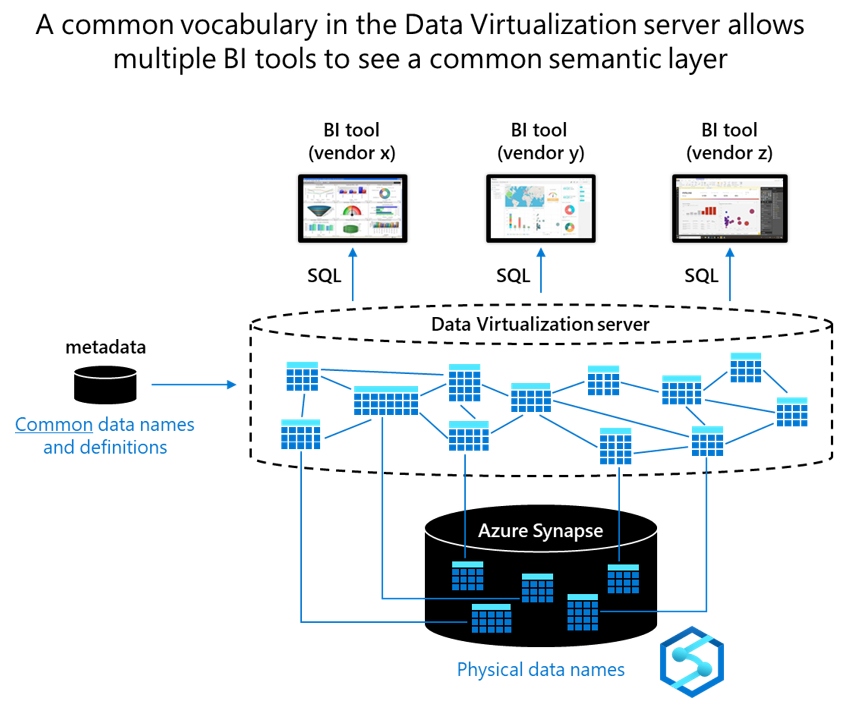
To achieve consistency across multiple BI tools, create a universal semantic layer by using a data virtualization server that sits between BI tools and applications and Azure Synapse. In the data virtualization server, use common data names for high-level objects like dimensions, measures, hierarchies, and joins. That way you configure everything, including calculated fields, joins, and mappings, only once instead of in every tool. Then, point all BI tools at the data virtualization server.
Tip
Use data virtualization to create a common semantic layer to guarantee consistency across all BI tools in an Azure Synapse environment.
With data virtualization, you get consistency across all BI tools and break the dependency between BI tools and applications and the underlying physical data structures in Azure Synapse. Microsoft partners can help you achieve consistency in Azure. The following diagram shows how a common vocabulary in the data virtualization server lets multiple BI tools see a common semantic layer.
Conclusions
In a lift and shift data warehouse migration, most reports, dashboards, and other visualizations should migrate easily.
During a migration from a legacy environment, you might find that data in the legacy data warehouse or data mart tables is stored in unsupported data types. Or, you may find legacy data warehouse views that include proprietary SQL with no equivalent in Azure Synapse. If so, you'll need to resolve those issues to ensure a successful migration to Azure Synapse.
Don't rely on user-maintained documentation to identify where issues are located. Instead, use EXPLAIN statements because they're a quick, pragmatic way to identify SQL incompatibilities. Rework the incompatible SQL statements to achieve equivalent functionality in Azure Synapse. Also, use automated metadata discovery and lineage tools to understand dependencies, find duplicate reports, and identify invalid reports that rely on obsolete, questionable, or non-existent data sources. Use lineage tools to compare lineage to verify that reports running in your legacy data warehouse environment are produced identically in Azure Synapse.
Don't migrate reports that you no longer use. BI tool usage data can help you determine which reports aren't in use. For the reports, dashboards, and other visualizations that you do want to migrate, migrate all users, user groups, roles, and privileges. If you're using business value to drive your report migration strategy, associate reports with strategic business objectives and priorities to help identify the contribution of report insights to specific objectives. If you're migrating data mart by data mart, use metadata to identify which reports are dependent on which tables and views, so you can make an informed decision about which data marts to migrate first.
Tip
Identify incompatibilities early to gauge the extent of the migration effort. Migrate your users, group roles, and privilege assignments. Only migrate the reports and visualizations that are used and are contributing to business value.
Structural changes to the data model of your data warehouse or data mart can occur during a migration. Consider using data virtualization to shield BI tools and applications from structural changes. With data virtualization, you can use a common vocabulary to define a common semantic layer. The common semantic layer guarantees consistent common data names, definitions, metrics, hierarchies, and joins across all BI tools and applications in the new Azure Synapse environment.
Next steps
To learn more about minimizing SQL issues, see the next article in this series: Minimizing SQL issues for Teradata migrations.
Feedback
Coming soon: Throughout 2024 we will be phasing out GitHub Issues as the feedback mechanism for content and replacing it with a new feedback system. For more information see: https://aka.ms/ContentUserFeedback.
Submit and view feedback for