Use Synapse Studio to monitor your Apache Spark applications
With Azure Synapse Analytics, you can use Apache Spark to run notebooks, jobs, and other kinds of applications on your Apache Spark pools in your workspace.
This article explains how to monitor your Apache Spark applications, allowing you to keep an eye on the latest status, issues, and progress.
View Apache Spark applications
You can view all Apache Spark applications from Monitor -> Apache Spark applications.
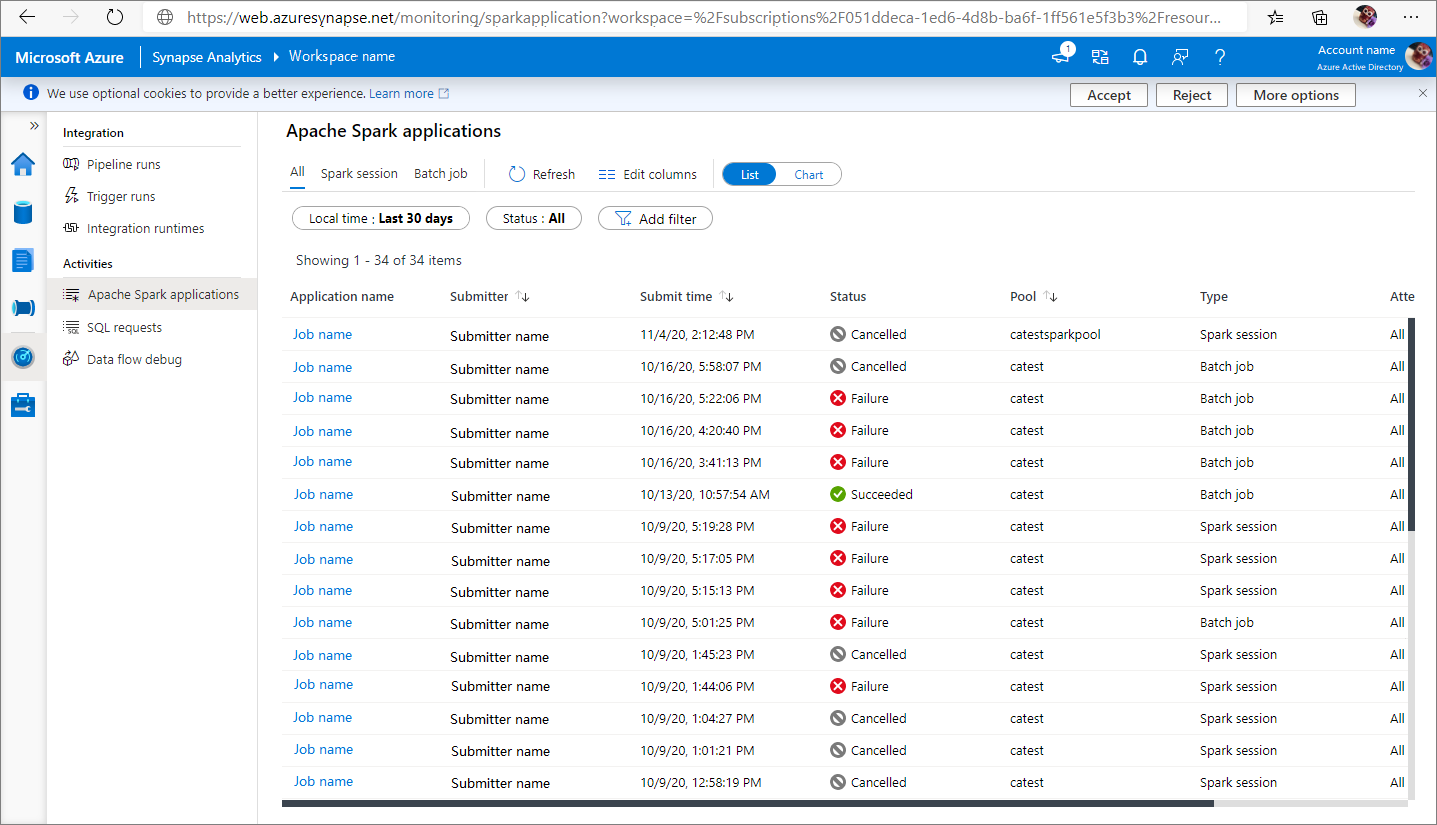
View completed Apache Spark applications
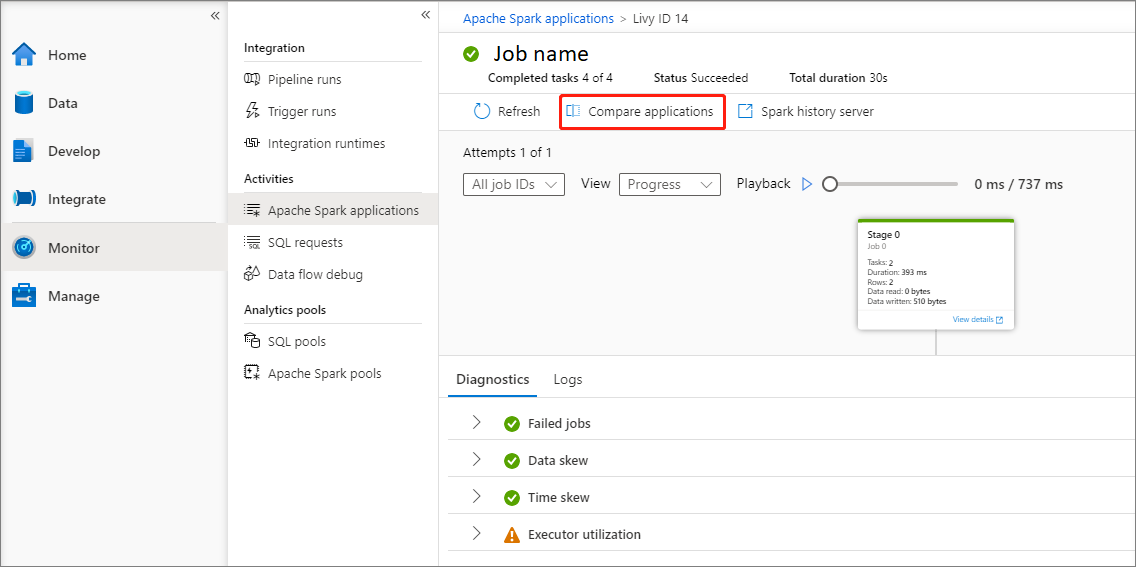
Open Monitor, then select Apache Spark applications. To view the details about the completed Apache Spark applications, select the Apache Spark application.

Check the Completed tasks, Status, and Total duration.
Refresh the job.
Click on Compare applications to use the comparison feature, for more information on this feature, see the Compare Apache Spark applications.
Click on Spark history server to open the History Server page.
Check the Summary info.
Check the diagnostics in Diagnostic tab.
Check the Logs. You can view full log of Livy, Prelaunch, and Driver logs via selecting different options in the drop-down list. And you can directly retrieve the required log information by searching keywords. Click Download log to download the log information to the local, and select the Filter errors and warnings check box to filter the errors and warnings you need.
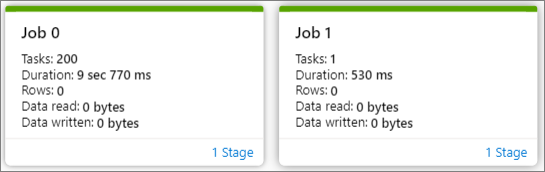
You can see an overview of your job in the generated job graph. By default, the graph shows all jobs. You can filter this view by Job ID.
By default, the Progress display is selected. You can check the data flow by selecting Progress/Read/Written/Duration in the View dropdown list.
To play back the job, click on Playback button. You can click on Stop button at any time to stop.
Use scroll bar to zoom in and zoom out the job graph, you can also select Zoom to Fit to make it fit the screen.

The job graph node displays the following information of each stage:
Job ID
Task number
Duration time
Row count
Data read: the sum of input size and shuffle read size
Data written: the sum of output size and shuffle writes size
Stage number
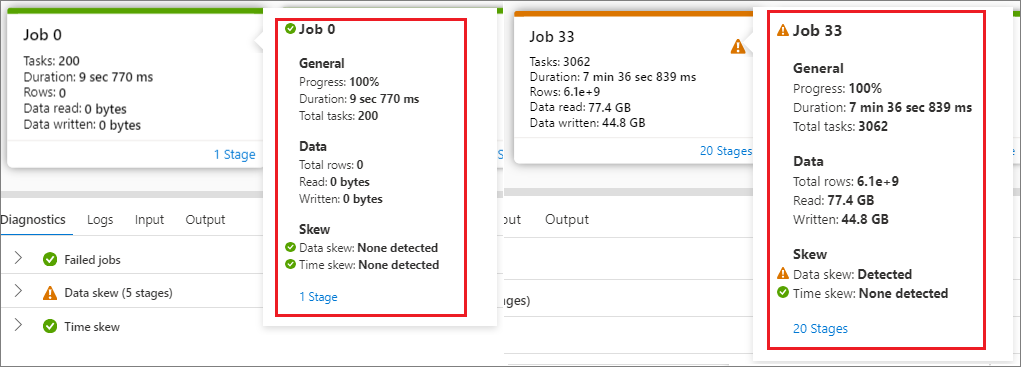
Hover the mouse over a job, and the job details will be displayed in the tooltip:
Icon of job status: If the job status is successful, it will be displayed as a green "√"; if the job detects a problem, it will display a yellow "!"
Job ID
General part:
- Progress
- Duration time
- Total tasks number
Data part:
- Total rows number
- Read size
- Written size
Skew part:
- Data skew
- Time skew
Stage number
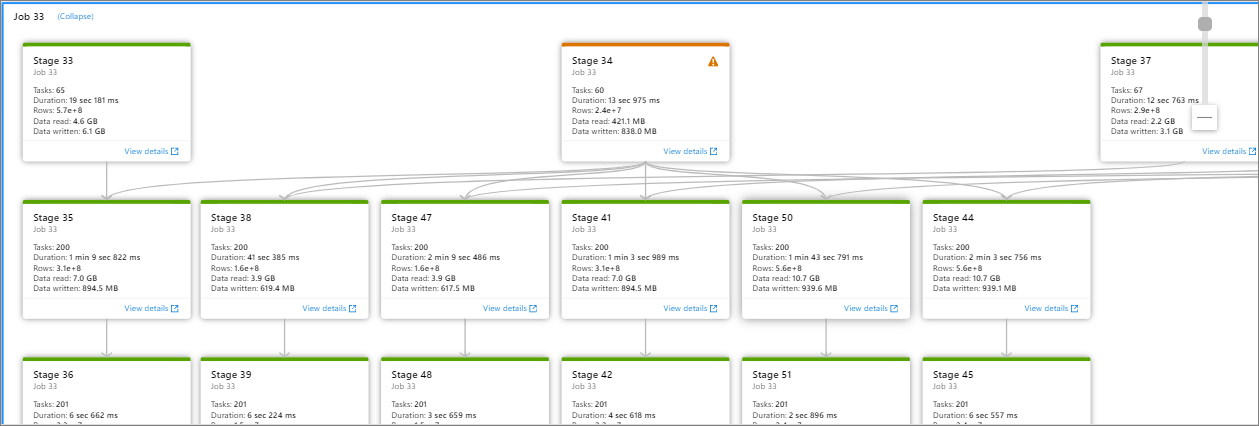
Click Stage number to expand all the stages contained in the job. Click Collapse next to the Job ID to collapse all the stages in the job.
Click on View details in a stage graph, then the details for a stage will appear.

Monitor Apache Spark application progress
Open Monitor, then select Apache Spark applications. To view the details about the Apache Spark applications that are running, select the submitted Apache Spark application. If the Apache Spark application is still running, you can monitor the progress.

Check the Completed tasks, Status, and Total duration.
Cancel the Apache Spark application.
Refresh the Job.
Click on Spark UI button to go to Spark Job page.
For Job graph, Summary, Diagnostics, Logs. You can see an overview of your job in the generated job graph. Refer to steps 5 - 15 of View completed Apache Spark applications.

View canceled Apache Spark applications
Open Monitor, then select Apache Spark applications. To view the details about the canceled Apache Spark applications, select the Apache Spark application.

Check the Completed tasks, Status, and Total duration.
Refresh the Job.
Click on Compare applications to use the comparison feature, for more information on this feature, see the Compare Apache Spark applications.
Open Apache history server link by clicking Spark history server.
View the graph. You can see an overview of your job in the generated job graph. Refer to steps 5 - 15 of View completed Apache Spark applications.

Debug failed Apache Spark application
Open Monitor, then select Apache Spark applications. To view the details about the failed Apache Spark applications, select the Apache Spark application.

Check the Completed tasks, Status, and Total duration.
Refresh the Job.
Click on Compare applications to use the comparison feature, for more information on this feature, see the Compare Apache Spark applications.
Open Apache history server link by clicking Spark history server.
View the graph. You can see an overview of your job in the generated job graph. Refer to steps 5 - 15 of View completed Apache Spark applications.

View input data/output data
Select an Apache Spark application, and click on Input data/Output data tab to view dates of the input and output for Apache Spark application. This function can help you debug the Spark job. And the data source supports three storage methods: gen1, gen2, and blob.
Input data tab
Click on the Copy input button to paste the input file to the local.
Click the Export to CSV button to export the input file in CSV format.
You can search files by input keywords in Search box (keywords include file name, read format and path).
You can sort the input files by clicking Name, Read format, and path.
Use the mouse to hover over an input file, the icon of the Download/Copy path/More button will appear.
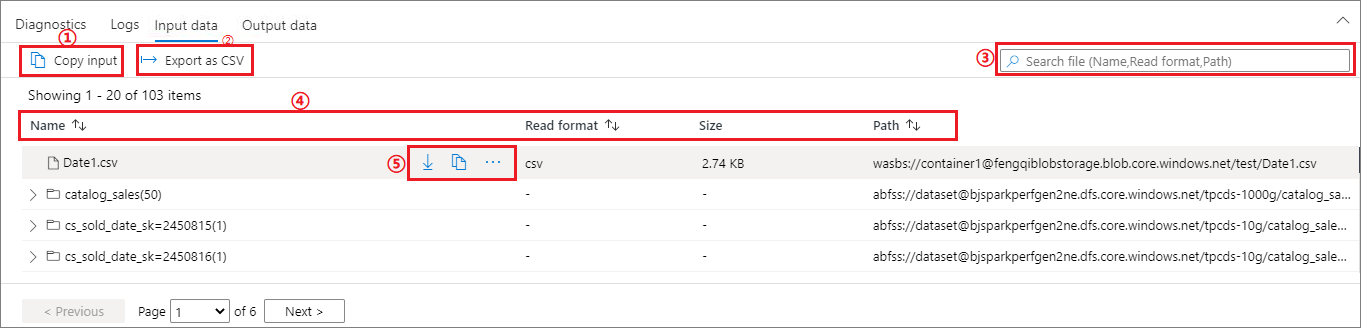
Click on More button. The Copy path/Show in explorer/Properties will appear in the context menu.
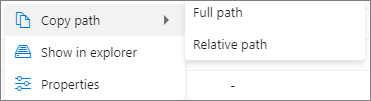
Copy path: can copy Full path and Relative path.
Show in explorer: can jump to the linked storage account (Data->Linked).
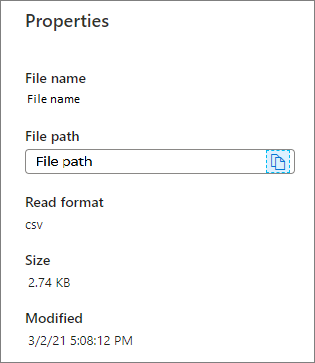
Properties: show the basic properties of the file (File name/File path/Read format/Size/Modified).
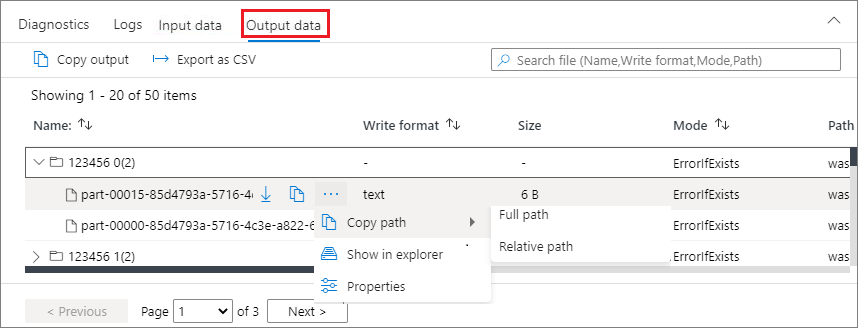
Output data tab
Displays the same features as the input tab.
Compare Apache Spark Applications
There are two ways to compare applications. You can compare by choosing Compare Application, or click the Compare in notebook button to view it in the notebook.
Compare by application
Click on Compare applications button and choose an application to compare performance. You can see the difference between the two applications.

Use the mouse to hover over an application, and then the Compare applications icon is displayed.
Click on the Compare applications icon, and the Compare applications page will pop up.
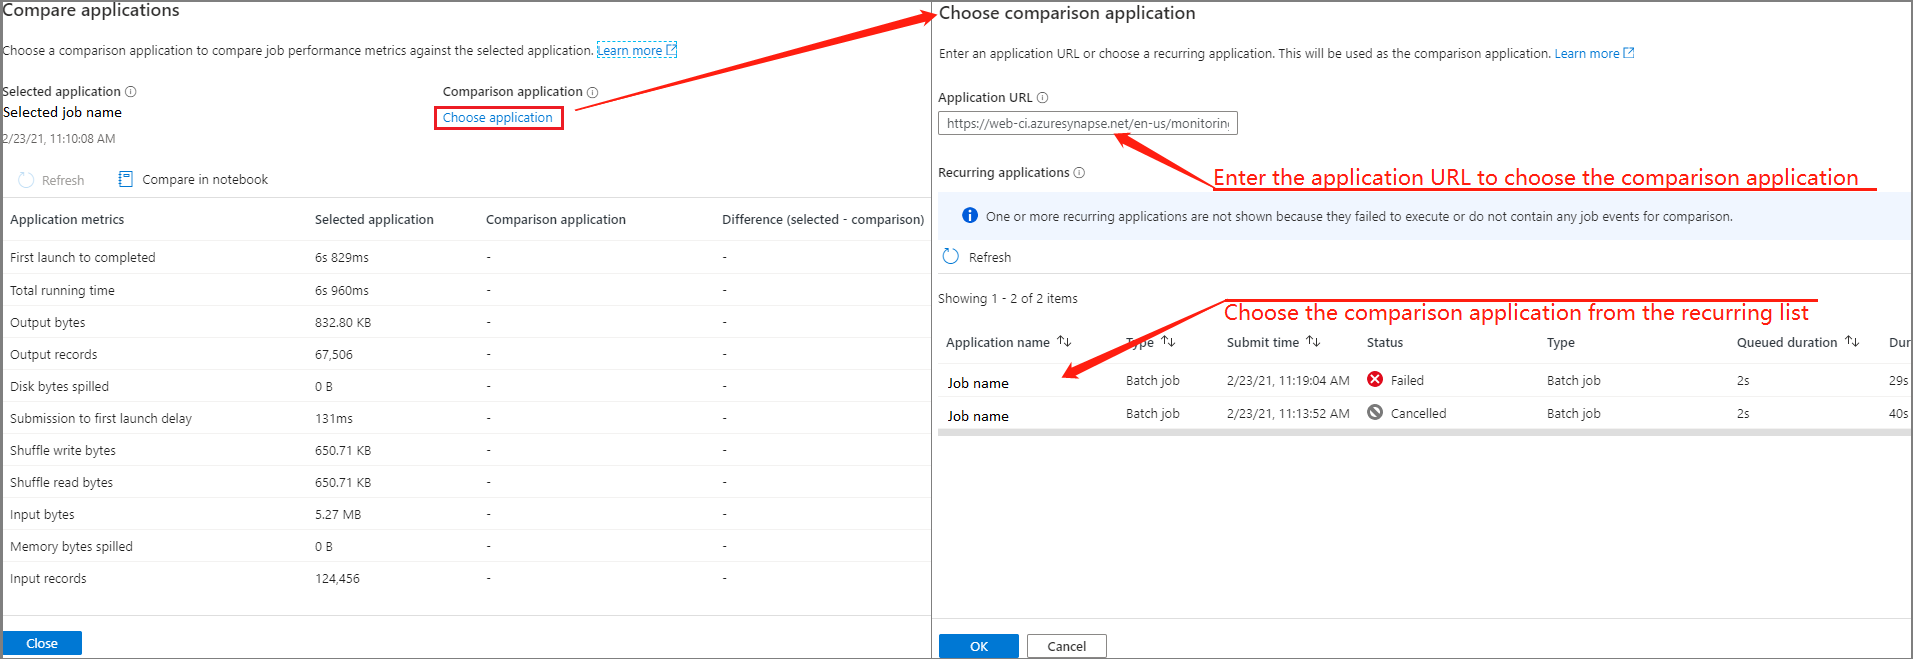
Click on Choose application button to open Choose comparison application page.
When choosing the comparison application, you need to either enter the application URL, or choose from the recurring list. Then, click OK button.
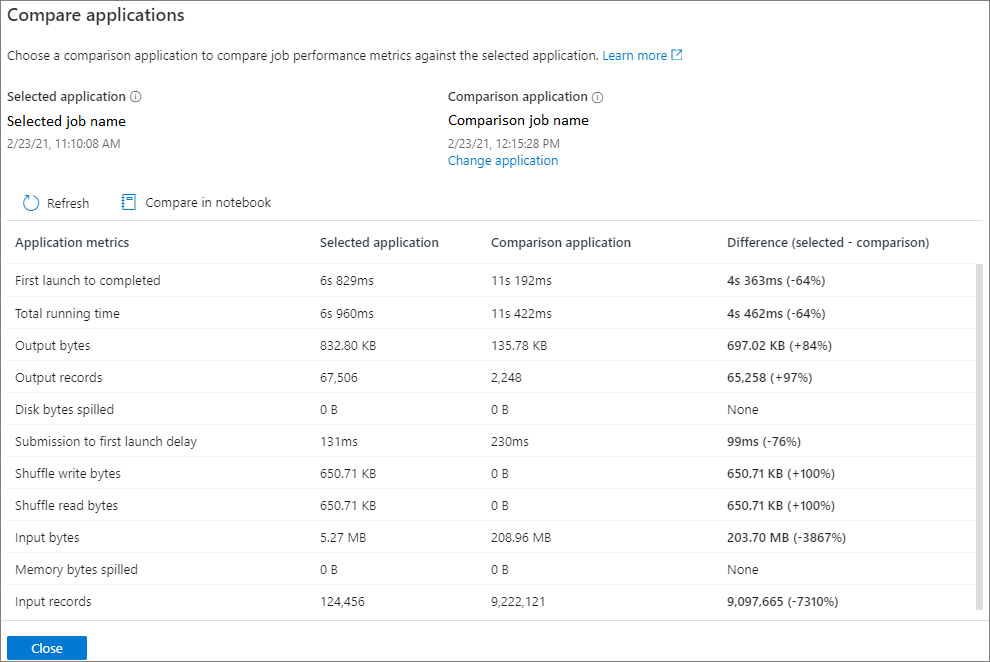
The comparison result will be displayed on the compare applications page.
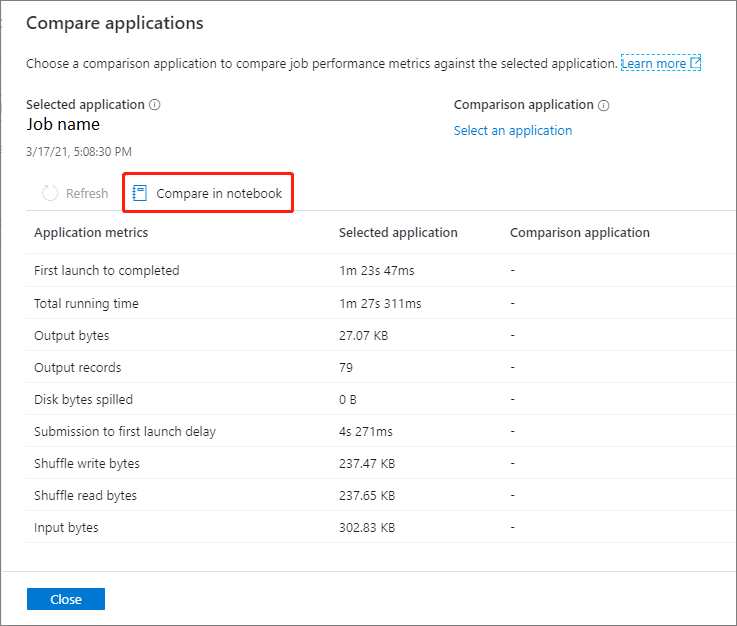
Compare in notebook
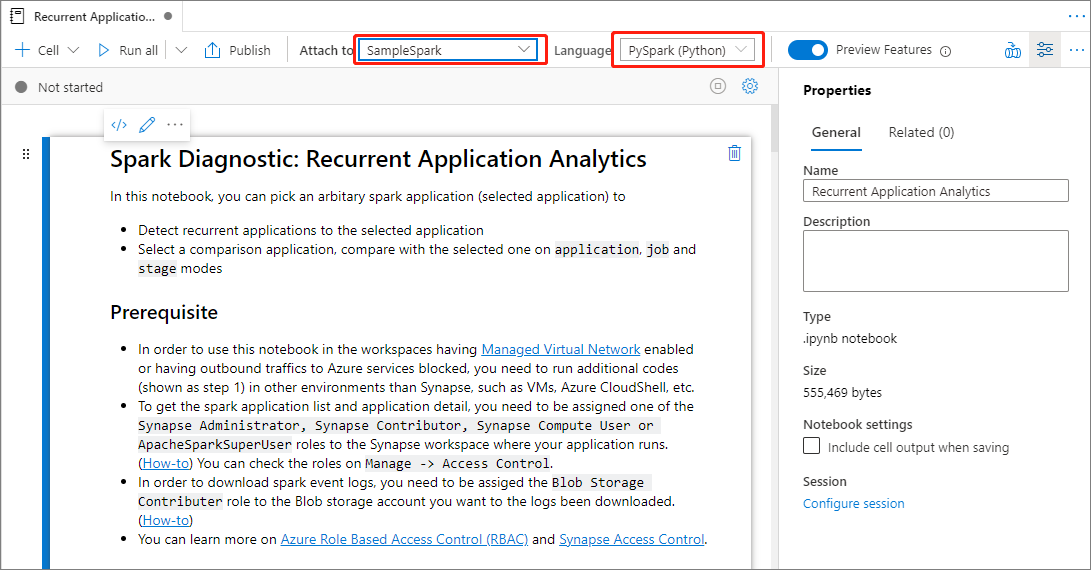
Click the Compare in Notebook button on the Compare applications page to open the notebook. The default name of the .ipynb file is Recurrent Application Analytics.
In the Notebook: Recurrent Application Analytics file, you can run it directly after setting the Spark pool and Language.
Next steps
For more information on monitoring pipeline runs, see the Monitor pipeline runs using Synapse Studio article.
Feedback
Coming soon: Throughout 2024 we will be phasing out GitHub Issues as the feedback mechanism for content and replacing it with a new feedback system. For more information see: https://aka.ms/ContentUserFeedback.
Submit and view feedback for