Use extended Apache Spark history server to debug and diagnose Apache Spark applications
This article provides guidance on how to use the extended Apache Spark history server to debug and diagnose completed and running Spark applications.
The extension includes a data tab, graph tab, and diagnosis tab. Use the Data tab to check the input and output data of the Spark job. The Graph tab shows you the data flow and replay of the job graph. The Diagnosis tab shows you Data Skew, Time Skew, and Executor Usage Analysis.
Access the Apache Spark history server
Apache Spark history server is the web user interface for completed and running Spark applications. You can open the Apache Spark history server web interface from the Azure Synapse Analytics.
Open the Spark History Server web UI from Apache spark applications node
Open Azure Synapse Analytics.
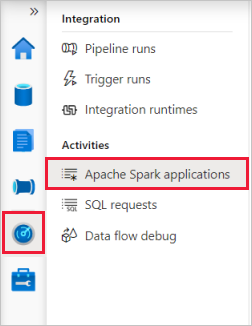
Select Monitor, then select Apache Spark Applications.
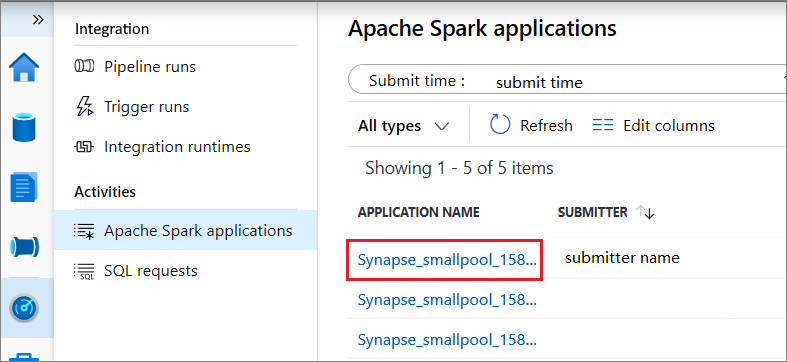
Select an application, then open Log query by selecting it.
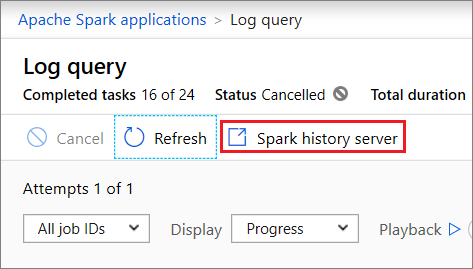
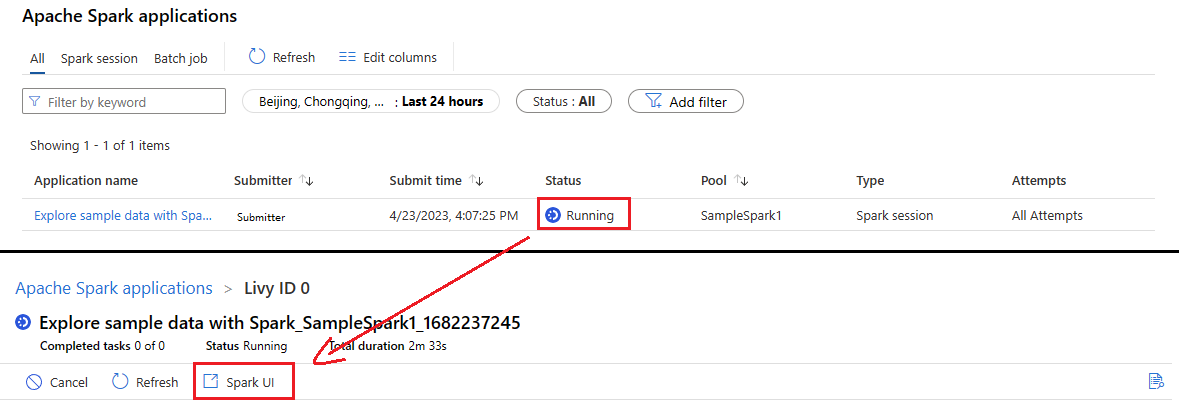
Select Spark history server, then the Spark History Server web UI will show up. For a running Spark application, the button is Spark UI.
Open the Spark History Server web UI from Data node
From your Synapse Studio notebook, select Spark history server from the job execution output cell or from the status panel at the bottom of the notebook document. Select Session details.

Select Spark history server from the slide out panel.

Graph tab in Apache Spark history server
Select the Job ID for the job you want to view. Then, select Graph on the tool menu to get the job graph view.
Overview
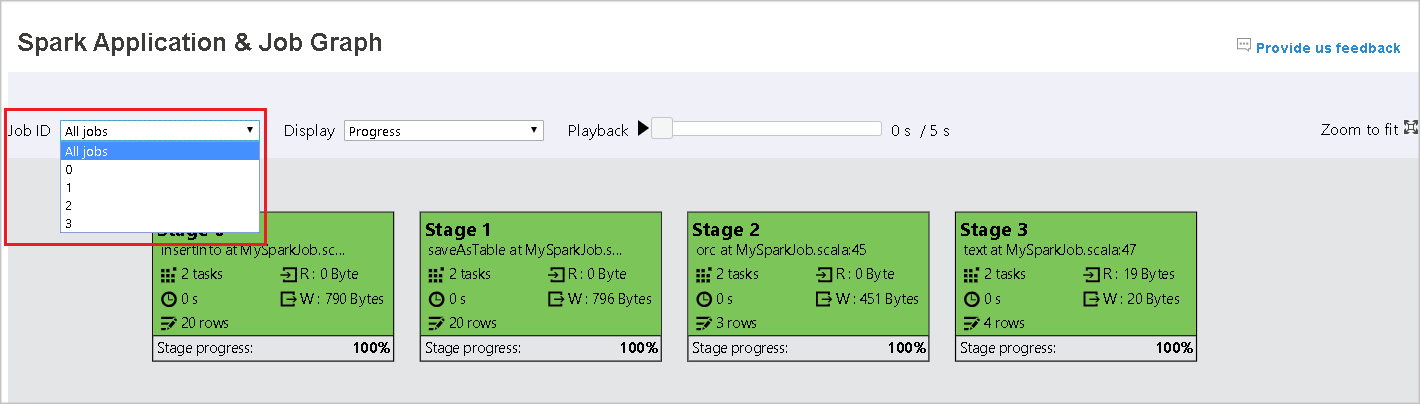
You can see an overview of your job in the generated job graph. By default, the graph shows all jobs. You can filter this view by Job ID.
Display
By default, the Progress display is selected. You can check the data flow by selecting Read or Written in the Display dropdown list.
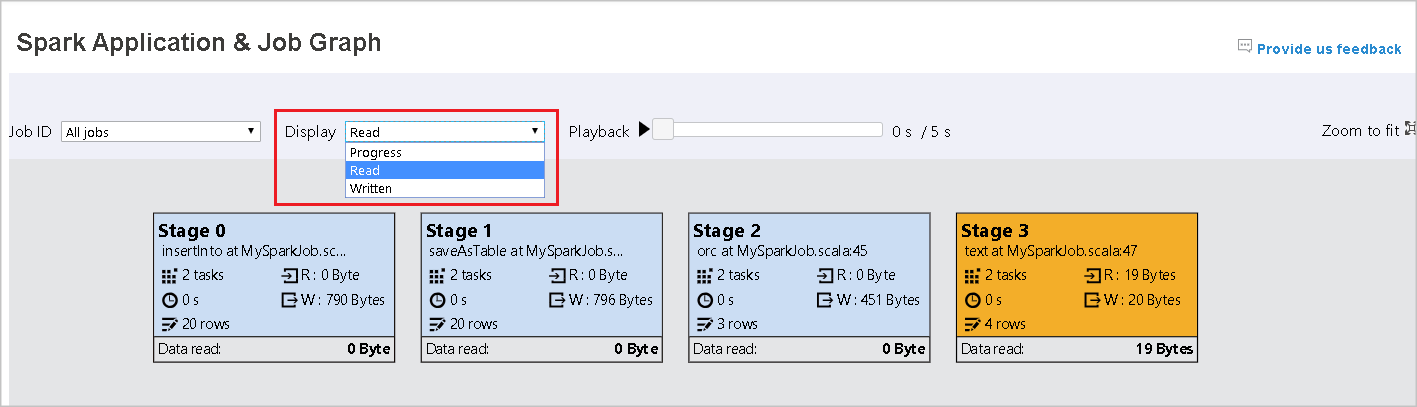
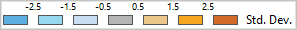
The graph node displays the colors shown in the heatmap legend.
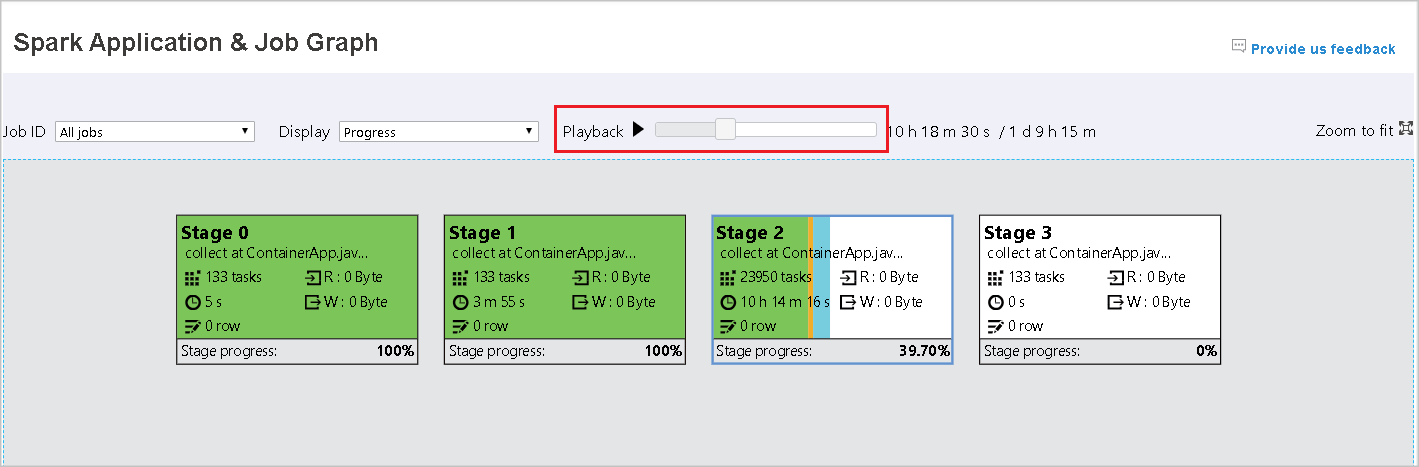
Playback
To playback the job, select Playback. You can select Stop at any time to stop. The task colors show different statuses when playing back:
| Color | Meaning |
|---|---|
| Green | Succeeded: The job has completed successfully. |
| Orange | Retried: Instances of tasks that failed but do not affect the final result of the job. These tasks had duplicate or retry instances that may succeed later. |
| Blue | Running: The task is running. |
| White | Waiting or skipped: The task is waiting to run, or the stage has skipped. |
| Red | Failed: The task has failed. |
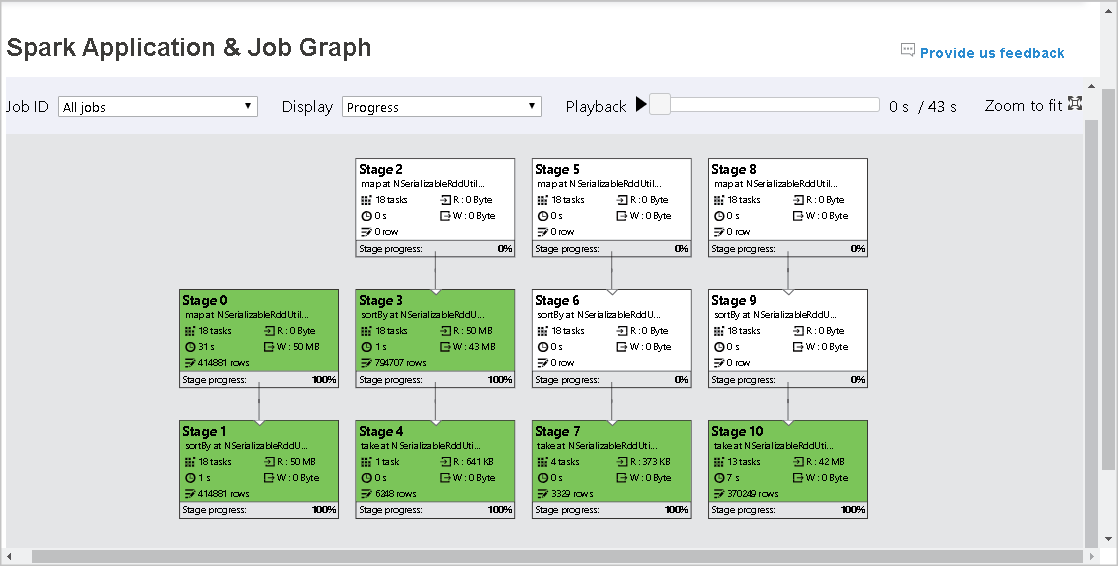
The following image shows Green, Orange, and Blue status colors.
The following image shows Green and White status colors.
The following image shows Red and Green status colors.

Note
Playback for each job is allowed. For incomplete jobs, playback is not supported.
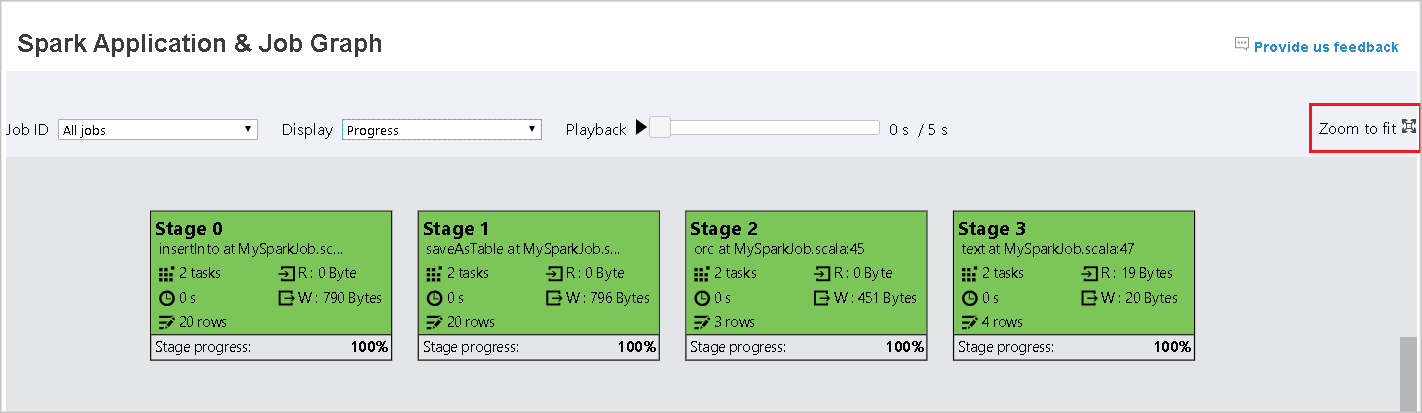
Zoom
Use your mouse scroll to zoom in and out on the job graph, or select Zoom to fit to make it fit to screen.
Tooltips
Hover on graph node to see the tooltip when there are failed tasks, and select a stage to open its stage page.

On the job graph tab, stages have a tooltip and a small icon displayed if they have tasks that meet the following conditions:
| Condition | Description |
|---|---|
| Data skew | data read size > average data read size of all tasks inside this stage * 2 and data read size > 10 MB |
| Time skew | execution time > average execution time of all tasks inside this stage * 2 and execution time > 2 minutes |
![]()
Graph node description
The job graph node displays the following information of each stage:
ID.
Name or description.
Total task number.
Data read: the sum of input size and shuffle read size.
Data write: the sum of output size and shuffle writes size.
Execution time: the time between start time of the first attempt and completion time of the last attempt.
Row count: the sum of input records, output records, shuffle read records and shuffle write records.
Progress.
Note
By default, the job graph node displays information from the last attempt of each stage (except for stage execution time). However, during playback, the graph node shows information of each attempt.
The data size of read and write is 1MB = 1000 KB = 1000 * 1000 Bytes.
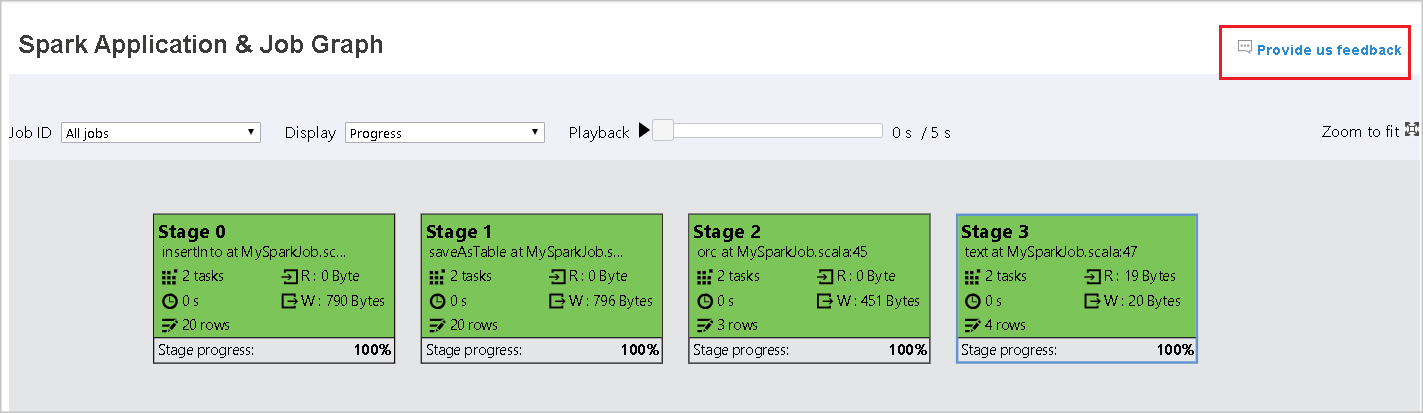
Provide feedback
Send feedback with issues by selecting Provide us feedback.
Explore the Diagnosis tab in Apache Spark history server
To access the Diagnosis tab, select a job ID. Then select Diagnosis on the tool menu to get the job Diagnosis view. The diagnosis tab includes Data Skew, Time Skew, and Executor Usage Analysis.
Check the Data Skew, Time Skew, and Executor Usage Analysis by selecting the tabs respectively.
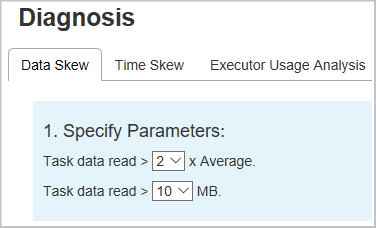
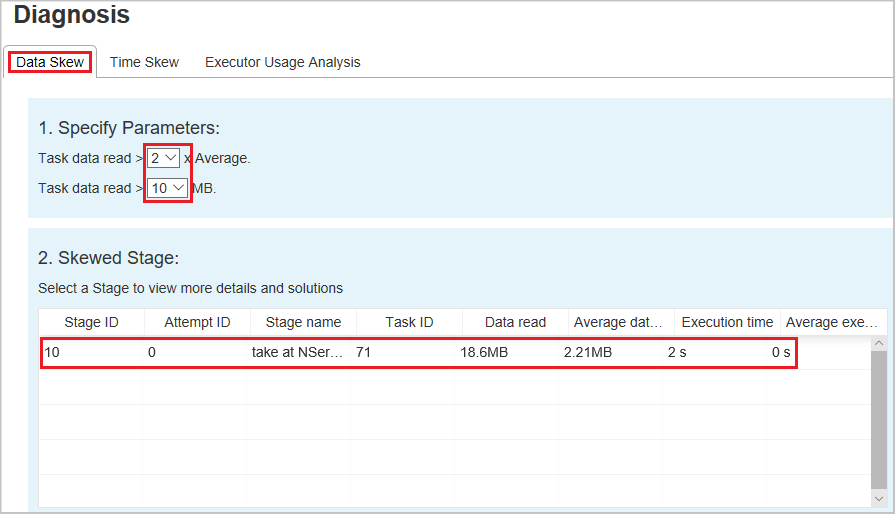
Data Skew
When you select the Data Skew tab, the corresponding skewed tasks are displayed based on the specified parameters.
Specify Parameters - The first section displays the parameters, which are used to detect Data Skew. The default rule is: Task Data Read is greater than three times of the average task data read, and the task data read is more than 10 MB. If you want to define your own rule for skewed tasks, you can choose your parameters. The Skewed Stage and Skew Char sections are refreshed accordingly.
Skewed Stage - The second section displays stages, which have skewed tasks meeting the criteria specified above. If there is more than one skewed task in a stage, the skewed stage table only displays the most skewed task (for example, the largest data for data skew).
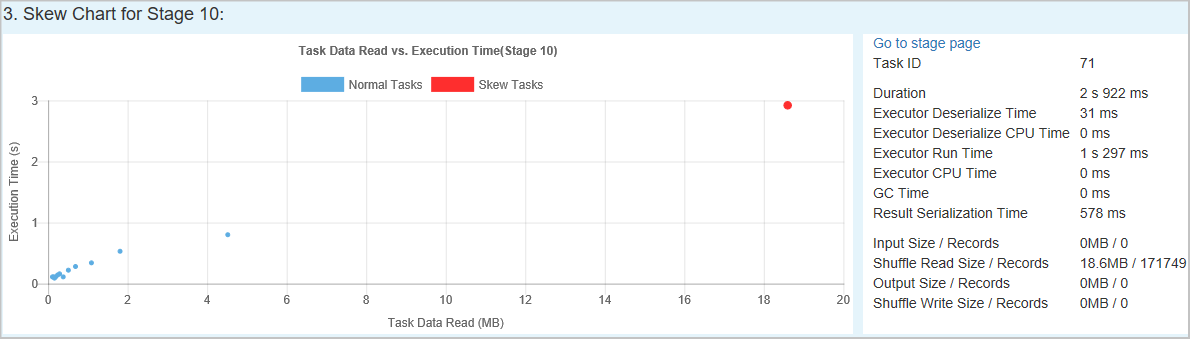
Skew Chart – When a row in the skew stage table is selected, the skew chart displays more task distribution details based on data read and execution time. The skewed tasks are marked in red and the normal tasks are marked in blue. The chart displays up to 100 sample tasks, and the task details are displayed in right bottom panel.
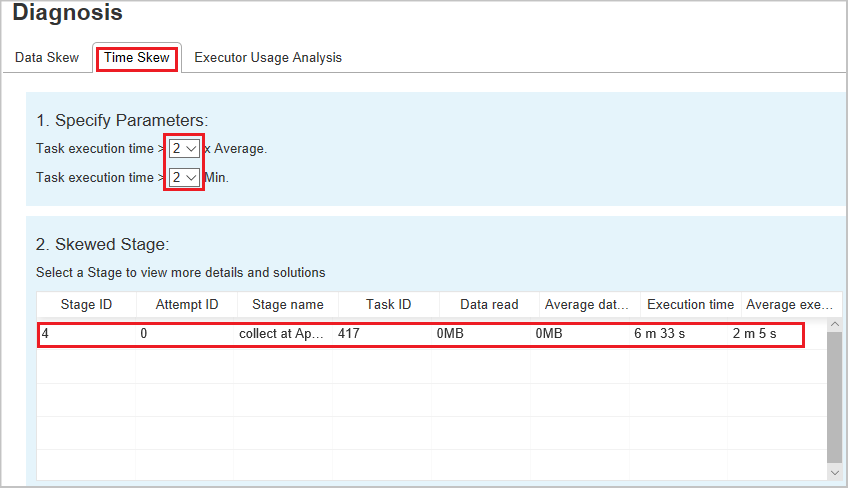
Time Skew
The Time Skew tab displays skewed tasks based on task execution time.
Specify Parameters - The first section displays the parameters, which are used to detect Time Skew. The default criteria to detect time skew is: task execution time is greater than three times of average execution time and task execution time is greater than 30 seconds. You can change the parameters based on your needs. The Skewed Stage and Skew Chart display the corresponding stages and tasks information just like the Data Skew tab above.
Select Time Skew, then filtered result is displayed in Skewed Stage section according to the parameters set in section Specify Parameters. Select one item in Skewed Stage section, then the corresponding chart is drafted in section3, and the task details are displayed in right bottom panel.
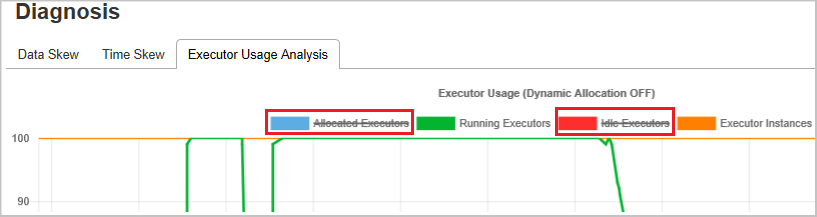
Executor Usage Analysis
The Executor Usage Graph visualizes the Spark job executor's allocation and running status.
Select Executor Usage Analysis, then four types curves about executor usage are drafted, including Allocated Executors, Running Executors, Idle Executors, and Max Executor Instances. For allocated executors, each "Executor added" or "Executor removed" event increases or decreases the allocated executors. You can check "Event Timeline" in the "Jobs" tab for more comparison.
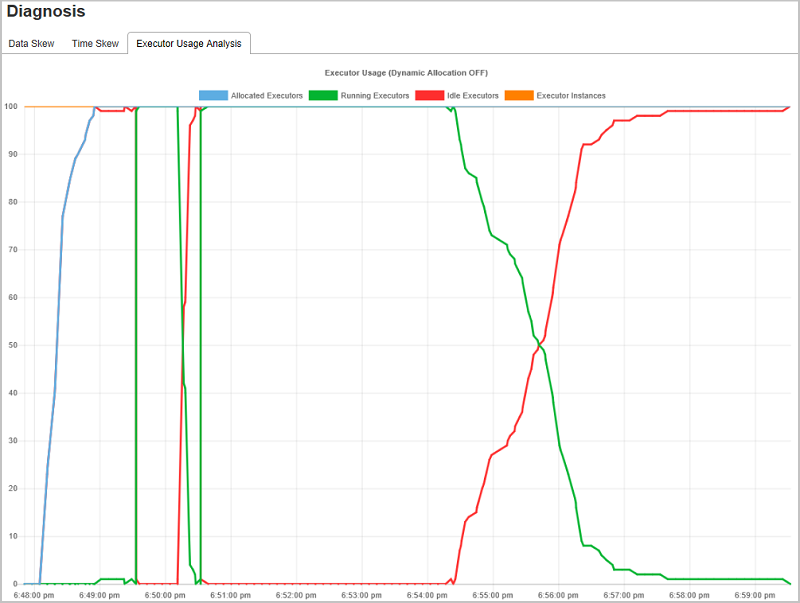
Select the color icon to select or unselect the corresponding content in all drafts.
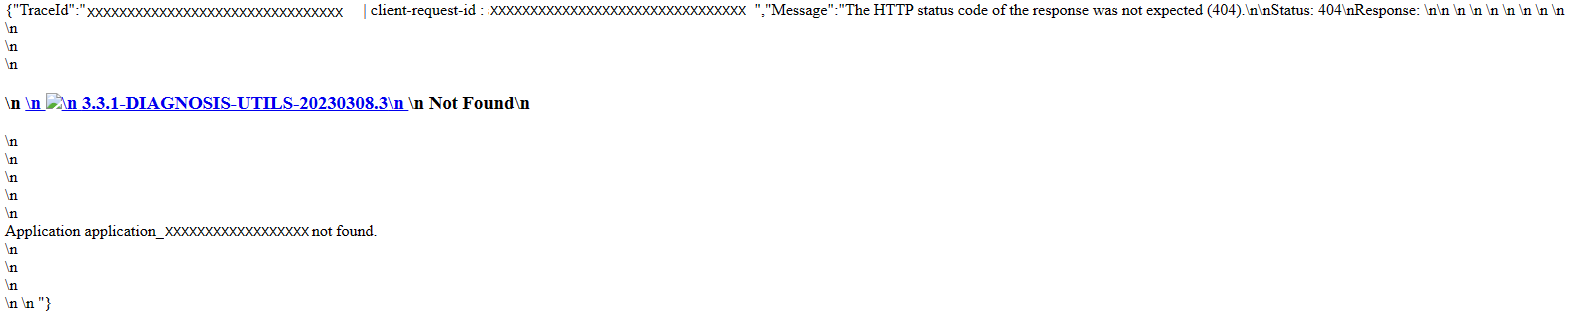
Troubleshooting guide for 404 in Spark UI
In some cases, for long-running Spark applications with massive jobs and stages, when opening Spark UI, it may fail with the following page show up:
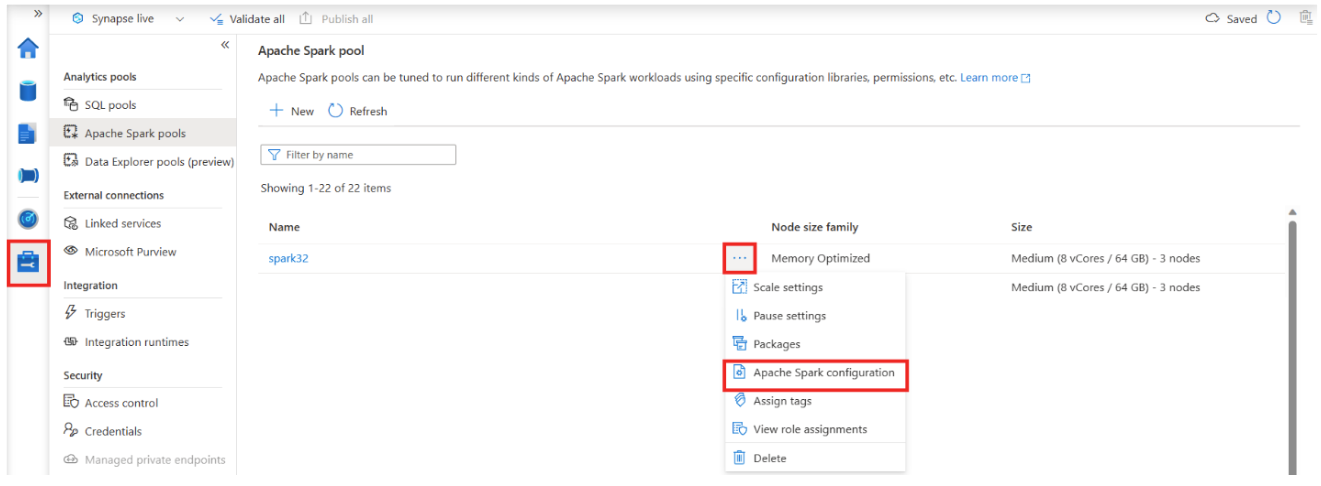
As a workaround, an extra Spark configuration can be applied to the Spark pool:
spark.synapse.history.rpc.memoryNeeded 1g
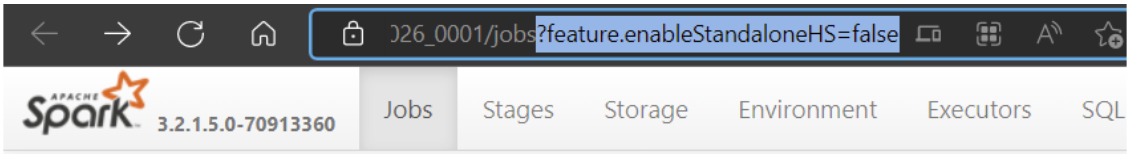
For existing running Spark applications, in Spark UI page, add this query string at the end of the browser’s address bar: ?feature.enableStandaloneHS=false
Known issues
Input/output data using Resilient Distributed Datasets (RDDs) doesn't show in the data tab.
Next steps
Feedback
Coming soon: Throughout 2024 we will be phasing out GitHub Issues as the feedback mechanism for content and replacing it with a new feedback system. For more information see: https://aka.ms/ContentUserFeedback.
Submit and view feedback for