New filter experience
Important
This content is archived and is not being updated. For the latest documentation, see Microsoft Dynamics 365 product documentation. For the latest release plans, see Dynamics 365 and Microsoft Power Platform release plans.
Note
These release notes describe functionality that may not have been released yet. To see when this functionality is planned to release, please review What’s new and planned for business intelligence. Delivery timelines and projected functionality may change or may not ship (see Microsoft policy).
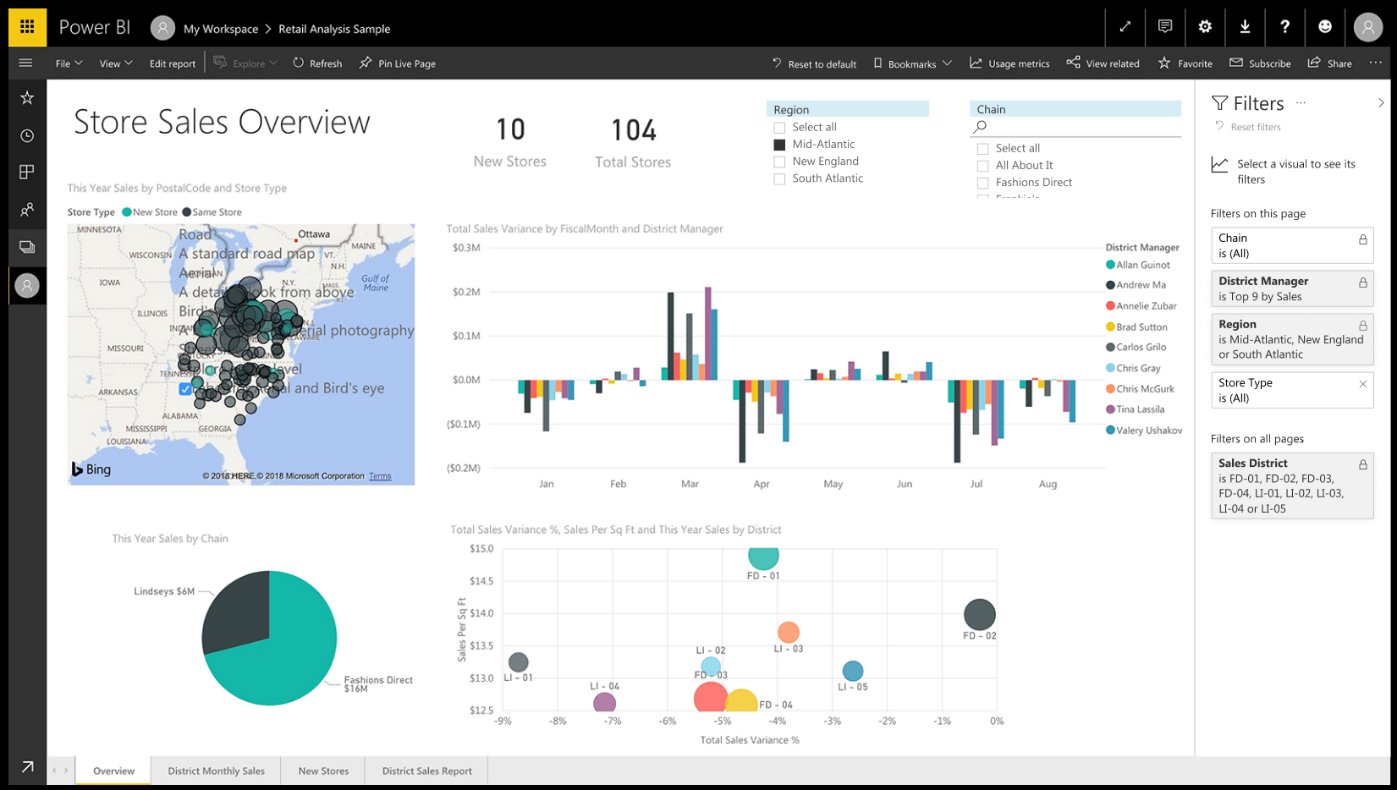
This public preview of the revamped filter experience went live with the November 2018 release of Power BI Desktop. This experience helps consumers of reports to better understand which filters are affecting a visual. It also helps with discoverability and gives report authors full control over the look and feel.
Authors can hide a filter card from end users even though it is applied to the report.
Authors can apply a filter and lock it, so end users will not be able to modify the filter but will show it to them for their information.
The redesigned filter pane includes the ability to:
- Hide individual filters or the entire filter pane from report consumers.
- Lock filters as read-only for report consumers.
- Format the filter pane to make it feel like a part of the report design.
- Define the default experience, expanded or collapsed, at report load time for report consumers.
- Understand what filters are being applied to a visual, including slicers, filters, and cross-highlighting.
- Search for filter values.
 Report using the new filter pane experience
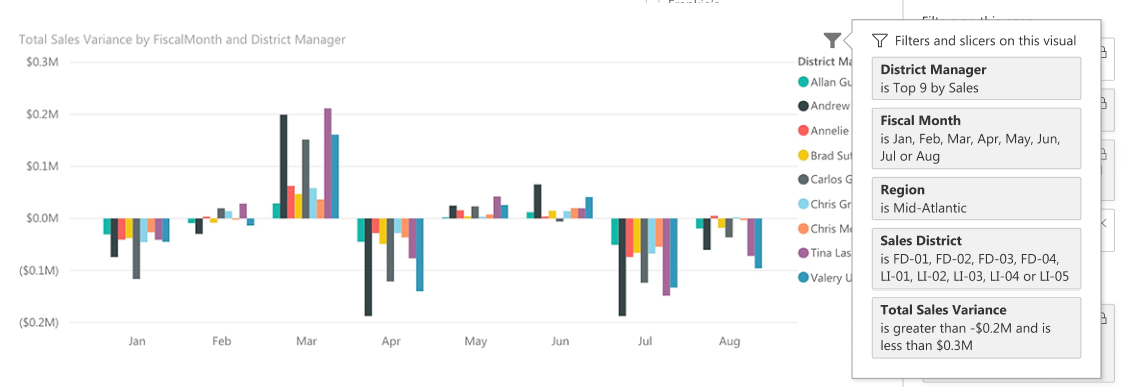
In addition to the changes to the filter pane, we are also giving authors the flexibility to show filters (including slicers) that are affecting a visual. Authors can enable a filter icon as a visual header and all the filters affecting that visual will show up when the end user hovers or clicks on that filter icon. This will help end users to understand which filters are impacting the visual to better interpret the insights.
 Hover on the filter icon for any visual to see which filters have been applied
We are actively listening to feedback from users of the public preview and improving the experience before making it generally available. The following capabilities are planned and will ship before or alongside general availability of the new filtering experience:
- Accessibility for end users and report authors.
- Additional formatting capabilities.
- Consolidating the filtering experience to a single pane.
- Ability for authors to sort and reorder filter cards.
The new filter experience addresses the following Power BI Ideas requests:
Tell us what you think
Help us improve Power BI by discussing ideas, providing suggestions, and giving feedback.
- Use the Power BI Ideas site to provide suggestions for improving the product.
- Use the feedback area (Feedback or Is this page helpful?) at the lower right of this page to provide suggestions for improving the content in release notes.