Smart alignment guides
Important
This content is archived and is not being updated. For the latest documentation, see Microsoft Dynamics 365 product documentation. For the latest release plans, see Dynamics 365 and Microsoft Power Platform release plans.
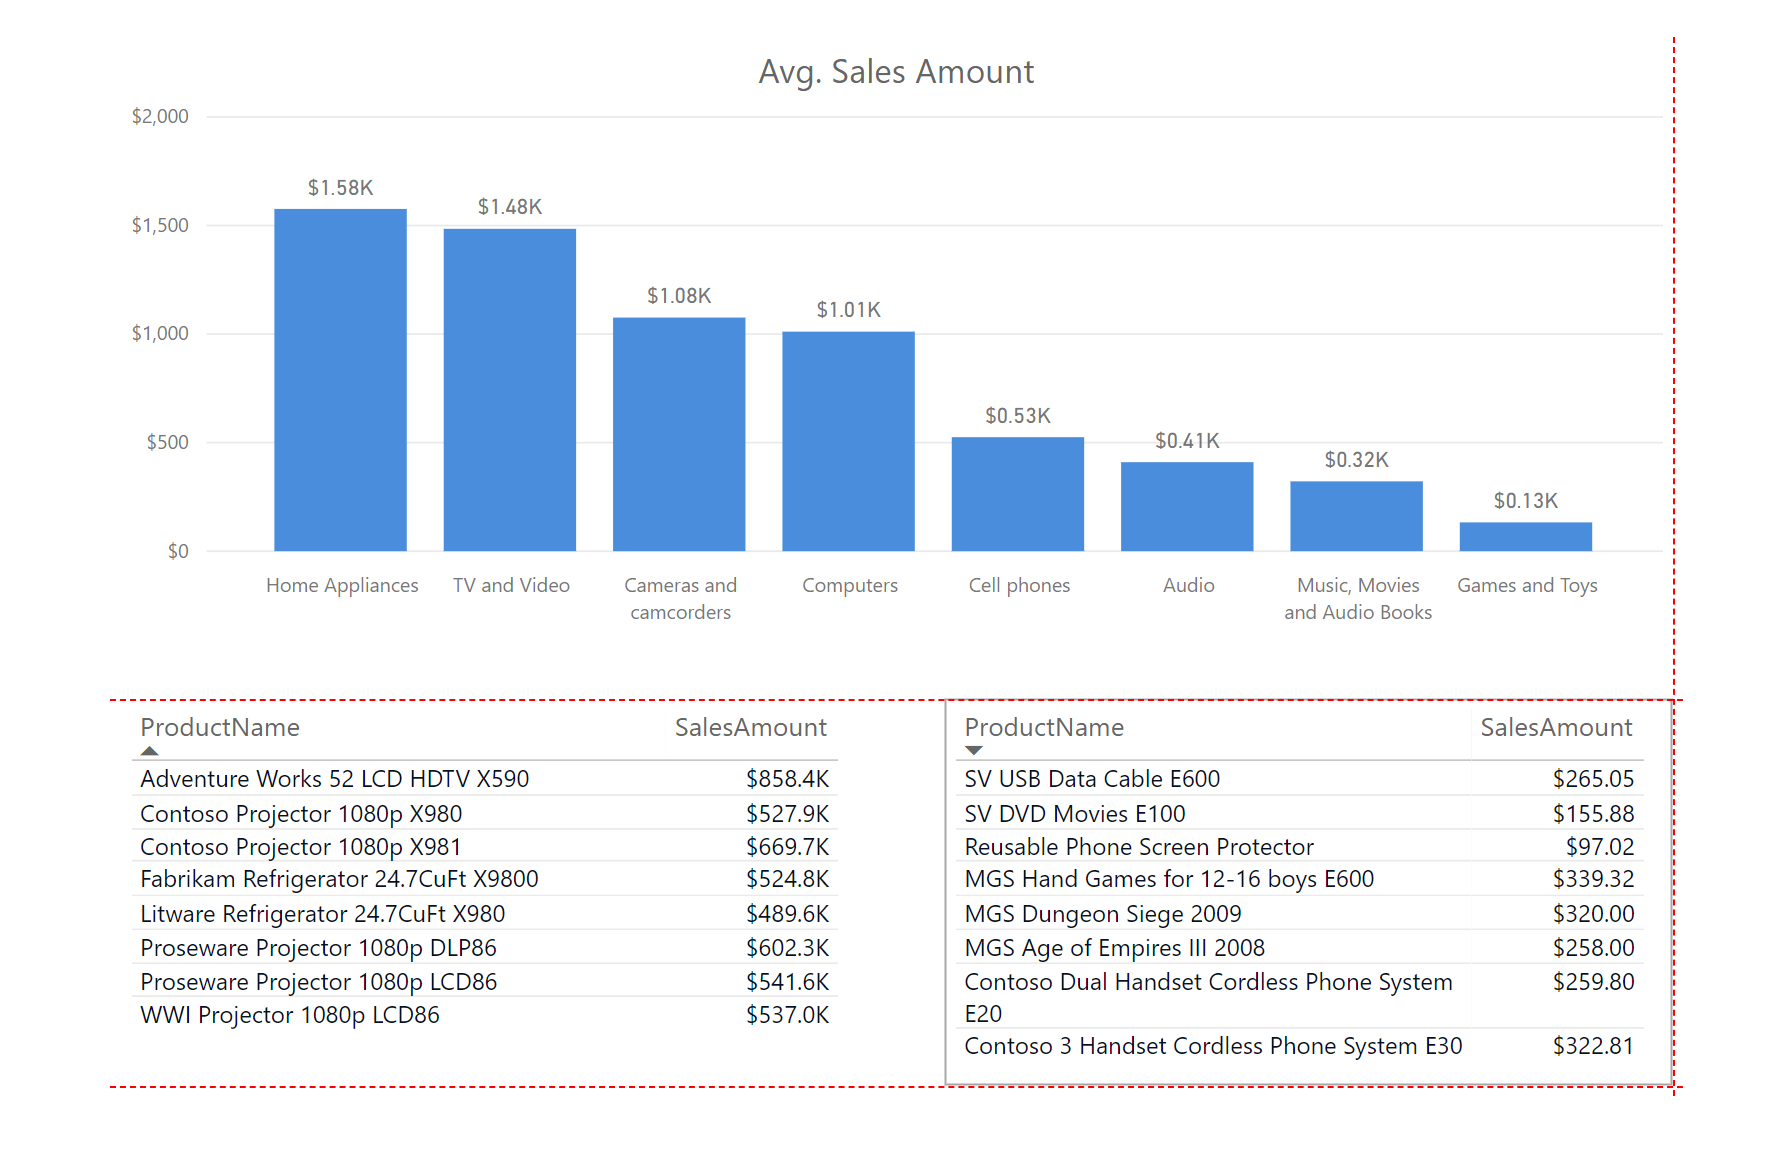
Report authors can now easily adjust the alignment of visuals on a page with the support of smart alignment guides. When dragging objects on the canvas, dashed red lines, similar to those in PowerPoint, will appear to indicate when edges are aligned, or the object is centered on the page.
Example of right- and bottom-edge alignment of visuals:
