Released version 20181006
Introduction
Version 20181006 for Power Automate portal is now available in all regions. This article describes the updates, including the new features, and the fixes to existing functionality, which are included in this update. This version was first made available in preview on October 8, 2018, and completed worldwide rollout on October 31, 2018.
New Microsoft Flow portal and designer experience
As a part of the October release, we are overhauling several key aspects of the Microsoft Flow portal and designer experiences.
Navigating in the Flow portal
We have an all-new way to find the different key pages on the Microsoft Flow portal. Previously, there were a few links along the top of the portal. Some pages, such as Connections and Custom connectors, were relegated to the Settings gear in the top right, and many people had difficulty finding these pages.
With the October release, we are moving to a left-side navigation. This new navigation has a Data section, which includes access to aspects of Connections, but also to your Common Data Service for Apps Entities:
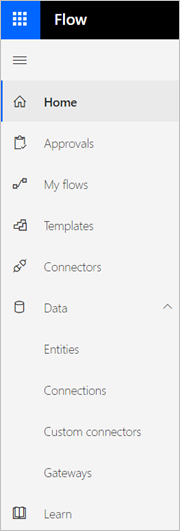
This change is also important because it allows us to add more items into the navigation in the future, such as the solution management feature that is coming soon. This will enable you to group your flows into logical components (one of the top ideas in the Ideas forum).
Finally, you can expand and collapse the left navigation from the button at the top of the nav.
The My flows list
We are simplifying the experience in the My flows list and making it consistent with other Microsoft user interfaces.
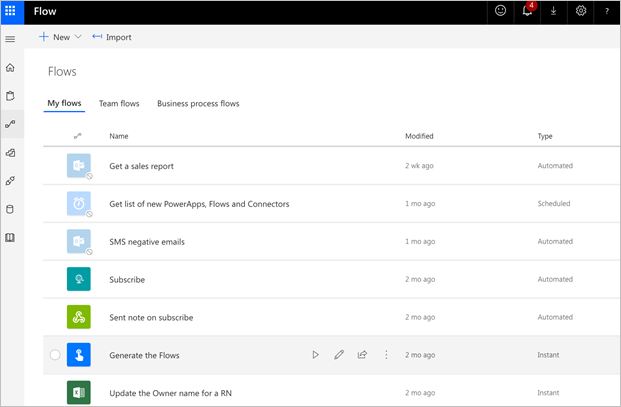
In this new experience, you can run Instant flows (those flows triggered manually, such as flows triggered by the Flow button for mobile) by selecting the Run button from the Flow list. We have also made it easier to identify which flows are on by dimming the icons of flows that are off.
Adding triggers and actions in the Flow designer
Third, we have a new experience for adding triggers and actions in the Flow designer. When you add a trigger you will see an experience like this:
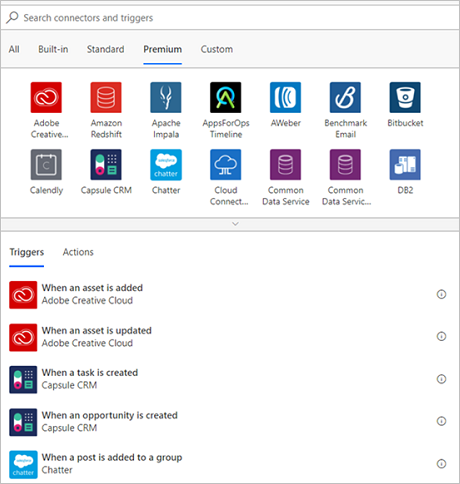
This new experience gives you the ability to browse your connectors by category. For example, you can see which connectors are Premium or the Custom connectors in your environment.
Next, when you select New step, you’ll no longer see the secondary flyout where you would choose between adding an action, condition, or more. Now, you’ll immediately be taken to the Choose an action dialog, which saves you from always making an extra selection.
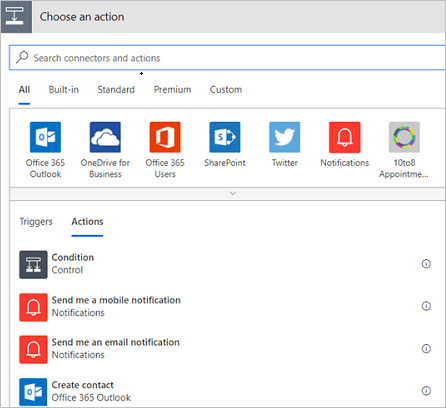
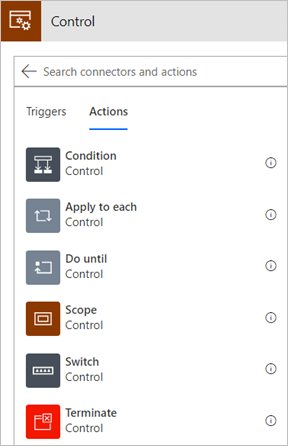
We have combined all of the Control actions into this dialog, so you can still select Condition immediately. You can search, or select the Control connector to get to the other control-flow concepts like Apply to Each or Scopes:
Sharing and Connectors Admin Analytics Reports
In late September, we announced the public preview release of Power platform Admin Analytics. In that post, we discussed a couple of upcoming reports, including sharing and connectors. Both the sharing and connectors reports now are available in Microsoft Flow Admin Analytics.
Note
The prerequisites for accessing these reports have not changed, but we are working on them. Please review the requirements in our previous post.
Both reports provide insight into how users are using Microsoft Flow within your tenant. From a sharing perspective, you are able to understand who your champions are and then figure out how you can empower them to provide even more automated solutions for your organization. The connectors report will identify Microsoft, third party, and custom connectors that are in use within your organization.
When you navigate to the Power Platform admin center, you will find an Analytics menu where you can choose to browse analytics for the Common Data Service for Apps, Microsoft Flow, and PowerApps. For the Sharing and Connectors report, select Microsoft Flow.
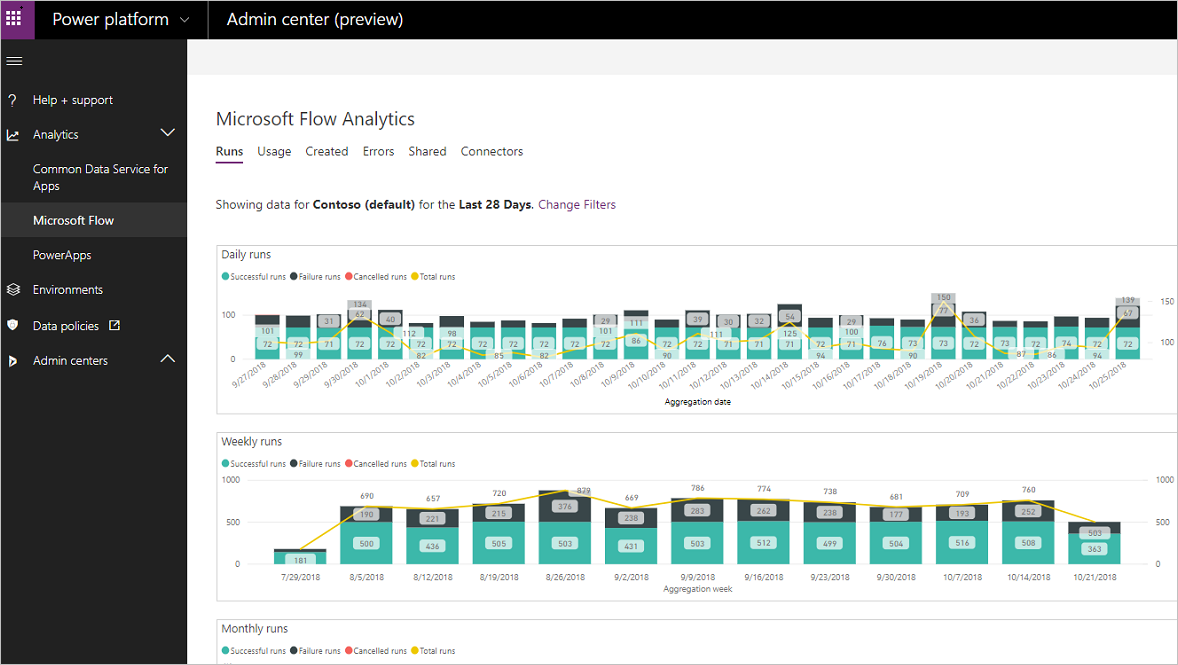
From within the Microsoft Flow Analytics feature, you can select Shared to access your sharing report. Within this report you will see three different visualizations that capture:
- The types of flows shared (System Events, Scheduled, or Button clicked).
- The name of the flow that has been shared.
- The number of shares that have taken place.
- A trendline report of these shared events.

In addition to the sharing report, we have also released a report that highlights connector usage. The Connectors report provides:
Two visualizations that display connector usage by:
- Flow runs.
- Connector connections (calls to the connector).
A table visualization that lists:
- The name of connector.
- Number of connections.
- Number of flows involved.
- Number of flow runs using that connector.

Fixes and improvements
- Connection parameters not in a query group - In the Power Query experience in Microsoft Flow, connection parameters are passed to the Power Query editor when you open it, but previously they were displayed at the same level as the queries themselves. Now, they are combined into a single parameters query group.
- Double scrollbars on Microsoft Flow pages in Chrome, and flows list overflows a white box behind it in Teams client
- 'See more templates' is missing on templates page