Open Folder support for C++ build systems in Visual Studio
The Open Folder feature is available in Visual Studio 2017 and later.
In Visual Studio 2017 and later, the "Open Folder" feature enables you to open a folder of source files and immediately start coding with support for IntelliSense, browsing, refactoring, debugging, and so on. As you edit, create, move, or delete files, Visual Studio tracks the changes automatically and continuously updates its IntelliSense index. No .sln or .vcxproj files are loaded; if needed, you can specify custom tasks as well as build and launch parameters through simple .json files. This feature enables you to integrate any third-party build system into Visual Studio. For general information about Open Folder, see Develop code in Visual Studio without projects or solutions.
CMake and Qt
CMake is integrated in the Visual Studio IDE as a component of the C++ desktop workload. The workflow for CMake is not identical to the workflow described in this article. If you are using CMake, see CMake projects in Visual Studio. You can also use CMake to build Qt projects, or you can use the Qt Visual Studio Extension for either Visual Studio 2015 or Visual Studio 2017.
Other build systems
To use the Visual Studio IDE with a build system or compiler toolset that is not directly supported from the main menu select File | Open | Folder or press Ctrl + Shift + Alt + O. Navigate to the folder that contains your source code files. To build the project, configure IntelliSense and set debugging parameters, you add three JSON files:
| File | Description |
|---|---|
| CppProperties.json | Specify custom configuration information for browsing. Create this file, if needed, in your root project folder. (Not used in CMake projects.) |
| tasks.vs.json | Specify custom build commands. Accessed via the Solution Explorer context menu item Configure Tasks. |
| launch.vs.json | Specify command line arguments for the debugger. Accessed via the Solution Explorer context menu item Debug and Launch Settings. |
Configure code navigation with CppProperties.json
For IntelliSense and browsing behavior such as Go to Definition to work correctly, Visual Studio needs to know which compiler you are using, where the system headers are, and where any additional include files are located if they are not directly in the folder you have opened (the workspace folder). To specify a configuration, you can choose Manage Configurations from the dropdown in the main toolbar:
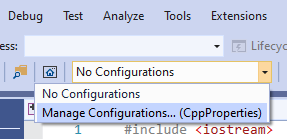
Visual Studio offers the following default configurations:

If, for example, you choose x64-Debug, Visual Studio creates a file called CppProperties.json in your root project folder:
{
  "configurations": [
    {
      "inheritEnvironments": [
        "msvc_x64"
      ],
      "name": "x64-Debug",
      "includePath": [
        "${env.INCLUDE}",
        "${workspaceRoot}\\**"
      ],
      "defines": [
        "WIN32",
        "_DEBUG",
        "UNICODE",
        "_UNICODE"
      ],
      "intelliSenseMode": "windows-msvc-x64"
    }
  ]
}
This configuration inherits the environment variables of the Visual Studio x64 Developer Command Prompt. One of those variables is INCLUDE and you can refer to it here by using the ${env.INCLUDE} macro. The includePath property tells Visual Studio where to look for all the sources that it needs for IntelliSense. In this case, it says "look in the all the directories specified by the INCLUDE environment variable, and also all the directories in the current working folder tree." The name property is the name that will appear in the dropdown, and can be anything you like. The defines property provides hints to IntelliSense when it encounters conditional compilation blocks. The intelliSenseMode property provides some additional hints based on the compiler type. Several options are available for MSVC, GCC, and Clang.
Note
If Visual Studio seems to be ignoring settings in CppProperties.json, try adding an exception to your .gitignore file like this: !/CppProperties.json.
Default configuration for MinGW-w64
If you add the MinGW-W64 configuration, the JSON looks this:
{
  "configurations": [
    {
      "inheritEnvironments": [
        "mingw_64"
      ],
      "name": "Mingw64",
      "includePath": [
        "${env.INCLUDE}",
        "${workspaceRoot}\\**"
      ],
      "intelliSenseMode": "linux-gcc-x64",
      "environments": [
        {
          "MINGW64_ROOT": "C:\\msys64\\mingw64",
          "BIN_ROOT": "${env.MINGW64_ROOT}\\bin",
          "FLAVOR": "x86_64-w64-mingw32",
          "TOOLSET_VERSION": "9.1.0",
          "PATH": "${env.BIN_ROOT};${env.MINGW64_ROOT}\\..\\usr\\local\\bin;${env.MINGW64_ROOT}\\..\\usr\\bin;${env.MINGW64_ROOT}\\..\\bin;${env.PATH}",
          "INCLUDE": "${env.MINGW64_ROOT}\\include\\c++\\${env.TOOLSET_VERSION};${env.MINGW64_ROOT}\\include\\c++\\${env.TOOLSET_VERSION}\\tr1;${env.MINGW64_ROOT}\\include\\c++\\${env.TOOLSET_VERSION}\\${env.FLAVOR}",
          "environment": "mingw_64"
        }
      ]
    }
  ]
}
Note the environments block. It defines properties that behave like environment variables and are available not only in the CppProperties.json file, but also in the other configuration files task.vs.json and launch.vs.json. The Mingw64 configuration inherits the mingw_w64 environment, and uses its INCLUDE property to specify the value for includePath. You can add other paths to this array property as needed.`
The intelliSenseMode property is set to a value appropriate for GCC. For more information on all these properties, see CppProperties schema reference.
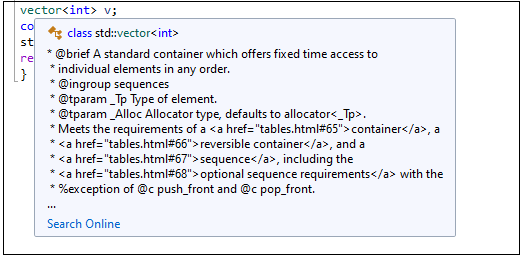
When everything is working correctly, you will see IntelliSense from the GCC headers when you hover over a type:
Enable IntelliSense diagnostics
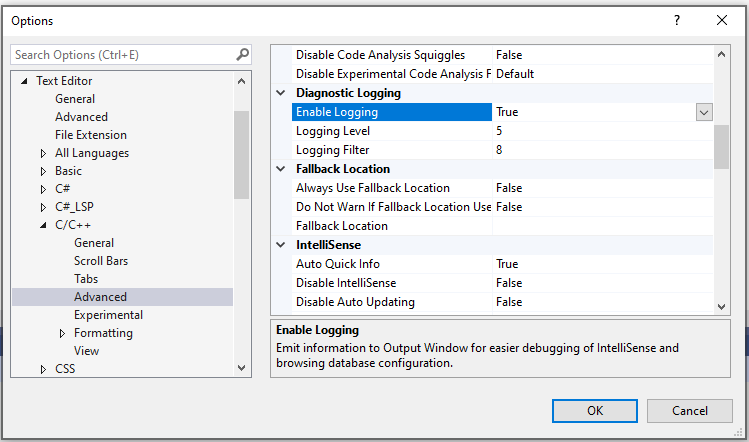
If you are not seeing the IntelliSense that you expect, you can troubleshoot by going to Tools > Options > Text Editor > C/C++ > Advanced and setting Enable Logging to true. To start with, try setting Logging Level to 5, and Logging Filters to 8.
Output is piped to the Output Window and is visible when you choose *Show Output From: Visual C++ Log. The output contains, among other things, the list of actual include paths that IntelliSense is trying to use. If the paths do not match the ones in CppProperties.json, try closing the folder and deleting the .vs subfolder which contains cached browsing data.
Define build tasks with tasks.vs.json
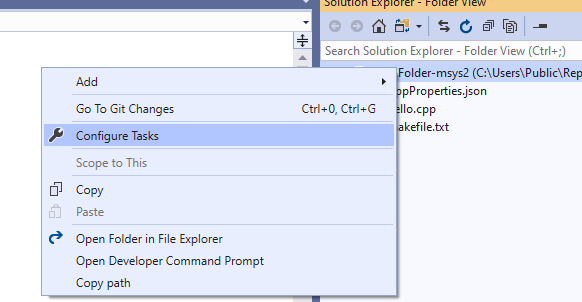
You can automate build scripts or any other external operations on the files you have in your current workspace by running them as tasks directly in the IDE. You can configure a new task by right-clicking on a file or folder and selecting Configure Tasks.
This creates (or opens) the tasks.vs.json file in the .vs folder which Visual Studio creates in your root project folder. You can define any arbitrary task in this file and then invoke it from the Solution Explorer context menu. To continue the GCC example, the following snippet shows a complete tasks.vs.json file with as single task that invokes g++.exe to build a project. Assume the project contains a single file called hello.cpp.
{
  "version": "0.2.1",
  "tasks": [
    {
      "taskLabel": "build hello",
      "appliesTo": "/",
      "type": "default",
      "command": "g++",
      "args": [
        "-g",
        "-o",
        "hello",
        "hello.cpp"
      ]
    }
  ]
}
The JSON file is placed in the .vs subfolder. To see that folder, click on the Show All Files button at the top of Solution Explorer. You can run this task by right-clicking on the root node in Solution Explorer and choosing build hello. When the task completes you should see a new file, hello.exe in Solution Explorer.
You can define many kinds of tasks. The following example shows a tasks.vs.json file that defines a single task. taskLabel defines the name that appears in the context menu. appliesTo defines which files the command can be performed on. The command property refers to the COMSPEC environment variable, which identifies the path for the console (cmd.exe on Windows). You can also reference environment variables that are declared in CppProperties.json or CMakeSettings.json. The args property specifies the command line to be invoked. The ${file} macro retrieves the selected file in Solution Explorer. The following example will display the filename of the currently selected .cpp file.
{
  "version": "0.2.1",
  "tasks": [
    {
      "taskLabel": "Echo filename",
      "appliesTo": "*.cpp",
      "type": "command",
      "command": "${env.COMSPEC}",
      "args": ["echo ${file}"]
    }
  ]
}
After saving tasks.vs.json, you can right-click any .cpp file in the folder, choose Echo filename from the context menu, and see the file name displayed in the Output window.
For more information, see Tasks.vs.json schema reference.
Configure debugging parameters with launch.vs.json
To customize your program's command line arguments and debugging instructions, right-click on the executable in Solution Explorer and select Debug and Launch Settings. This will open an existing launch.vs.json file, or if none exists, it will create a new file with a set of minimal launch settings. First you are given a choice of what kind of debug session you want to configure. For debugging a MinGw-w64 project, we choose C/C++ Launch for MinGW/Cygwin (gdb). This creates a launch configuration for using gdb.exe with some educated guesses about default values. One of those default values is MINGW_PREFIX. You can substitute the literal path (as shown below) or you can define a MINGW_PREFIX property in CppProperties.json:
{
  "version": "0.2.1",
  "defaults": {},
  "configurations": [
    {
      "type": "cppdbg",
      "name": "hello.exe",
      "project": "hello.exe",
      "cwd": "${workspaceRoot}",
      "program": "${debugInfo.target}",
      "MIMode": "gdb",
      "miDebuggerPath": "c:\\msys64\\usr\\bin\\gdb.exe",
      "externalConsole": true
    }
  ]
}
To start debugging, choose the executable in the debug dropdown, then click the green arrow:
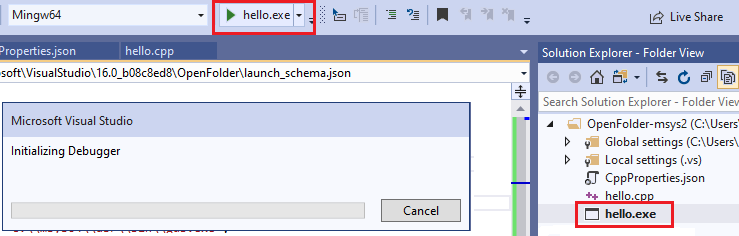
You should see the Initializing Debugger dialog and then an external console window that is running your program.
For more information, see launch.vs.json schema reference.
Launching other executables
You can define launch settings for any executable on your computer. The following example launches 7za and specifies additional arguments, by adding them to the args JSON array:
{
  "version": "0.2.1",
  "defaults": {},
  "configurations": [
    {
      "type": "default",
      "project": "CPP\\7zip\\Bundles\\Alone\\O\\7za.exe",
      "name": "7za.exe list content of helloworld.zip",
      "args": [ "l", "d:\\sources\\helloworld.zip" ]
    }
  ]
}
When you save this file, the new configuration appears in the Debug Target dropdown and you can select it to start the debugger. You can create as many debug configurations as you like, for any number of executables. If you press F5 now, the debugger will launch and hit any breakpoint you may have already set. All the familiar debugger windows and their functionality are now available.
Feedback
Coming soon: Throughout 2024 we will be phasing out GitHub Issues as the feedback mechanism for content and replacing it with a new feedback system. For more information see: https://aka.ms/ContentUserFeedback.
Submit and view feedback for