Microsoft Sentinel integration (Preview)
You can integrate Microsoft Defender for Cloud Apps with Microsoft Sentinel (a scalable, cloud-native SIEM and SOAR) to enable centralized monitoring of alerts and discovery data. Integrating with Microsoft Sentinel allows you to better protect your cloud applications while maintaining your usual security workflow, automating security procedures, and correlating between cloud-based and on-premises events.
Benefits of using Microsoft Sentinel include:
- Longer data retention provided by Log Analytics.
- Out-of-the-box visualizations.
- Use tools such as Microsoft Power BI or Microsoft Sentinel workbooks to create your own discovery data visualizations that fit your organizational needs.
Additional integration solutions include:
- Generic SIEMs - Integrate Defender for Cloud Apps with your generic SIEM server. For information in integrating with a Generic SIEM, see Generic SIEM integration.
- Microsoft security graph API - An intermediary service (or broker) that provides a single programmatic interface to connect multiple security providers. For more information, see Security solution integrations using the Microsoft Graph Security API.
Integrating with Microsoft Sentinel includes configuration in both Defender for Cloud Apps and Microsoft Sentinel.
Prerequisites
To integrate with Microsoft Sentinel:
- You must have a valid Microsoft Sentinel license
- You must be a Global Administrator or a Security Administrator in your tenant.
US Government support
The direct Defender for Cloud Apps - Microsoft Sentinel integration is available to commercial customers only.
However, all Defender for Cloud Apps data is available in Microsoft Defender XDR, and therefore available in Microsoft Sentinel via the Microsoft Defender XDR connector.
We recommend that GCC, GCC High, and DoD customers who are interested in seeing Defender for Cloud Apps data in Microsoft Sentinel install the Microsoft Defender XDR solution.
For more information, see:
- Microsoft Defender XDR integration with Microsoft Sentinel
- Microsoft Defender for Cloud Apps for US Government offerings
Integrating with Microsoft Sentinel
In the Microsoft Defender Portal, select Settings > Cloud Apps.
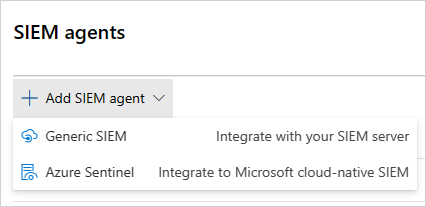
Under System, select SIEM agents > Add SIEM agent > Sentinel. For example:
Note
The option to add Microsoft Sentinel is not available if you have previously performed the integration.
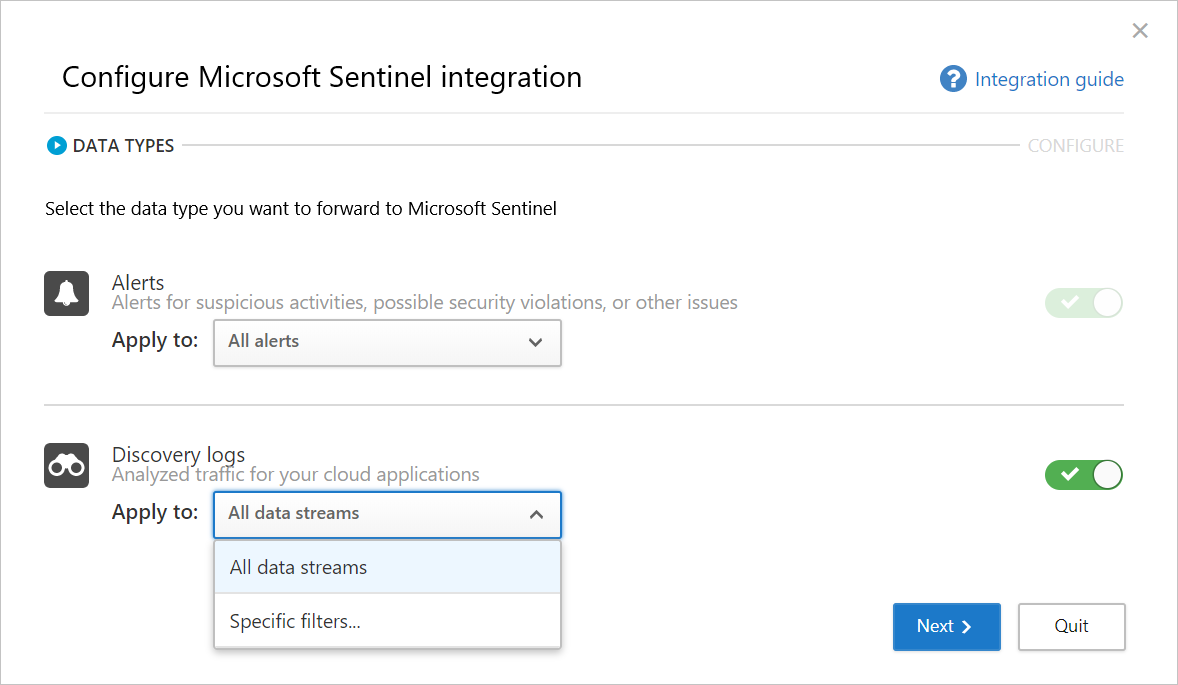
In the wizard, select the data types you want to forward to Microsoft Sentinel. You can configure the integration, as follows:
- Alerts: Alerts are automatically turned on once Microsoft Sentinel is enabled.
- Discovery logs: Use the slider to enable and disable them, by default, everything is selected, and then use the Apply to drop-down to filter which discovery logs are sent to Microsoft Sentinel.
For example:
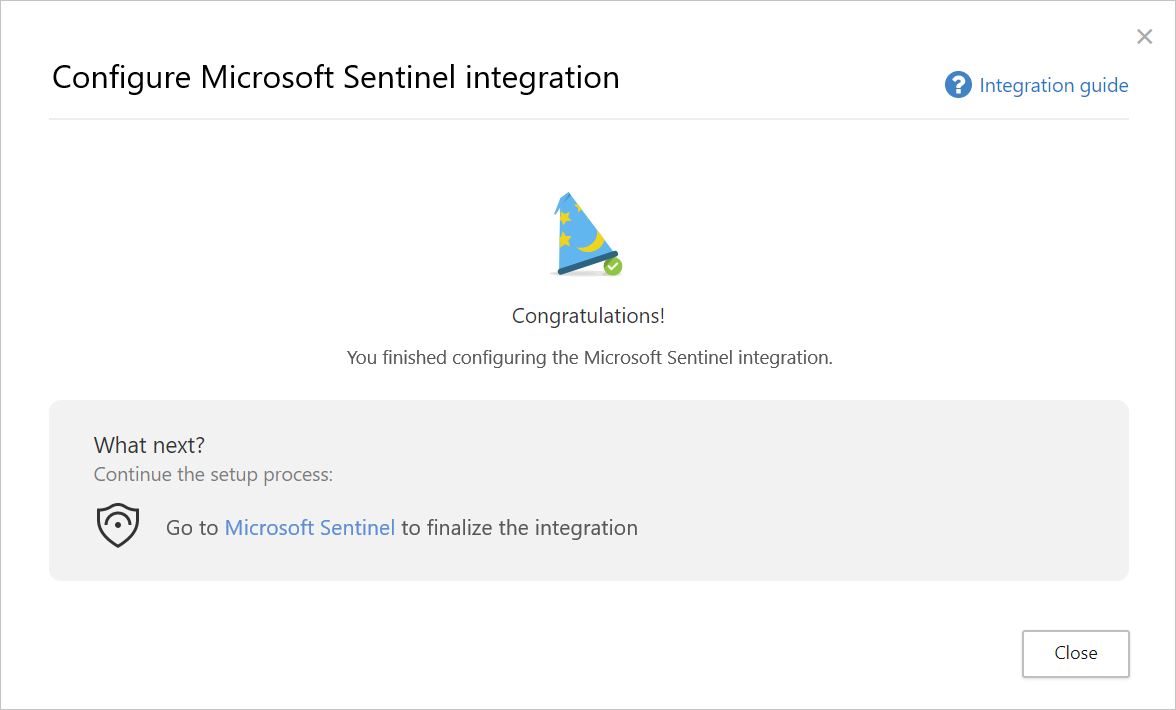
Select Next, and continue to Microsoft Sentinel to finalize the integration. For information on configuring Microsoft Sentinel, see the Microsoft Sentinel data connector for Defender for Cloud Apps. For example:
Note
New discovery logs will usually appear in Microsoft Sentinel within 15 minutes of configuring them in the Defender for Cloud Apps portal. However, it may take longer depending on system environment conditions. For more information, see Handle ingestion delay in analytics rules.
Alerts and discovery logs in Microsoft Sentinel
Once the integration is completed, you can view Defender for Cloud Apps alerts and discovery logs in Microsoft Sentinel.
In Microsoft Sentinel, under Logs, under Security Insights, you can find the logs for the Defender for Cloud Apps data types, as follows:
| Data type | Table |
|---|---|
| Discovery logs | McasShadowItReporting |
| Alerts | SecurityAlert |
The following table describes each field in the McasShadowItReporting schema:
| Field | Type | Description | Examples |
|---|---|---|---|
| TenantId | String | Workspace ID | b459b4u5-912x-46d5-9cb1-p43069212nb4 |
| SourceSystem | String | Source system – static value | Azure |
| TimeGenerated [UTC] | DateTime | Date of discovery data | 2019-07-23T11:00:35.858Z |
| StreamName | String | Name of the specific stream | Marketing Department |
| TotalEvents | Integer | Total number of events per session | 122 |
| BlockedEvents | Integer | Number of blocked events | 0 |
| UploadedBytes | Integer | Amount of uploaded data | 1,514,874 |
| TotalBytes | Integer | Total amount of data | 4,067,785 |
| DownloadedBytes | Integer | Amount of downloaded data | 2,552,911 |
| IpAddress | String | Source IP address | 127.0.0.0 |
| UserName | String | User name | Raegan@contoso.com |
| EnrichedUserName | String | Enriched user name with Microsoft Entra username | Raegan@contoso.com |
| AppName | String | Name of cloud app | Microsoft OneDrive for Business |
| AppId | Integer | Cloud app identifier | 15600 |
| AppCategory | String | Category of cloud app | Cloud storage |
| AppTags | String array | Built-in and custom tags defined for the app | ["sanctioned"] |
| AppScore | Integer | The risk score of the app in a scale 0-10, 10 being a score for a non-risky app | 10 |
| Type | String | Type of logs – static value | McasShadowItReporting |
Use Power BI with Defender for Cloud Apps data in Microsoft Sentinel
Once the integration is completed, you can also use the Defender for Cloud Apps data stored in Microsoft Sentinel in other tools.
This section describes how you can use Microsoft Power BI to easily shape and combine data to build reports and dashboards that meet the needs of your organization.
To get started:
In Power BI, import queries from Microsoft Sentinel for Defender for Cloud Apps data. For more information, see Import Azure Monitor log data into Power BI.
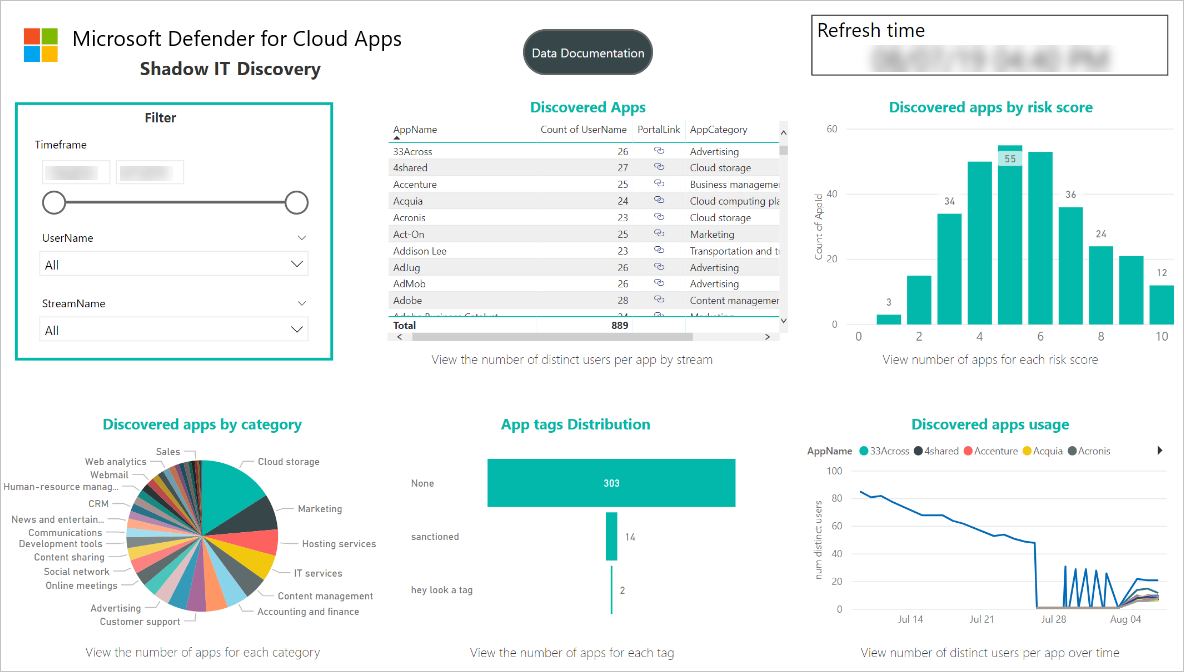
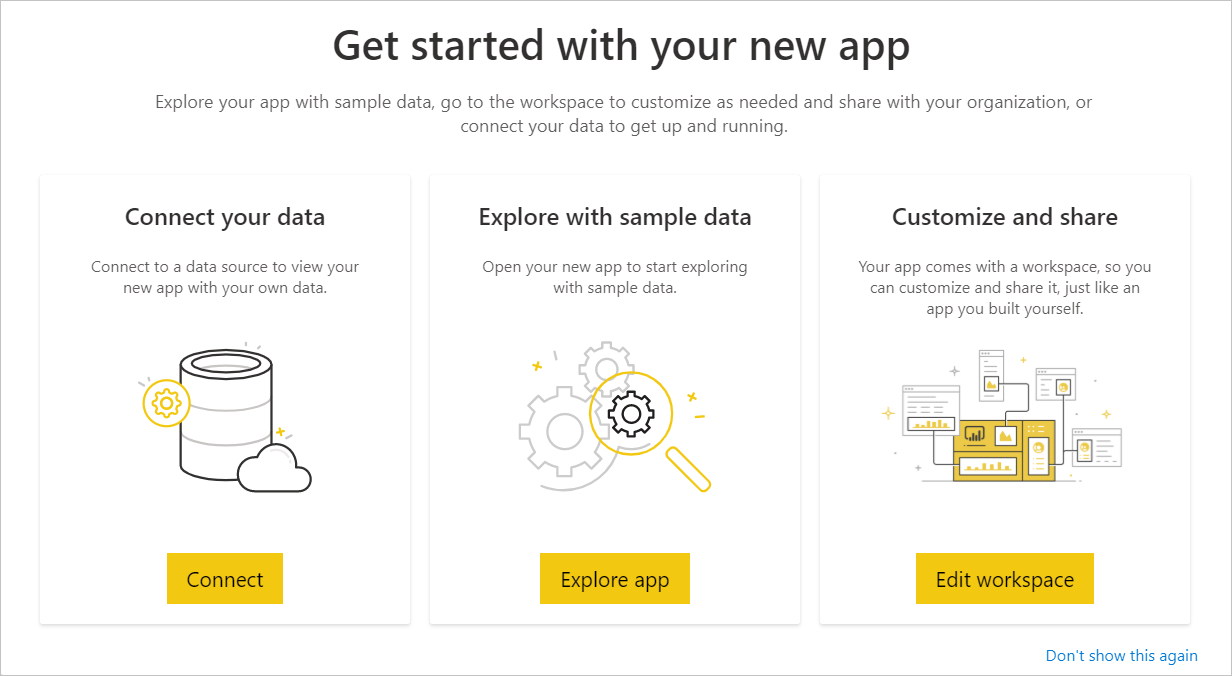
Install the Defender for Cloud Apps Shadow IT Discovery app and connect it to your discovery log data to view the built-in Shadow IT Discovery dashboard.
Note
Currently, the app is not published on Microsoft AppSource. Therefore, you may need to contact your Power BI admin for permissions to install the app.
For example:
Optionally, build custom dashboards in Power BI Desktop and tweak it to fit the visual analytics and reporting requirements of your organization.
Connect the Defender for Cloud Apps app
In Power BI, select Apps > Shadow IT Discovery app.
On the Get started with your new app page, select Connect. For example:
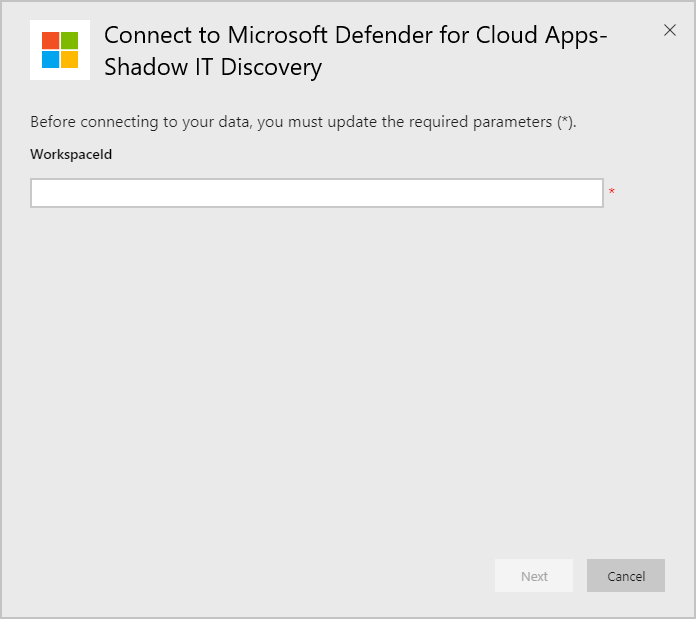
On the workspace ID page, enter your Microsoft Sentinel workspace ID as displayed in your log analytics overview page, and then select Next. For example:
On the authentication page, specify the authentication method and privacy level, and then select Sign in. For example:

After connecting your data, go to the workspace Datasets tab and select Refresh. This will update the report with your own data.
If you run into any problems, we're here to help. To get assistance or support for your product issue, please open a support ticket.
Feedback
Coming soon: Throughout 2024 we will be phasing out GitHub Issues as the feedback mechanism for content and replacing it with a new feedback system. For more information see: https://aka.ms/ContentUserFeedback.
Submit and view feedback for