Diagnose issues and analyze performance by using Trace parser
This article explains how you can use the Trace parser to consume traces and analyze performance in your deployment. You can use the Trace Parser to find and diagnose various types of errors. You can also use the tool to visualize execution of X++ methods, as well as the execution call tree.
Note
There are features in the Trace parser that are similar to Microsoft Dynamics AX 2012. See the Dynamics Ax Performance Team Blog for more information.
Finding the Trace parser
Trace parser should be preinstalled with your developer deployment or VHD. The install location is here: C:\Program Files (x86)\Microsoft Dynamics Trace Parser. If it's not installed, you can run the installer from C:\PerfSDK\PerfTools\traceparser.msi.
Capturing events
There are two ways that you can obtain the data that you will analyze in the Trace parser. They include:
Capture events from the local installation.
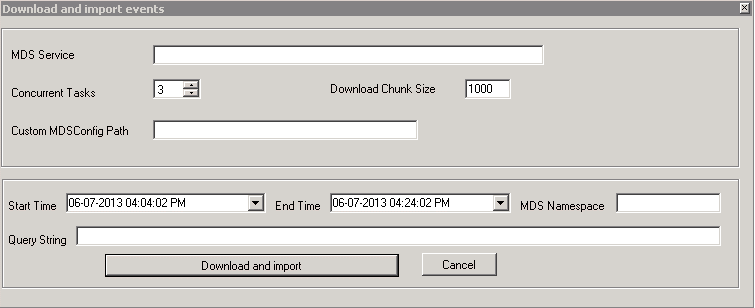
- If the Select Trace window isn’t already open, go to the File menu and click Open trace. In the Select Trace window, click Capture Events. After selecting your providers, click Start. The Trace Parser tool will start listening to all the providers and capturing the events. Capturing stops when you click Stop and Import.
Open an existing ETL (Windows Event) file that was captured using tools such as Logman.
Viewing traces
Timeline view The Timeline tab is the first tab that you see after you import a trace into the Trace Parser. This tab is shown in the following illustration.
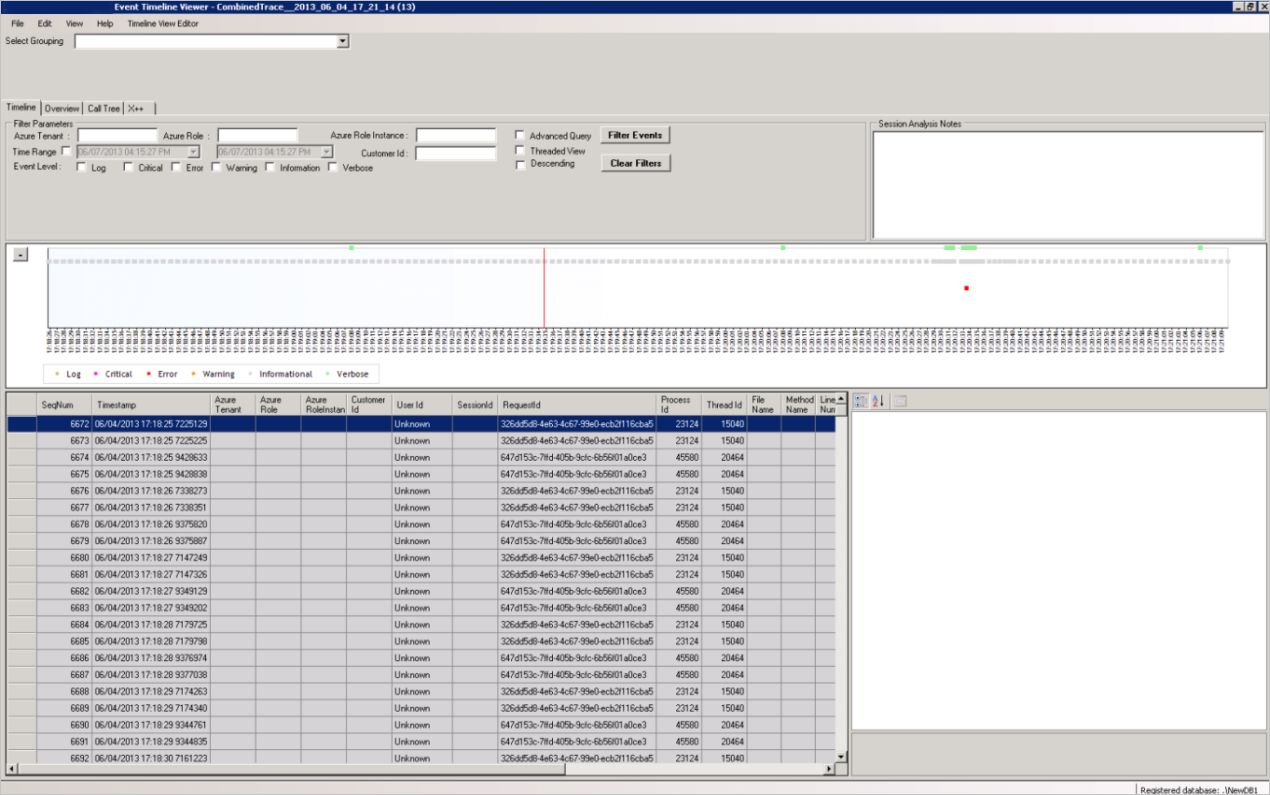
The Timeline tab has the following major components:
- The Select Grouping drop-down allows you to group based on a variety of categories, such as Customer ID, Username, Session Name, etc. Groupings will display maximum and minimum timestamp of events, total number of events, and lowest event level within the grouping.
- List of all events in a threaded or unthreaded view.
- Property grid displayed for the selected event.
- Timeline chart for all the selected events.
- Filtering of events.
- Session analysis notes.
Call tree view By selecting the Call Tree tab, you can see the call tree for all X++ methods. The tab is shown below.
Example of information shown in the Call Tree tab](./media/3_desktop.png)
Similarly, you can display the X++ tab to view a list of all the X++ methods. They will be sorted by fields such as Inclusive/Exclusive durations, RPC, or Database calls. Note that these are similar to the corresponding tabs in Trace Parser and have the same behavior.
Additional resources
Feedback
Coming soon: Throughout 2024 we will be phasing out GitHub Issues as the feedback mechanism for content and replacing it with a new feedback system. For more information see: https://aka.ms/ContentUserFeedback.
Submit and view feedback for