Capture a trace
This tutorial provides guidelines for taking traces in Microsoft Dynamics 365 finance and operations apps.
In this tutorial, you take a tour of the process of collecting and downloading traces. The Trace parser tool works much like the Microsoft Dynamics AX 2012 version, but it isn't backward compatible and can't be used to analyze AX 2012 traces. You can find the tool in your development environments. On the Windows Start menu, select Microsoft Dynamics Trace Parser. Alternatively, open C:\Program Files (x86)\Microsoft Dynamics Trace Parser\Microsoft.Dynamics.AX.Tracing.TraceParser.exe.
Prerequisites
This tutorial requires that you access the environment as an administrator on the instance. The administrator can also grant rights to other users to take a trace. In this way, you can trace scenarios that can't be reproduced with administrative rights.
Capture a trace - Client
On the navigation bar, select Help, and then select Trace.
In the Trace name field, enter a name for the trace that you're about to capture.
As required, set the Include SQL parameter value option to Yes.
Select Start trace.
Perform actions that must be analyzed, such as navigation to Accounts payable > Vendors > All vendors.
When you've finished, select Stop trace.
After the trace has stopped, select one of the following options. (For this tutorial, select the second option.)
Download trace – Store the captured trace on a local machine. You can analyze a downloaded trace by using the desktop version of Trace parser.
Note
If you download a trace, it won't be available for later upload.
Upload trace – Store the trace in the cloud for later download by, for example, the admin. Uploaded traces are automatically deleted after seven days. They can also be manually deleted from the Captured traces page.
Return to main menu – Return to the main tracing menu to start another trace.
Note
If your scenario takes more than one to two minutes, it's better to take multiple smaller traces of 30 seconds each. If a trace is too large, it can't easily be analyzed. There's also a risk of data loss.
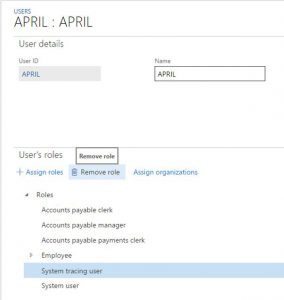
Assign trace rights to a user
To give a user rights to capture a trace, go to System administration > Users > Users.
Select the user and assign the System tracing user role.

Note
To help prevent unwanted tracing, remove the user role after the user has finished tracing.
Open a captured trace
On the navigation bar, select Help, and then select Trace.
Select Captured traces.
Note
The Captured traces button is available only to users who have administrative rights.
Select the name of the trace to download. You can then open and analyze it by using the desktop version of Trace parser. Alternatively, select the user name to access to the user options.
After you download the trace, delete it.
Note
The trace will be deleted after seven days. For more information about the desktop version of Trace parser, see Diagnose issues and analyze performance by using Trace parser.
Capture a trace - Performance Monitor (Cloud-hosted environments\VHDs\on-premises LBD servers)
You can capture a trace by using Windows Performance Monitor. This option is available only in cloud-hosted environments, on development virtual hard disks (VHDs), and on on-premises servers (also known as local business data [LBD] servers).
To capture a trace by using Performance Monitor, follow these steps.
Use Remote Desktop to access the cloud-hosted environment, development VHD, or on-premises Application Object Server (AOS) mode (Batch\Interactive) that you want to collect event traces from.
Open Windows Performance Monitor (perfmon.msc), and add a new user-defined data collector set.
Give the data collector set a name, and select the Create manually option. (After you create a template by completing the manual steps, you'll be able to select the Create from a template option.)
Select Next.
Select the Create data logs option, select the Event trace data checkbox, and then select Next.
Select Add, and select the following providers in the Event trace provider list:
- Microsoft-Dynamics-AX-ExecutionTraces
- Microsoft-Dynamics-AX-FormServer
- Microsoft-Dynamics-AX-XppExecutionTraces
Select OK.
Select Next, and specify a directory for storing trace files. Alternatively, keep the default directory.
Select Save and close, and then select Finish.
Change the settings for the newly created data collector by following these steps:
Select the new user-defined trace, select and hold (or right-click) DataCollector01, and then select Properties.
In the Properties dialog box, on the Trace buffers tab, edit the default buffer values. The default values don't work well for collecting Dynamics 365 event trace data when there's a high volume of events during a short period. We recommend that you use the following values. (Leave all other fields set to their default value.)
- Buffer size: 512 KB
- Minimum buffers: 256
- Maximum buffers: 256
Start or stop collecting Dynamics 365 Finance event traces by selecting Start/Stop on the Performance monitor toolbar.
Save the data collector set as a template
You might want to save your data collector set as a template and reuse it on a different server.
- Select and hold (or right-click) Data collector sets, and then select Save template.
- You can now copy and import the template XML file.
Limit the trace file size
By setting a maximum file size, you help make the traces more manageable when you import them into the Trace parser tool. You can set the data collector properties to restart after a specified number of megabytes (MB).
Follow these steps to set the file size to 1,000 MB (1 gigabyte [GB]).
- Select and hold (or right-click) the user-defined trace, and then select Properties.
- In the Properties dialog box, on the Stop condition tab, select the Restart the data collector set at limits checkbox.
- In the Maximum size field, enter 1000.
After the trace reaches its maximum size, it starts to write again on top of the same file. If you want the trace to create additional files, follow these steps.
- Select the new user-defined trace, select and hold (or right-click) DataCollector01, and then select Properties.
- In the Properties dialog box, on the File tab, select the Circular (requires a non-zero maximum file size) checkbox.
Additional notes
Before you start a trace, ensure that your scenario is in a warm state. In other words, run the scenario that you want to trace one time before you take the trace. In this way, you help prevent events such as metadata loading, uncached queries, and other warm-up tasks from being saved.
Feedback
Coming soon: Throughout 2024 we will be phasing out GitHub Issues as the feedback mechanism for content and replacing it with a new feedback system. For more information see: https://aka.ms/ContentUserFeedback.
Submit and view feedback for