Debug with Visual Studio Code
In the previous exercise, you learned the importance of being able to run your code step by step with the debugger provided in Node.js. For your work on the Tailwind Traders application, you'll need a more comprehensive debugging environment inside your IDE (Integrated Development Environment).
Let's discover how you can configure the Visual Studio Code debugger to use it with Node.js.
How to use Visual Studio Code for Node.js debugging
In Visual Studio Code, the debugger is accessed from the Run tab.
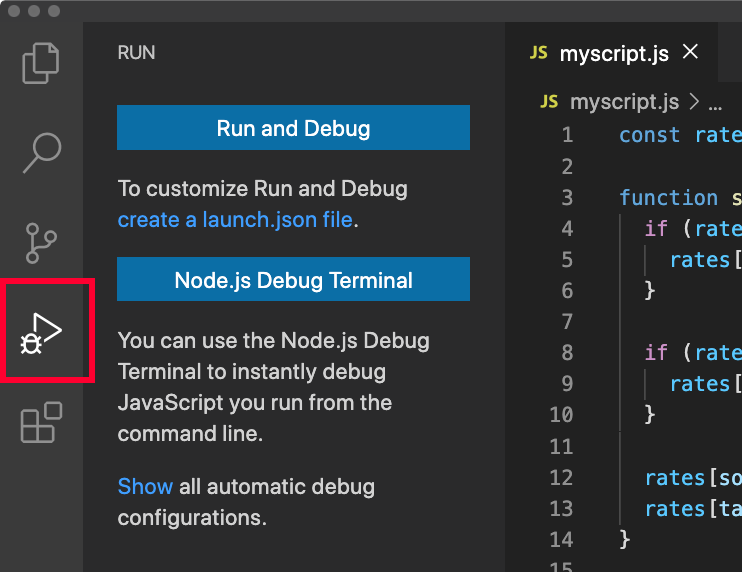
If you have a
.jsfile open in the editor window, you can select Run and Debug and then select Node.js to directly debug the open JavaScript file.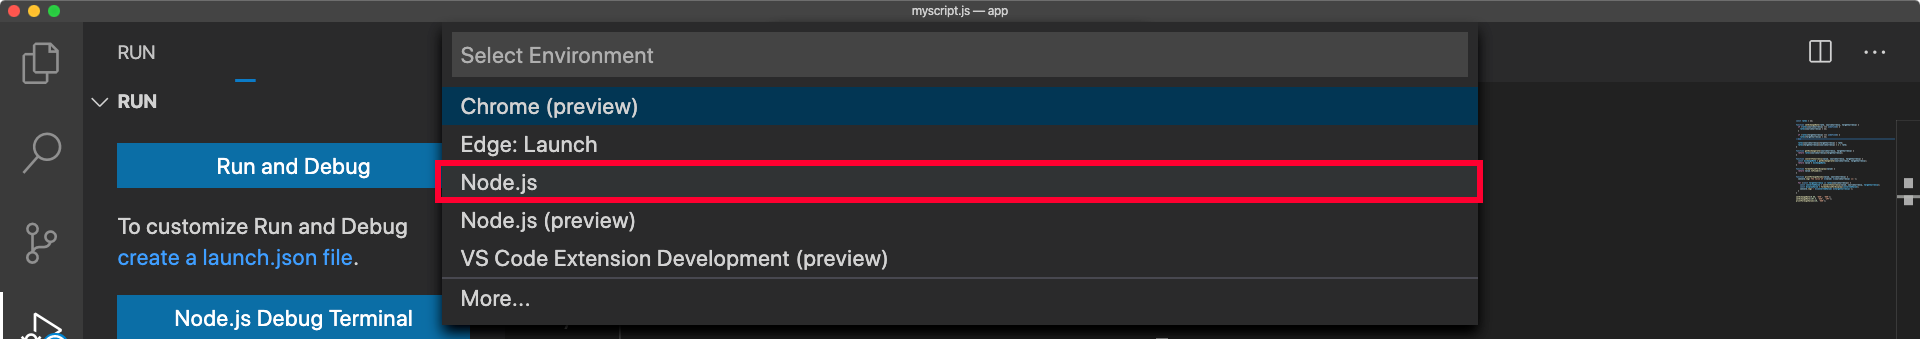
There are several other ways to start debugging in Visual Studio Code. For the next exercise, we’ll use a launch.json file. Development teams often use a launch.json file to customize the run configuration. With the configuration specified in a .json file, you can check it into source control. From source control, you can share the configuration across your team.
Control the flow by adding breakpoints
Unlike the built-in Node.js command-line debugger, the Visual Studio Code debugger immediately starts executing your code. If your program ends quickly, you might not have the chance to interact with the debugger. That's why you might want to add breakpoints before you run the code. We’ll add and remove a few breakpoints in the next exercise.
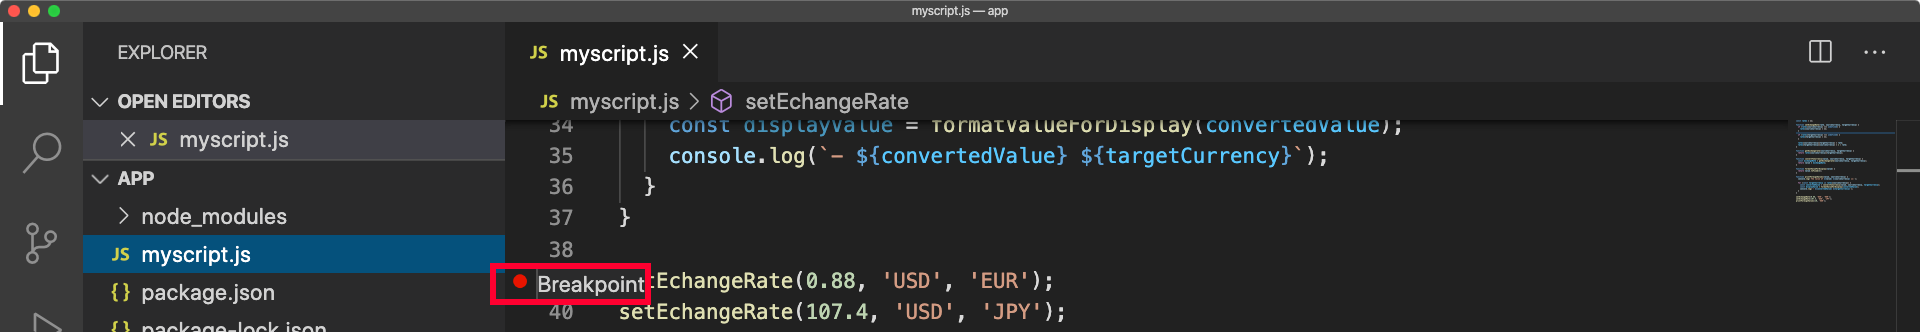
To add a breakpoint in your code, find the line of code in your JavaScript (.js) file where you want to add a break. Next to the line number for the code statement, select in the left margin. When the breakpoint is added, you'll see a red circle next to the line number. To remove the breakpoint, select the red circle.
You can also use the right-click context menu to add a breakpoint. The content menu includes the Add Conditional Breakpoint option, where you enter a condition for breaking the code execution. A conditional breakpoint is only active when the specified condition is met.
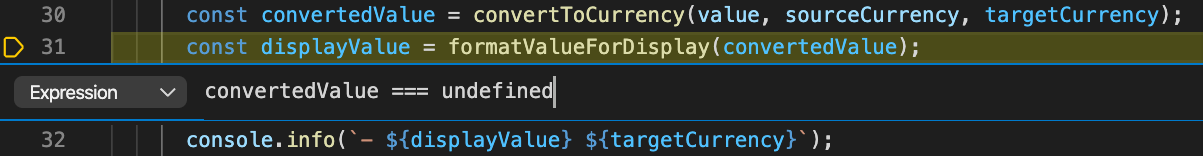
This breakpoint stops execution only when the value of convertedValue is undefined.
Visual Studio Code debugger overview
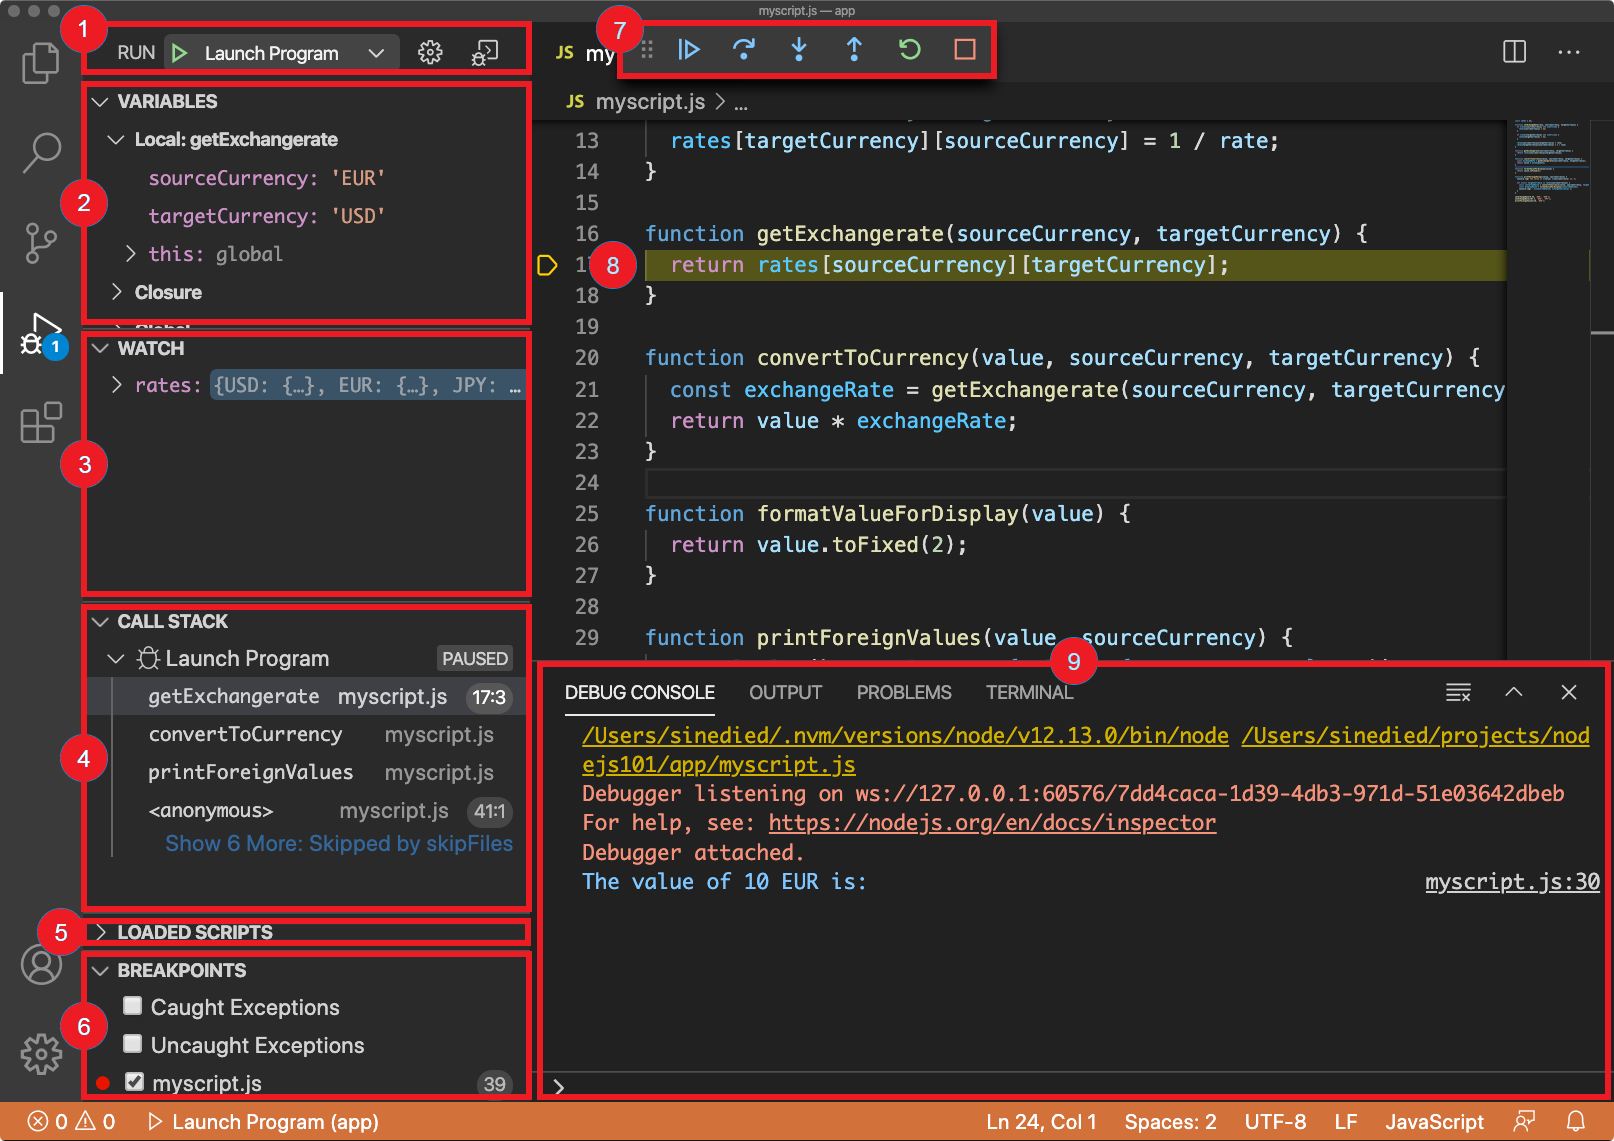
After you set up your breakpoints and start your app, new information panels and controls appear on the screen.
| Number | Name | Description |
|---|---|---|
| 1. | Debugger launch controls | At the top of the sidebar, you can find the launch controls. |
| 2. | Variables state | The Variables panel shows the current state of your variables. |
| 3. | Watched variables state | The Watch panel shows the current state of your watched variables. |
| 4. | Current call stack | The Call stack panel shows the current call stack. |
| 5. | Loaded script files | The Loaded script files panel shows the JavaScript files that have been loaded so far. |
| 6. | Breakpoints | The Breakpoints panel shows all the breakpoints you placed in your code. |
| 7. | Execution controls | You can control the execution flow of your program by using these controls. |
| 8. | Current execution step | The current execution step is highlighted in the editor window. |
| 9. | Debug console | The Debug Console can be used to visualize your application console logs, and to evaluate expressions or execute code in the current execution context. |
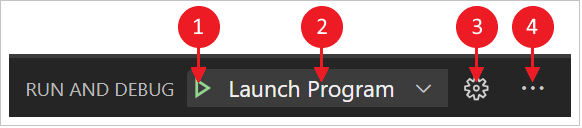
Debugger launch controls
At the top of the sidebar, you can find the launch controls:
| Number | Name | Description |
|---|---|---|
| 1. | Start debugging | Start debugging your application. |
| 2. | Select the active launch configuration | Select the active launch configuration. |
| 3. | Edit the launch.json file |
Edit the launch.json file. Create the json file if you need to. |
| 4. | Open the Debug Console | Open the Debug Console, and toggle visibility of the Variables, Watch, Call Stack, and Breakpoints panels.. |
View and edit your variables state
When you analyze the cause of a program defect, watch your variables state to look for unexpected changes. You can use the Variables panel to do that.
Your variables are shown organized by scope:
| Scope | Description |
|---|---|
| Local | Local variables are accessible in the current scope, usually the current function. |
| Global | Global variables are accessible from everywhere in your program. System objects from the JavaScript runtime are also included, so don't be surprised if you see a lot of stuff in there. |
| Closure | Closure variables are accessible from the current closure, if any. A closure combines the local scope of a function with the scope from the outer function it belongs to. |
Possible actions include:
Unfold scopes: You can unfold scopes and variables by selecting the arrow. When you unfold objects, you can see all the properties defined in this object.
Change variable value: It's possible to change the value of a variable on the fly by double-clicking the variable.
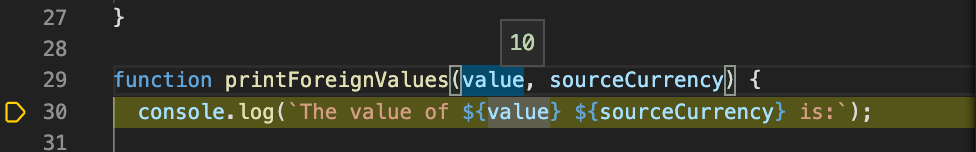
Peek at a variable: By hovering over a function parameter or a variable directly in the editor window, you can also peek at its value.
Watch variables
If you want to track a variable state across time or different functions, it can be tedious to search for it every time. That's where the Watch panel comes in handy.
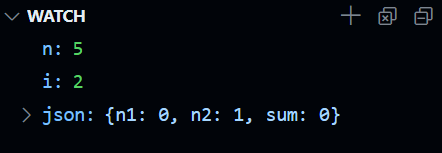
You can select the plus button to enter a variable name or an expression to watch. As an alternative, you can right-click a variable in the Variables pane, and select Add to watch.
All expressions inside the watch pane will be updated automatically as your code runs.
Call stack
Every time your program enters a function, an entry is added to the call stack. When your application becomes complex, and you have functions called within functions many times, the call stack represents the trail of functions calls.
It's useful to find the source of an exception. If you have an unexpected crash in your program, you'll often see something like this in the console:
/Users/learn/nodejs/index.js:22
  return value.toFixed(2);
               ^
TypeError: Cannot read property 'toFixed' of undefined
    at formatValueForDisplay (/Users/learn/nodejs/index.js:22:16)
    at printForeignValues (/Users/learn/nodejs/index.js:31:28)
    at Object.<anonymous> (/Users/learn/nodejs/index.js:39:1)
    at Module._compile (internal/modules/cjs/loader.js:956:30)
    at Object.Module._extensions..js (internal/modules/cjs/loader.js:973:10)
    at Module.load (internal/modules/cjs/loader.js:812:32)
    at Function.Module._load (internal/modules/cjs/loader.js:724:14)
    at Function.Module.runMain (internal/modules/cjs/loader.js:1025:10)
    at internal/main/run_main_module.js:17:11
The group of at [...] lines under the error message is called a stack trace. The stack trace gives the name and origin of every function that was called before ending up with the exception. It can be a bit difficult to decipher though, because it also includes internal functions from the Node.js runtime.
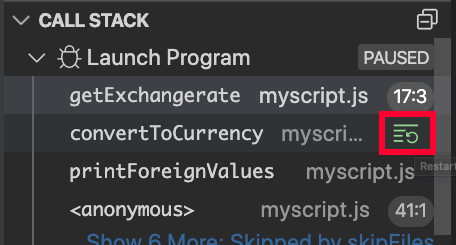
That's where the Visual Studio Code Call stack panel comes in handy. It filters out unwanted information to show you only the relevant functions from your own code by default. You then can unwind this call stack to find out where the exception originated from.
To help you even more, you can select the Restart frame button that appears when you hover a function name in the stack. It will rewind the execution back to the beginning of that function by actually restarting your program up to that point.
View loaded script files
This panel displays all the JavaScript files that have been loaded so far. In large projects, sometimes it can be useful to check which file the current code is executing from.
Breakpoints
In the Breakpoints panel, you can see and toggle all the breakpoints you placed in your code. You can also toggle options to break on caught or uncaught exceptions. You can use the Breakpoints pane to examine your program state and trace back the source of an exception by using the Call stack when one occurs.
Control execution
You can control the execution flow of your program by using these controls.

From left to right, the controls are:
- Continue or pause execution. If execution is paused, it will continue until the next breakpoint is hit. If your program is running, the button switches to a pause button that you can use to pause execution.
- Step over. Executes the next code statement in the current context (same as the
nextcommand in the built-in debugger). - Step into. Like Step over, but if the next statement is a function call, move on to the first code statement of this function (same as the
stepcommand). - Step out. If you're inside a function, execute the remaining code of this function and jump back to the statement after the initial function call (same as the
outcommand). - Restart. Restart your program from the beginning.
- Stop. End the execution and leave the debugger.
Use the debug console
The debug console can be shown or hidden by pressing Ctrl+Shift+Y (Windows, Linux) or Cmd+Shift+Y (Mac). It can be used to visualize your application console logs, and to evaluate expressions or execute code in the current execution content, like the exec command in the built-in Node.js debugger.
You can enter a JavaScript expression in the input field at the bottom of the debug console. Then, press Enter to evaluate it. The result displays directly in the console.
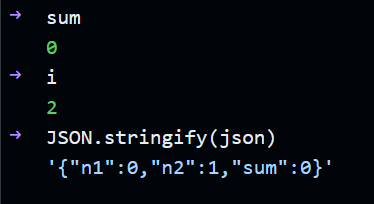
This way, you can quickly check a variable value, test a function with different values, or alter the current state.
Add logpoints instead of console.log
Linters will flag console.log statements as errors. In order to get the same effect as console.log statements, use Visual Studio Code logpoints instead, which print out to the Debug console.
Add a logpoint by right-clicking in the same area that you used to add a breakpoint, then select Add logpoint. Enter a message to display at that point in your code.
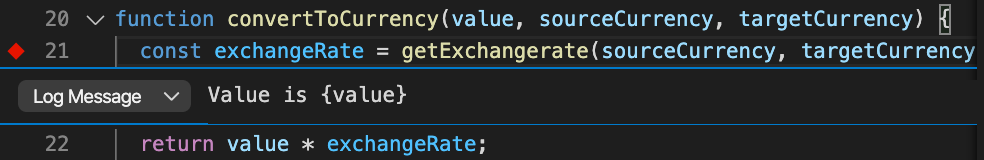
Like breakpoints, logpoints don't alter your code in any way, and are used only during debugging. You don't have an excuse anymore to let that forgotten console.log('here') slip to production.