Monitor VMs and containers by using insights
Your organization has migrated several applications from on-premises to Azure virtual machines (VMs) and Azure Kubernetes Service (AKS). Several hundred Azure resources are now deployed across several Azure subscriptions.
You must track resource usage to ensure that cloud resources are adequately provisioned and their performance meets business requirements. You need a monitoring approach that provides broad visibility and the capability to triage and isolate problems quickly.
This unit explains how to use Azure Monitor insights and other tools for an at-scale monitoring view across all your VM and container resources. You also learn how to drill into specific nodes and containers for troubleshooting.
Azure Monitor insights
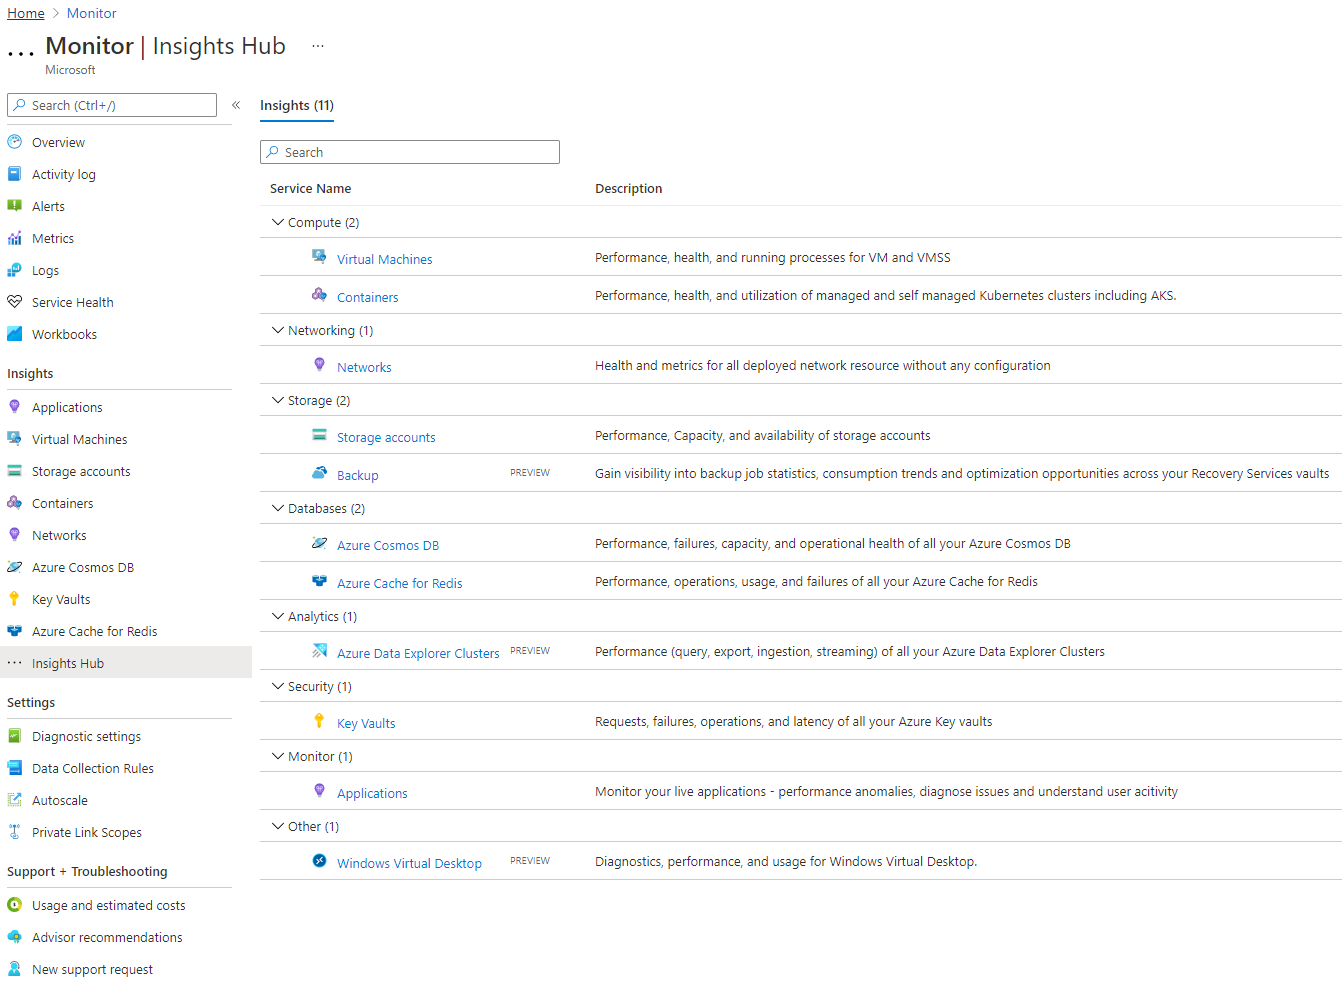
You can use Azure Monitor insights to monitor resource utilization and performance at scale with guided troubleshooting to triage and isolate issues. This unit focuses on VM insights and container insights, but insights exist for other Azure resources, including networks, storage accounts, and Azure Cosmos DB databases. For a complete list of available insights, select Insights Hub in the Azure Monitor left navigation.
Azure Monitor VM insights
VM insights is an Azure Monitor feature that helps get you started monitoring your VM clients by collecting a set of commonly used metrics and sending them to a Log Analytics workspace. You can use Azure Monitor VM insights to:
- View your VMs' health and performance.
- Monitor your VMs at scale across multiple subscriptions and resource groups.
- Get a topology view that shows the processes and network connection details of your VMs and virtual machine scale sets.
To enable Azure Monitor VM insights, select Virtual Machines from the Azure Monitor left navigation, and then select Configure Insights on the Get started tab. In the Not monitored section of the Overview tab, select the VMs and virtual machine scale sets to monitor, and then select Enable.
Enabling VM insights adds extensions and configuration to your VMs and virtual machine scale sets that collect, store, and display a predetermined set of usage and performance measurements.
Monitor your VMs at scale
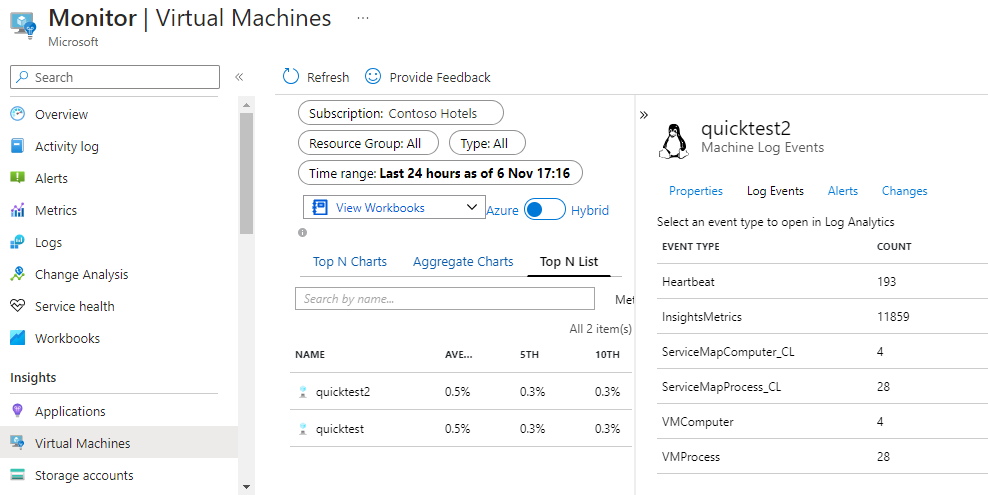
Once enabled, VM insights monitors VM and virtual machine scale set usage and performance. Select the VM insights Performance tab to see the Top N Charts and Top N List that show VM resource usage.
These charts allow you to quickly identify outliers and hot spots where the allocated resources might be insufficient to support the existing load. From the Top N List, you can select a VM to access more details, such as its properties, links to other workbooks, collected logs, and alerts.
You can drill down into Azure Monitor Logs by selecting an event type from the list in Log Events. The relevant Log Analytics workspace opens with the appropriate table and filter applied.
The Azure Monitor VM insights Map tab shows network connections for an entire resource group, virtual machine scale set, or individual VM. Use the filters at the top of the view to select the resources of interest.
You can expand the number of processes for a complete list and to view the network connections per process. Select the arrow representing the connection for network usage and performance details.
Azure Monitor container insights
Container insights is a feature of Azure Monitor that monitors the performance and health of container workloads deployed to Azure, including AKS. Container insights collects memory and processor metrics from controllers, nodes, and containers, and gathers container logs. You can use Azure Monitor container insights to:
- View your Kubernetes workloads' health and performance at scale across multiple subscriptions and resource groups.
- Get visibility into memory and processor performance metrics from controllers, nodes, and containers.
- View and store container logs for real-time and historical analysis.
You can enable Azure Monitor container insights when you create an AKS cluster, or by selecting Containers in the Azure Monitor left navigation and then selecting the Unmonitored clusters tab.
Monitor Kubernetes clusters at scale
After you enable container insights, you can view your Kubernetes workloads' performance and resource utilization on the container insights page by Cluster, Node, Controller, or Container. For example, you can:
- Investigate an overutilized node.
- View the state of pods by controller.
- Look at the number of restarts and CPU or memory utilization of a specific container.
The Monitored clusters tab shows an at-scale view of the health and status of all your clusters, nodes, system pods, and user pods. You can filter this view by namespace and use it as a starting point to drill into problem areas. You can also use container insights to access logs and enable recommended alerts.
Azure Monitor managed service for Prometheus
Prometheus is an open-source monitoring system specifically designed for containers and microservices. Prometheus focuses on distributed applications, making it a popular tool for monitoring Kubernetes, distributed services, and containerized microservices.
Azure Monitor managed service for Prometheus is a component of Azure Monitor Metrics that supports open-source querying and visualization tools like PromQL and Grafana. Azure Monitor managed service for Prometheus can collect data from AKS or from any Kubernetes cluster that runs self-managed Prometheus using remote-write. To enable Azure Monitor managed service for Prometheus, you create an Azure Monitor workspace to store the Prometheus metrics.
Integrate with Azure Managed Grafana
Grafana is an open-source visualization and dashboarding platform that's the primary method for visualizing Prometheus metrics. You can connect your Azure Monitor workspace to a Grafana workspace to use your Prometheus metrics data as a data source in a Grafana dashboard.
Azure Managed Grafana is a fully managed implementation of Grafana that offers multiple predefined Grafana dashboards for monitoring Kubernetes and doing full-stack troubleshooting. You can import prebuilt Grafana dashboards that use Prometheus metrics, or you can create custom dashboards. The following screenshot shows an Azure Managed Grafana dashboard that uses AKS monitoring data.
Azure Monitor alerts
Some types of Azure Monitor insights include recommended alert templates, but you can also specify conditions to trigger an alert in your particular environment. You can configure alert rules to monitor your infrastructure's performance and availability, and use alert rules and action rules to dictate how to handle alerts.
You can base Azure Monitor alerts on the same metrics or log data used to populate insights. For example, Azure Monitor can send an alert if a VM exceeds a utilization threshold, or if a specified number of container restarts occur.
You can also specify who should be notified. Insights can send notifications through email or text message, or use runbooks and webhooks to automatically respond to alerts.


