Monitor and audit access to Microsoft Entra integrated enterprise applications
With Microsoft Entra ID reports, you can get the information needed to determine how your environment is doing. With the usage and insights report, you can get an application-centric view of your sign-in data and find answers to the following questions:
- What are the top used applications in the organization?
- What applications have the most failed sign-ins?
- What are the top sign-in errors for each application?
Access the usage and insights report
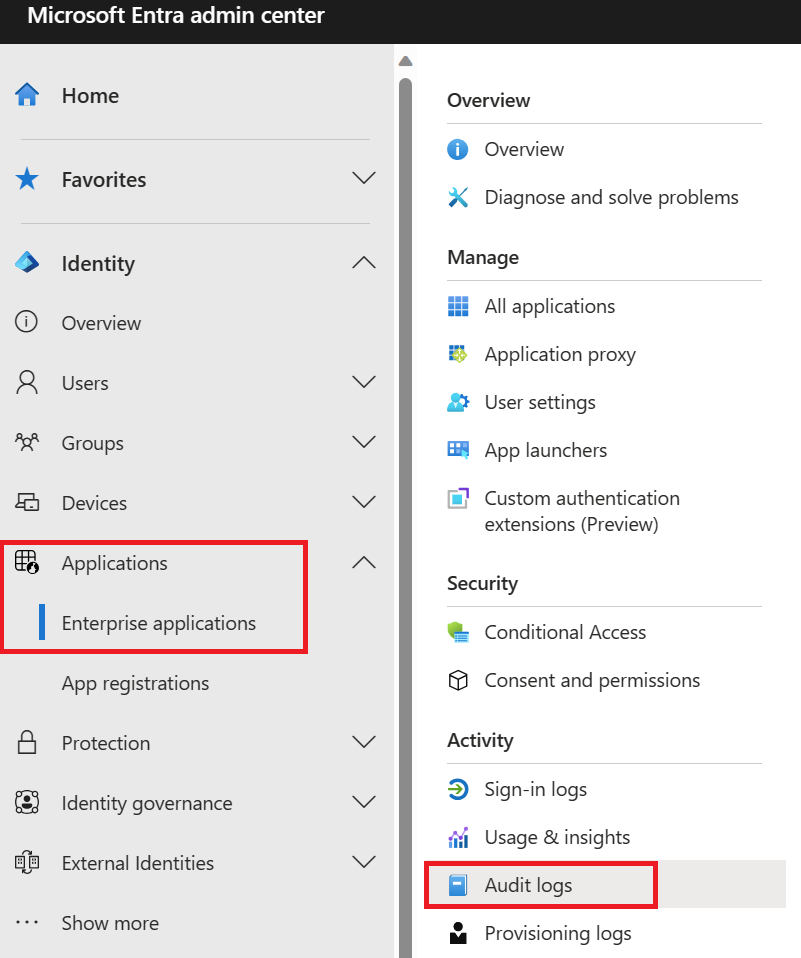
- Navigate to the Microsoft Entra admin center.
- Select the Identity menu, then select Applications and choose Enterprise applications.
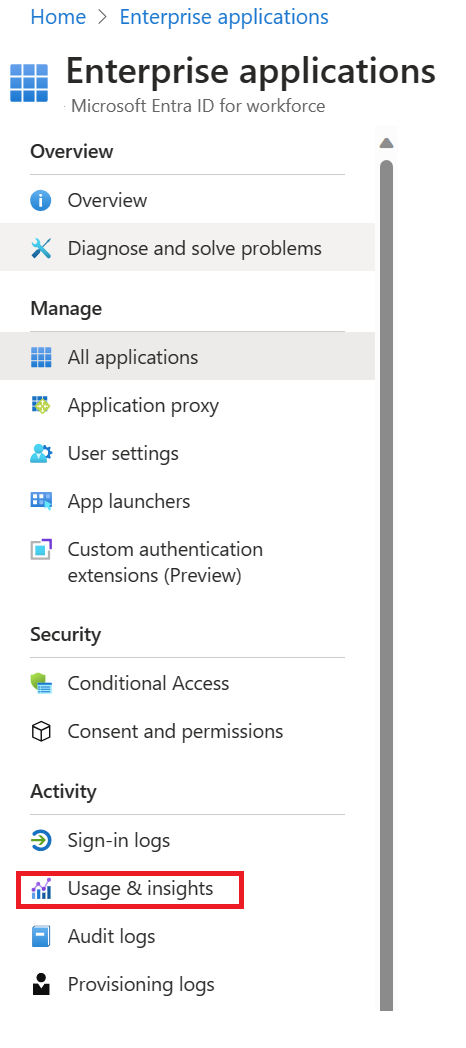
- From the Activity section, select Usage & insights to open the report.
Use the report
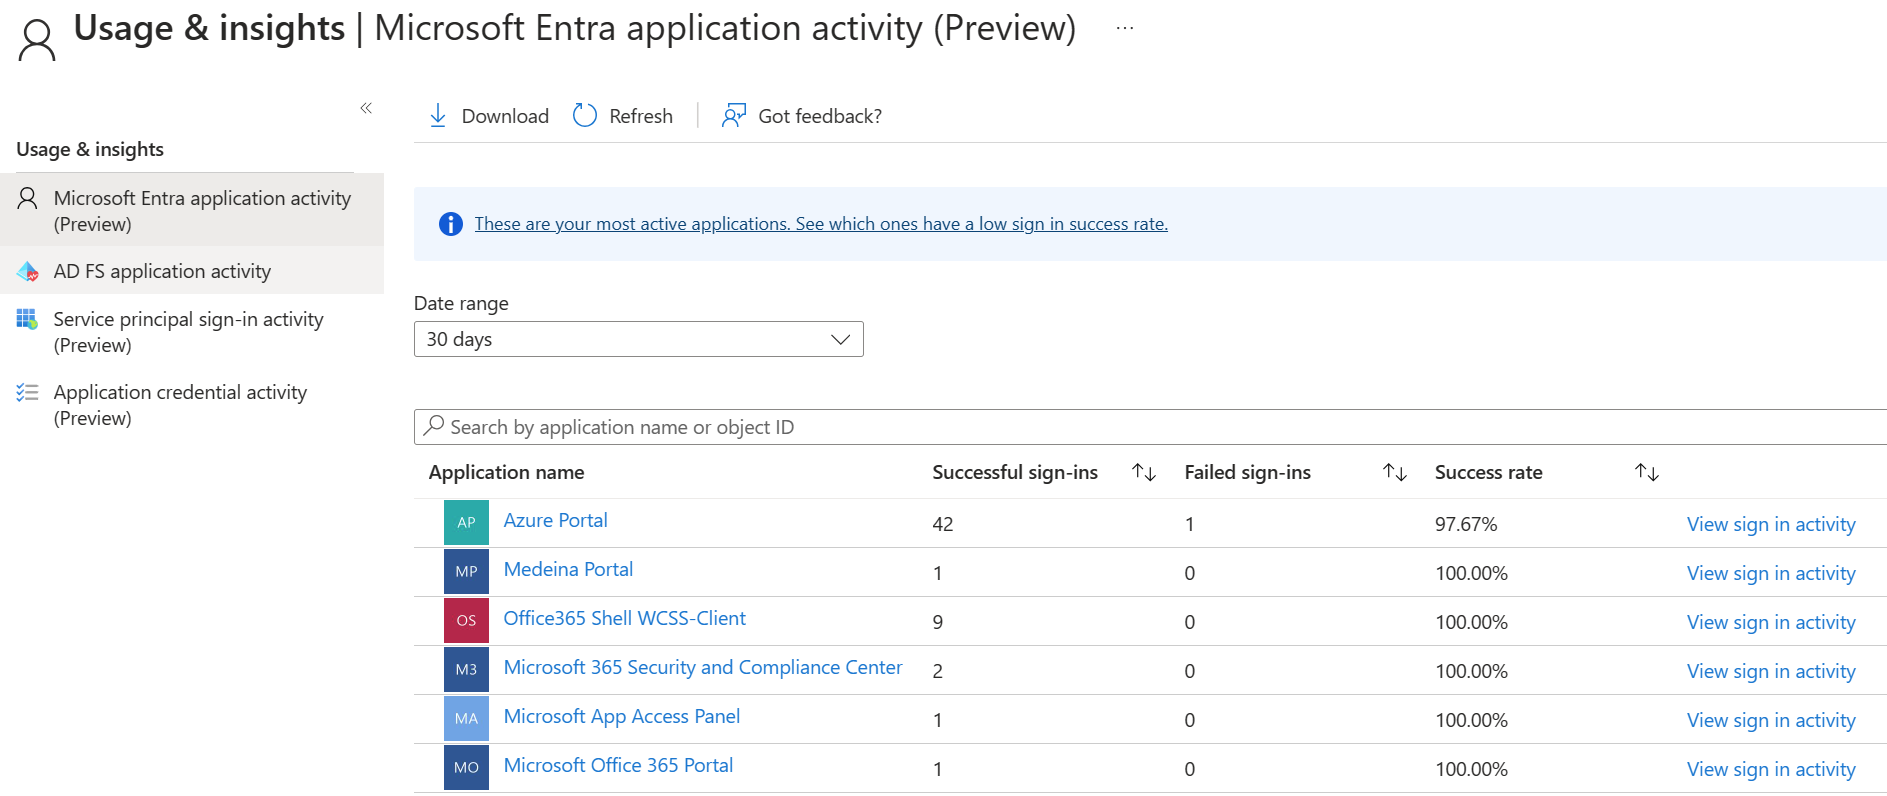
The usage and insights report shows the list of applications with one or more sign-in attempts and allows you to sort by the number of successful sign-ins, failed sign-ins, and the success rate.
Selecting load more at the bottom of the list allows you to view more applications on the page. You can select the date range to view all applications that have been used within the range.
You can also set the focus on a specific application. Select view sign-in activity to see the sign-in activity over time for the application and the top errors.
When you select a day in the application usage graph, you get a detailed list of the sign-in activities for the application.
Audit logs
The Microsoft Entra audit logs provide records of system activities for compliance. Users in the Security Administrator, Security Reader, Report Reader, Global Reader or Global Administrator roles can access their data. To access the audit report, select Audit logs in the Monitoring section of Microsoft Entra ID.
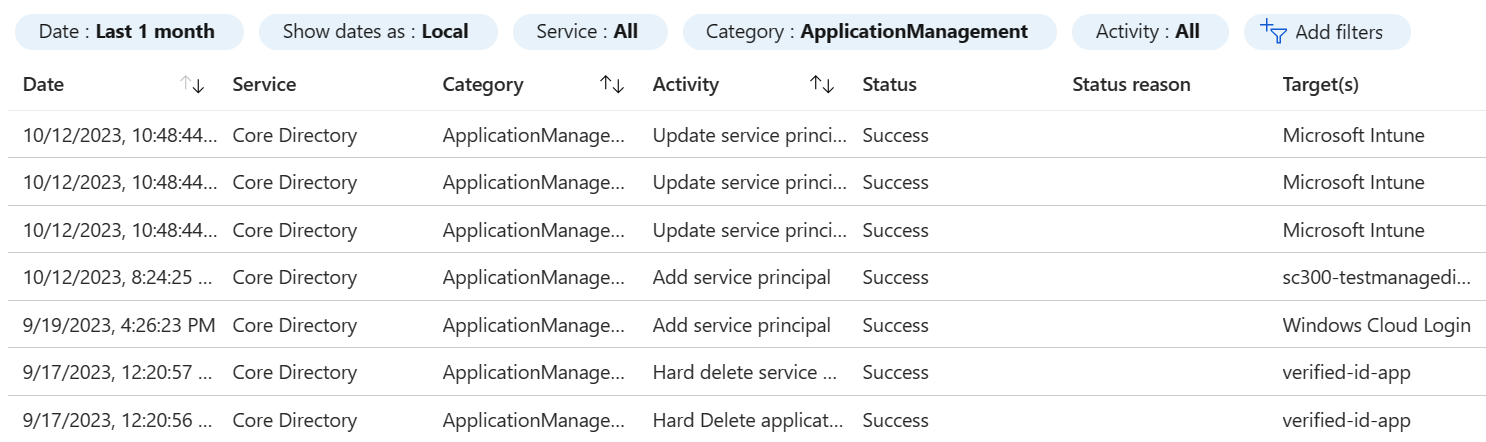
An audit log has a default list view that shows:
- the date and time of the occurrence
- the service that logged the occurrence
- the category and name of the activity (what)
- the status of the activity (success or failure)
- the target
- the initiator/actor (who) of an activity
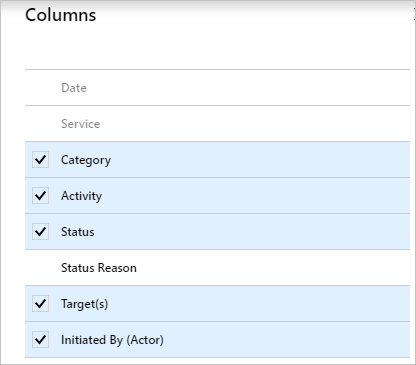
You can customize the list view by clicking Columns in the toolbar.
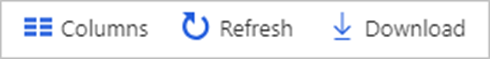
This enables you to display other fields or remove fields that are already displayed.
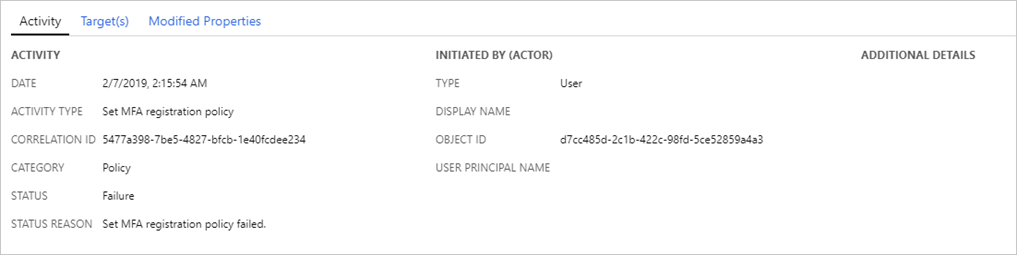
Select an item in the list view to get more detailed information.
Enterprise applications audit logs
With application-based audit reports, you can get answers to questions such as:
- What applications have been added or updated?
- What applications have been removed?
- Has a service principal for an application changed?
- Have the names of applications been changed?
- Who gave consent to an application?
If you want to review audit data related to your applications, you can find a filtered view under Audit logs in the Activity section of the Enterprise applications screen. This entry point has Enterprise applications preselected as the Application Type.